
Comparison Between the Effects of Continuous and non-Continuous
Visual Feedback on Motor Learning While Playing a
Muscle-Controlled Serious Game
Julia Habenicht
1
and Elsa Andrea Kirchner
1,2
1
University of Duisburg-Essen, Bismarckstraße 81 47057 Duisburg, Germany
2
Robotics Innovation Center, German Research Center for Artificial Intelligence,
Robert-Hooke-Straße 1 28359 Bremen, Germany
Keywords: Muscle-Controlled Serious Game, Motor Learning, Visual Feedback, Electromyogram, Continuous Feedback.
Abstract: The guidance hypothesis suggests that continuous feedback during learning may lead to feedback dependency,
with errors decreasing when feedback is provided and increasing when it is removed. This study investigates
the effect of continuous (CVF) versus non-continuous visual feedback (NCVF) on motor learning using a
muscle- controlled serious game. Subjects played the game for three consecutive days, with each day
consisting of seven training sets and one learning control set without feedback. One group received CVF
during training, while the other received NCVF. To assess transferability, the results of the learning control
sets were compared between groups. Time to success during training decreased for CVF, and average time to
reach the longest correct time period in the learning control set was higher for CVF compared to NCVF. The
number of missed goals decreased for CVF, aligning with the expected positive impact of continuous feedback
during training. However, the results for the learning control sets were inconclusive. While CVF showed a
potential dependency on feedback, the decrease in missed goals indicates improved motor learning. More test
days and subjects are required to confirm the findings and draw definitive conclusions regarding the guidance
hypothesis.
1
INTRODUCTION
Learning a new motor task can be difficult, especially
the learning of fine motor movements can be
challenging. The guidance hypothesis predicts that
the guiding properties of extended feedback are
positive for motor learning when used to decrease
errors during the task but can also lead to a
dependency on this feedback (Winstein, Pohl, &
Lewthwaite, 1994, Fuchs, Knauer, & Friedrich, 2018).
Therefore, a highly directive form of feedback could
be detrimental to learning. Furthermore, the guidance
hypothesis expects that practicing with a high relative
frequency of reinforced feedback will have a negative
effect on learning. (Winstein, Pohl und Lewthwaite
1994).
There are still controversies about the guidance
hypothesis today (McKay, et al. 2022). Sülzenbrück
& Heuer conducted a study in which subjects had to
move a courser, receiving either continuous feedback
or terminal feedback. During the task, the group that
received continuous feedback achieved better results
for the end position of the cursor. After practicing
with one of the feedback methods, subjects had to
perform the movement without feedback. The group
with terminal visual feedback achieved better results
compared to the group receiving continuous visual
feedback. (Sülzenbrück und Heuer, 2011)
Another study of Marco-Ahulló et al. investigated
the effect of different visual feedback frequencies
during a balance task on performance of a post-test
without feedback. Results presented in this study
show that reduced feedback is more effective at
learning a postural task than continuous feedback.
(Marco- Ahulló, et al. 2024) An increased
performance in arm movements by using less feedback
compared to 100% feedback was shown in a study of
Suvillian, Kantak and Burtner as well.
On the other hand, a conducted study of Goodwin
achieved better results in stability while performing
a balance task after practicing with concurrent
feedback compared to less feedback (Goodwin 2019).
A study investigating the acceleration of shoulder
Habenicht, J. and Kirchner, E. A.
Comparison Between the Effects of Continuous and non-Continuous Visual Feedback on Motor Learning While Playing a Muscle-Controlled Serious Game.
DOI: 10.5220/0013171100003911
Paper published under CC license (CC BY-NC-ND 4.0)
In Proceedings of the 18th International Joint Conference on Biomedical Engineering Systems and Technologies (BIOSTEC 2025) - Volume 1, pages 899-906
ISBN: 978-989-758-731-3; ISSN: 2184-4305
Proceedings Copyright © 2025 by SCITEPRESS – Science and Technology Publications, Lda.
899

flexions achieved equal or surpass results with
concurrent visual feedback compared to terminal
feedback (Yamamoto und Ohashi 2014). Results of
the study from Wulf, Shea and Matschiner provide
support for the notion that higher feedback
frequencies are beneficial for the learning of a
complex motor skill. Subjects had to perform a virtual
slalom skiing task. Their findings suggests that there
may be an interaction between task difficulty and
feedback frequency. (Wulf, Shea und Matschiner
1998)
The current state of the art shows, that there are still
controverses according continuous and non-
continuous visual feedback in motor learning.
Improving motor skills can be beneficial for
rehabilitation, sport, or daily living situations.
Therefore, the investigation of the different feedback
methods is important. For this reason, the aim of this
study is to investigate continuous and non-continuous
visual feedback on learning the precise control of
muscle activity with a muscle controlled serious game
in a training and a learning control scenario.
2
METHODS
2.1
Participants
In the experiment 12 healthy subjects (7 males and 5
females; average age 27 ±4) voluntarily participated.
All subjects were righthanded in accordance to the
Edinburgh handedness inventory (Oldfield 1971).
Subjects gave their written informed consent to the
experiment and were told that they were allowed to
stop the experiment at any time without any
consequences. Subjects were divided in two groups
consisting of six subjects each. One group received
continuous visual feedback and the other group
received non-continuous visual feedback. The group
selection was randomized.
2.2
Data Acquisition
The following descriptions of the serious game and
the experimental set-up is an adapted version of an
(Habenicht and Kirchner 2024). The difference
between the previous paper is non-continuous visual
feedback which was substituted with the before used
auditory feedback.
Electromyography (EMG)
For measuring muscle activity, subjects were
prepared with surface EMG electrodes before the
experiment started. A bipolar 16 channel EMG
system from Cometa was used. After skin
preparation, which included the cleaning with
alcohol, the electrodes were placed on the m. flexor
digitorum. The placement was based on the SENIAM
guidelines (Hermens, et al. 2000). to ensure that the
electrode is in the same position for each
measurement, the electrode position was documented
with photos.
2.2.1
Serious Game
Serious games are games, which aren’t there just for
fun but also to have positive effects on the player
(Olgers, de Weg and Ter Maaten 2021). The serious
game consists of a column divided into four areas
(Figure 1). These areas can be reached by a bar,
which is controlled by the contraction of the m.
flexor digitorum muscle. this muscle was used
because it is considered easy to use. Since all
muscles are activated in the same way, it should be
possible to draw conclusions about the possible
behavior of the other muscles. Next to the areas the
digits 0,1,5, and 10 are shown. The aim of the game
is to reach the areas of the digit (1,5, and 10)
displayed in randomized order as accurately as
possible with the muscle-controlled bar. The digit to
be reached is clearly displayed above the column.
The bar must be in the range of the displayed digit
for at least three seconds. As soon as the bar is in the
correct range, a countdown of three seconds appears
After the three seconds in the goal area the bar must
be steered into the 0 range by relaxing the muscle.
After another three seconds in this area, the next digit
to be reached will be displayed. The next goal to
reach will only appear, when the one before was
successfully reached.
The group that receives continuous visual
feedback (CVF) can see the moving bar and its current
position all the time.
The group with non-continuous visual feedback
(NCVF) can only see the bar when it is in the correct
area of the column. When the bar is outside of the area
of the goal, it will not be displayed.
Before playing, the game had to be calibrated. We
used the maximum muscle activity. The average of a
five-second maximum muscle contraction (MVC)
was calculated. The areas of the column were defined
based on the average MVC value. The MVC value
represents 100%. A detailed description of which
number corresponds to which muscle activity relative
to MVC can be seen in Table 1.
BIOSIGNALS 2025 - 18th International Conference on Bio-inspired Systems and Signal Processing
900
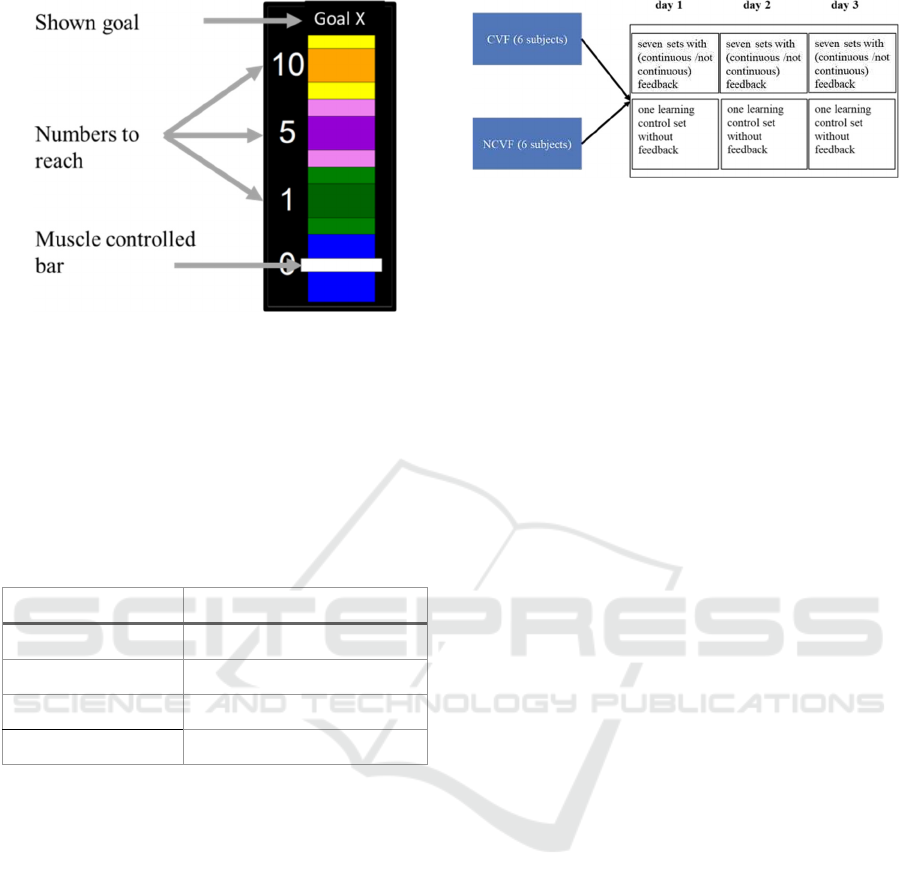
Figure 1: Muscle-controlled serious game. The white bar is
controlled by muscle activity and moves when muscle
activity changes. The digits 1, 5 and 10 are the goals to
reach. These goals are shown above the column. When the
bar was steered in the correct goal area, a countdown of
three seconds appears. After holding the bar in the correct
range for three seconds, the muscle can be relaxed and the
next goal to reach is displayed.
Table 1: Goals with the corresponding muscle activity
calculated out of the maximal voluntary contraction
(MVC).
goals muscle activity
goal 0 0%-20% of MVC
goal 1 20%-40% of MVC
goal 5 40%-60% of MVC
goal 10 60%-80% of MVC
2.2.2
Experimental Set-up
Seven sets of the game were played for training with
a following learning control set each of the three days
in a row. In each set (training and learning control set)
every number had to be reached three times. The
order was randomized. The learning control set
consists of a set in which the subjects didn’t receive
any feedback of the game. It just showed the target
and the subjects had to contract the muscle the right
way out of their memory. After they assumed they
were in the right area for least three seconds without
feedback, they had to relax the muscle and the next
target was displayed. A detailed description of the
experimental design is depicted in Figure 2.
Figure 2: Description of the experimental setup. Subjects of
both groups played the game on three days in a row. Every
day consists of playing seven sets with one of the feedback
methods and one set of a learning control set without
feedback.
2.2.3
Data Processing
The analysis of the data is divided into two parts. The
analysis of the training set data and the analysis of the
learning control set data. The analyzed training set
data consists of the data collected from the moment
that the goal to reach was displayed till the moment
the goal was achieved. Out of these data the average
time taken by a subject to achieve each goal of the
training sets was determined. The time was calculated
over seven training sets for each goal on each day for
all subjects.
For the learning control sets, the period from the
moment that the goal was displayed until the muscle
was relaxed again (reached area “0”) was determined.
It was calculated for every goal on each day for all
subjects of each group. Subjects had to reach each
goal for three times. As no feedback was given during
the learning control set, subjects did not know
whether or when they achieved the goal. To evaluate
the success the average longest time period
(calculated out of three) that a subject spent
continuously in the respective goal areas was
determined for each day. The time needed to achieve
this longest continuous time period in the correct
range was determined. This was carried out for each
subject on each day for all goals
As the test subjects did not receive any feedback
in this sets, they may not have achieved the targets at
all. The total missed goals were calculated for each
subject of the groups as well.
For the analysis of the results of the training sets,
time needed to reach the goals was investigated. The
detection of motor learning in the learning control set
is counted as a decrease in missed goals. An increase
in time (s) spent in the correct area and a decrease in
time (s) to achieve the longest period of time spend in
the correct range will be also counted as a learning
effect.
Comparison Between the Effects of Continuous and non-Continuous Visual Feedback on Motor Learning While Playing a
Muscle-Controlled Serious Game
901
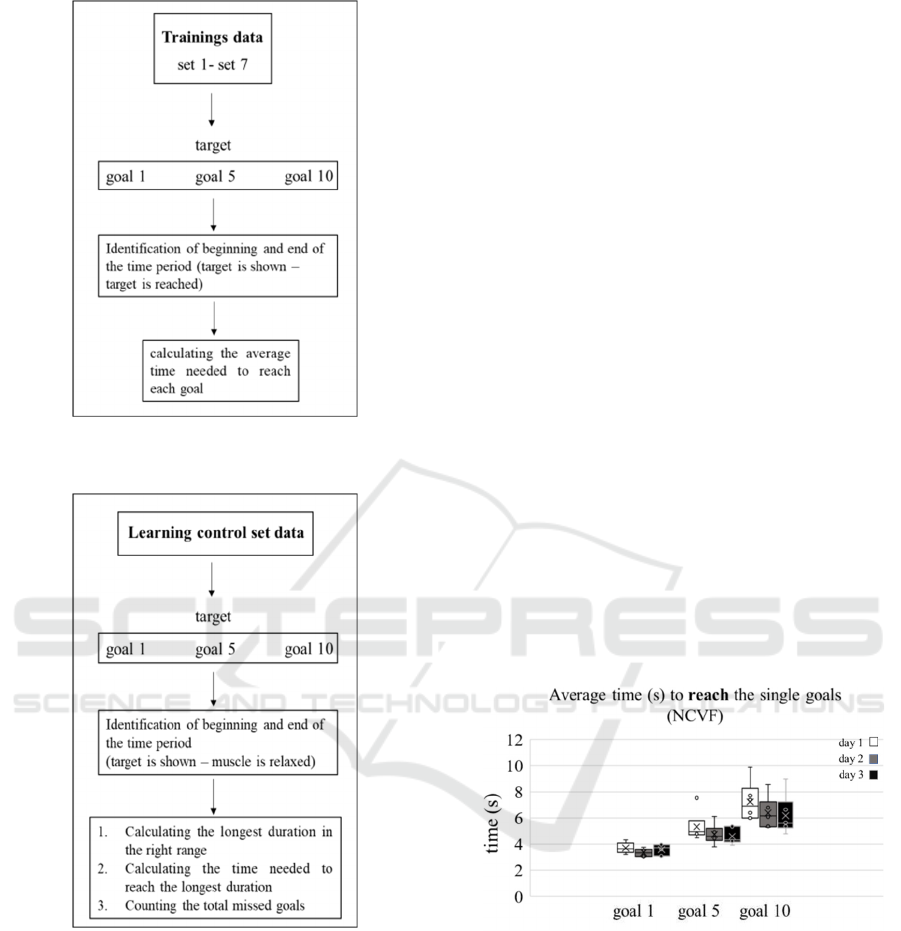
Figure 3: Description of the data processing of the training
set data. This process was applied every day’s data sets.
Figure 4: Description of the data processing of the learning
control set data. This process was applied on every learning
control set data.
2.3
Statistical Analysis
For the statistical analysis a two-sided independent,
not paired Wilcoxon-Mann-Whitney test was
performed. The data for the analysis consists of two
parts. First the average time needed to reach each goal
on each day was calculated. The test was performed
between the average time of the CVF group and the
NCVF group of each day individually. Second, the
average time needed to achieve the longest period of
time continuously spend in the correct range was also
analyzed. The test was performed between the
average time of the CVF group and the NCVF group
of each day individually. The significance value was
set to p< 0.05.
3
RESULTS
3.1
Results of the Training Sets
The following section consists of the analysis of the
time needed to reach the goals in the training sets. The
time is given in seconds.
3.1.1
Analysis of the Time Needed to Reach
the Goal
Figure 5 depicts the comparison of the average time
(s) the NCVF group needed to succeed in each goal
between the training sets of the three days. The
average time to reach the single goals decreased for
goal 5 and goal 10 within the days. For goal 1 the time
was lowest on day 2 and highest on day 1 and day 3.
The highest time differences occurred between day 1
and day 2 in goal 10. The lowest differences were
found between the time differences of goal 1. Goal 1
was reached fastest on every day. Goal 10 was
reached slowest on every day.
Figure 5: Comparison of the average time (s) the NCVF
group needed to succeed in each goal between the training
sets of the three days.
Figure 6 depicts the comparison of the average time
(s) the CVF group needed to succeed in each goal
between the training sets of the three days. It can be
seen that the average time to reach the single goals
decreases for every goal over the days. The highest
time differences occurred between day 1 and day 2 in
goal 10. The lowest differences were found between
the time differences of goal 1. Goal 1 was reached
fastest on every day. Goal 10 was reached slowest on
every day.
BIOSIGNALS 2025 - 18th International Conference on Bio-inspired Systems and Signal Processing
902
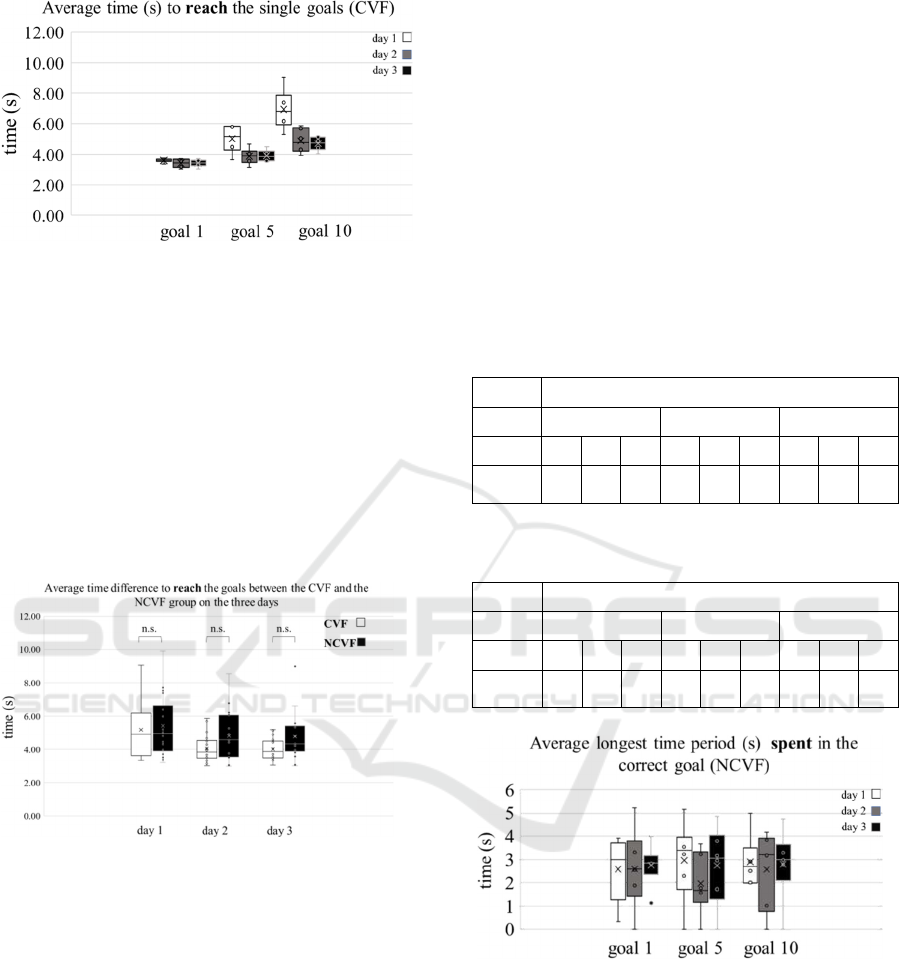
Figure 6: Comparison of the average time (s) the CVF
group needed to succeed in each goal between the training
sets of the three days.
Figure 7 depicts the comparison of the average time
to reach the goals between the CVF group and the
NCVF group of the three days. Each Boxplot consist
of the average time for reaching the goals in the
training sets of each subject in the groups. The
average time for reaching the goals decreases for both
groups within the days. On day 2 and day 3 the needed
time for reaching the goals is less in the CVF group
compared to the times of the NCVF group. However,
these results are not significant.
Figure 7: Comparison of the average times needed to reach
the goals in the training sets between the CVF and the
NCVF groups on three days.
3.2
Results of the Learning Control Set
The following section consists of the analysis of the
total number of missed goals and the time needed to
reach the goals in the learning control sets. The time
is given in seconds.
3.2.1
Analysis of the Total Number of Missed
Goals
Subjects had to reach every goal three times in one
learning control set. Table 2 depicts the total number
of missed goals on every day in the NCVF group. For
goal 1 the number of missed goals does decrease from
five to zero within the three days. The missed goals
for goal 1 consist of three subjects. For goal 5 the
missed goals were five for day 1, seven on day 2 and
four on day 3 (5 subjects). The missed goals for goal
10 on day 1 was one, on day two it was five and four
on day 3 (3 subjects).
The total number of missed goals on every day of
the CVF group is depicted in Table 3. For goal 1 the
missed goals on day 1 were 0, on day 2 five and on
day 3 the number of missed goals was one (3
subjects). For goal 5 the missed goals on day 1 and
day 2 were two and on day 3 three. For goal 10 the
number of missed goals was one on every day.
Table 2: Total missed goals of the NCVF group in the
learning control sets of each day.
total missed goals NCVF group
Goal 1 Goal 5 Goal 10
day 1 2 3 1 2 3 1 2 3
missed
goals
5 3 0 5 7 4 1 5 4
Table 3: Total missed goals of the CVF group in the
learning control sets of each day.
total missed goals CVF group
Goal 1 Goal 5 Goal 10
day 1 2 3 1 2 3 1 2 3
missed
goals
0 5 1 2 2 3 1 1 1
Figure 8: Comparison of the average longest period of time
(s) spent in the correct goal between the three days.
Depicted is the NCVF group in the learning control set.
3.2.2
Analysis of the Time (S) Needed to
Reach the Goal
As in the learning control set no feedback was given
on how many seconds were spent in the right range,
the longest duration spent in the right range was
calculated as well as the time needed to achieve the
longest time period spent in the correct goal.
Comparison Between the Effects of Continuous and non-Continuous Visual Feedback on Motor Learning While Playing a
Muscle-Controlled Serious Game
903
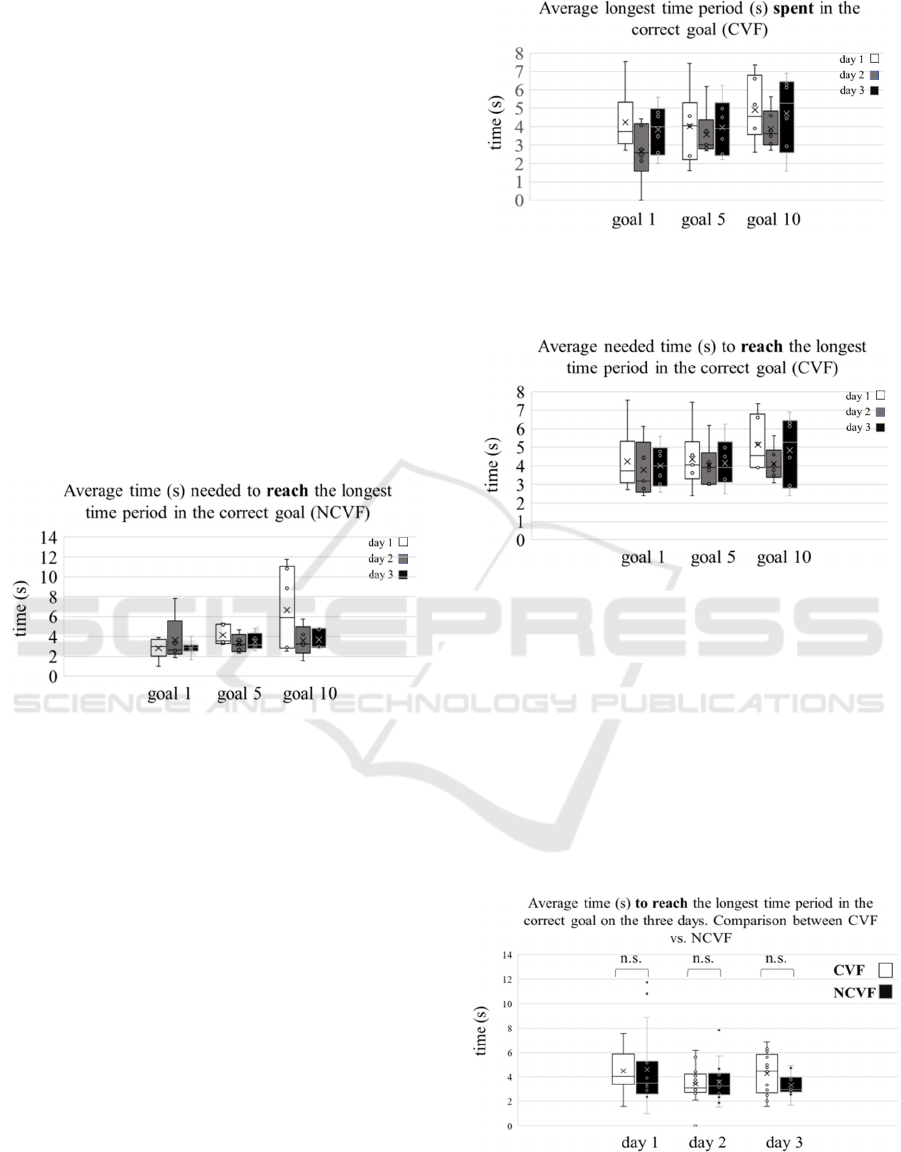
Figure 8 depicts the comparison of the average
longest period of time spent continuously in the
correct goal between the three days of the NCVF
group. For goal 1 and goal 5 the longest period of time
spent continuously in the right range was on day 1 and
the shortest on day 2. The median is around 3 seconds
on day 1 and day 3. For goal 10 the longest period of
time spent continuously in the correct range was
achieved on day 2 and the shortest on day 1. The
median is around 3 seconds on day 2 and day 3.
Figure 9 depicts the comparison of the average
time(s) needed to reach the correct goal between the
three days of the NCVF group. Longest time to reach
longest period of time spent continuously in the
correct goal was needed on day 1 for every goal. For
goal 1 the shortest time was needed on day 2. The
shortest time needed to reach the longest period of
time spent continuously in the correct range for goal
5 and goal 10 was on day 3. The time decreases for
every goal within the days.
Figure 9: Comparison between the average time (s) needed
to reach the longest time period in the correct goal between
the three days. Depicted is the NCVF group in the learning
control set.
Figure 10 depicts the comparison of the average
longest time period (s) spent continuously in the
correct goal between the three days of the CVF group.
For goal 1 and goal 10 the longest period of time spent
continuously in the right range was achieved on day
3 and the shortest on day 2. For goal 5 the longest
period of time spent continuously in the correct goal
was on day 1 and the shortest on day 2 as well. Apart
from goal 1 on the second day, the targets were
always held for at least three seconds on average.
Figure 11 depicts the average needed time to reach
the longest period of time spent continuously in the
correct goal for each goal on every day. For goal 1
and goal 10 the shortest time needed to reach the
longest period of time spent continuously in the
correct goal was achieved on day 2 and the longest
time was needed on day 3. For goal 5 the time slightly
decreases within the days.
Figure 10: Comparison of the average longest duration (s)
spent in the correct goal between the three days. Depicted
is the CVF group in the learning control set.
Figure 11: Comparison of the average time (s) needed to
reach the longest duration in the correct goal between the
three days. Depicted is the CVF group in the learning
control set.
Figure 12 depicts the comparison of the average time
needed to reach the longest period of time in the
correct goal between the CVF group and the NCVF
group of the three days. Each Boxplot combines the
data of all goals of each day.
The CVF group needed more time compared to
the NCVF group on day 1 and day 3. On day 2 both
groups are almost the same. However, the results are
not significant.
Figure 12: Comparison of the average time needed to reach
the longest period of time in the correct goal on each day
between the CVF group and the NCVF group in the
learning control set.
BIOSIGNALS 2025 - 18th International Conference on Bio-inspired Systems and Signal Processing
904

4
DISCUSSION
Both groups improved their average time to succeed in
reaching the goals in the training sets within the days.
However, the success in the training sets for the CVF
group was faster on average although the differences
are not significant. It seems that continuous visual
feedback helped reaching the goals faster although
differences were not significant. This criterion corres-
ponds more to a training effect than a learning effect.
Based on the results from the training sets, the
decrease in the time to reach the correct target could
lead to the assumption that there was an improvement
in the CVF compared to the NCVF.
However, if we now look at the results from the
learning control sets, this does not appear to be
transferable. Since a countdown of three seconds was
displayed in the training sets when the bar was in the
correct area, the sense of timing could be practiced.
Except of day 2, the CVF group spent on average
more than 3 seconds in the correct area. The NCVF
group spent on average very close to three seconds in
the correct range on all three days. This could lead to
the assumption that the CVF group was more
uncertain or more cautious in the execution of the task
which could be a sign of stronger dependency on
feedback. Moreover, the time required to reach the
longest period of continuous time spent at the correct
target decreased in the NCVF group. In the CVF
group, this time increased on the third day compared
to day 1. On the other hand, the number of missed
targets was lower in the CVF group than in the NCVF
group. While some criteria that were defined as motor
learning for the learning control sets were fulfilled by
both of the groups the observed results appear to be
controversial. One could assume that the CVF group
was more insecure in the learning control sets, which
is why they needed more time to reach the targets and
stayed longer in the targets to make sure they had
reached them long enough. Nevertheless, fewer goals
were missed in the CVF group. The observed
improvement in the time to achieve the goals in the
learning control sets for the NCVF group as well as
the more exact duration in the correct goal compared
to the CVF group is consistent with results from
previous studies, which showed that a greater learning
effect occurs with non-continuous feedback
compared to continuous feedback (Marco- Ahulló, et
al. 2024; Sullivan, Kantak und Burtner 2008;
Sülzenbrück und Heuer, 2011).
Nevertheless, the results of our study must be
interpreted with caution, as our results are not
significant and some are controverse. To be able to
make a clear statement regarding the guidance
hypothesis, it would be useful to carry out more than
three training days and more test subjects to see
whether more of the defined criteria for motor
learning are fulfilled and whether the found
differences prove to become significant with a larger
number of subjects.
5
CONCLUSION
Both groups fulfill predefined criteria for motor
learning, even though the results are not statistically
significant. Since some of the results are
controversial, extending the investigation to more
than three test days and including additional subjects
would be beneficial in order to provide a clearer
statement regarding the guidance hypothesis.
ETHICS STATEMENT
The studies involving human participants were
approved by the local Ethical Committee of the
University of Duisburg-Essen, Germany. The
participants provided their written informed consent
to participate in this study.
REFERENCES
Fuchs, Dominik, Martin Knauer, and Petra Friedrich.
„Chancen von akustischem Feedback für die
motorische Rehabilitation am Beispiel.“ DAGA.
München, 2018.
Goodwin, Jeff E. "Scheduling Concurrent Visual Feedback
in Learning a Continuous Balance Task." Journal of
Motor Learning a Development, 2019.
Habenicht, Julia, and Elsa Andrea Kirchner. „Preliminary
Results on the Evaluation of Different Feedback
Methods for the Operation of a Muscle-Controlled
Serious Game.“ 17th International Conference on Bio-
inspired Systems and Signal Processing. Rom, 2024.
Hermens, H J, B Freriks, C Disselhorst-Klug, and G Rau.
„Development of recommendations for SEMG sensors
and sensor placement procedure.“ Journal of
Electromyography and Kinesiology, October 2000.
Marco-Ahulló, Adria, Israel Villarrasa-Sapiña, Jorge
Romero-Martínez, Gonzalo Monfort-Torres, Jose Luis
Toca-Herrera, und Xavier García-Massó. „Effect of
Reduced Feedback Frequencies on Motor Learning in a
Postural Control Task in Young Adults.“ Sensors,
2024.
MathWorks.. https://de.mathworks.com/help/dsp/ug/sliding-
window-method-and-exponential-weighting-method.ht
ml (Last access: March 2024).
Comparison Between the Effects of Continuous and non-Continuous Visual Feedback on Motor Learning While Playing a
Muscle-Controlled Serious Game
905

McKay, Brad, Julia Hussien, Mary-Anne Vinh, Alexandre
Mir-Orefice, Hugh Brook, and Diane M Ste-Marie.
„Meta-analysis of the reduced relative feedback
frequency effect on motor learning and performance.“
Psychology of Sport and Exercise, July 2022.
Oldfield, R C. "The assessment and analysis of handedness:
the Edinburgh inventory." Neuropsychologie, March
1971.
Olgers, T. J., de Weg, A. A., & Ter Maaten, J. C. (2021,
January 25). Serious Games for Improving Technical
Skills in Medicine: Scoping Review. JMIR Serious
Games.
Ranganathan, Vinoth K, Vlodek Siemionow, Jing Z Liu,
Vinod Sahgal, and Guang H Yue. „From mental power
tu muscle power-gaining strength by using mind.“
Neuropsychologia, 2004.
Sullivan, Katherine J, Shailesh S Kantak, and Patricia A
Burtner. „Motor learning in children: feedback effects on
skill acquisition .“ Physical Therapy, June 2008: 720-
732.
Sülzenbrück, Sandra. Zeitschrift für Psychologie, 2012.
Sülzenbrück, Sandra, and Herbert Heuer. „Type of visual
feedback during practice influences the precision of the
acquired internal model of a complex visuo-motor
transformation .“ Ergonomics, January 2011.
Thongpanja, Sirinee, et al. „Effects of Window Size and
Contraction Types on the Stationarity of Biceps Brachii
Muscle EMG Signals.“ INRIA.HAL.SCIENCE, 2014.
Uma, B. V., M. Vishnu Priya, P. Harshita, and K.N. Maruthy.
"Assessment of Hand Grip Strength & Fine Motor Skills
in Skilled & Non Skilled Persons." International Journal
pf Physiology, 2019.
Winstein, C J, P S Pohl, und R Lewthwaite. „Effects of
physical guidance and knoledge of results on motor
learning: support for the guidance hypothesis.“ Research
quarterly for exercise and sport, December 1994.
Wulf, G, C H Shea, and S Matschiner. „Frequent feedback
enhances complex motor skill learning .“ Journal of
Motor Behavior, June 1998.
Yamamoto, Ryohei, and Yukari Ohashi. „The Effects of
Inaccessible Visual Feedback Used Concurrently or
Terminally.“ Journal of Physical Therapy Science, 2014:
731-735.
BIOSIGNALS 2025 - 18th International Conference on Bio-inspired Systems and Signal Processing
906
