
Smartphone Inertial Sensors in Gait Analysis: A Comparison with a
Commercial Device
Marco Oliveira
1 a
, William Fr
¨
ohlich
1 b
, Rafael Baptista
1 c
, Sandro Rigo
2 d
and C
´
esar Marcon
1 e
1
School of Technology, Pontifical Catholic University of Rio Grande do Sul (PUCRS), Porto Alegre, Brazil
2
Universidade do Vale do Rio dos Sinos (UNISINOS), S
˜
ao Leopoldo, Brazil
Keywords:
Gait, Inertial Sensors, Biomechanics, Smartphone, Wearable Sensors.
Abstract:
Human gait analysis is a crucial tool in healthcare, providing valuable insights into an individual’s well-being,
as various disorders and diseases can be detected through changes in walking patterns. This study aims to
validate the gait sensing results obtained from a smartphone, an easily accessible and portable device, by
comparing them with equivalent data from the G-Walk, a widely used commercial equipment. The goal is to
assess the applicability and accuracy of the solution with the support of healthcare professionals, ensuring its
effectiveness in clinical settings.
1 INTRODUCTION
This paper presents a detailed investigation of using
inertial sensors embedded in smartphones, such as ac-
celerometers and gyroscopes, for human gait analysis.
The study compares the sensing results obtained from
a smartphone with those obtained from a commercial
device, specifically the G-Walk (BTS Bioengineering,
2024) system, a widely recognized tool for biome-
chanics assessments. Our validation goal is to deter-
mine whether smartphone data can be utilized to de-
velop an algorithm capable of analyzing gait patterns,
serving as a reliable substitute for established tools.
G-Walk is used in clinical settings to evaluate
movement and gait, serving as a benchmark for re-
liability in motion analysis. The validation devel-
oped during this paper focuses on assessing the com-
parability of data collected by the smartphone with
G-Walk measurements across various parameters. If
smartphones provide sufficiently accurate data for the
future development of algorithms designed for gait
pattern recognition, they could enable routine mon-
itoring of gait-related health conditions in everyday
settings, transforming how gait analysis is performed
and expanding its applications in healthcare.
a
https://orcid.org/0009-0003-7625-0735
b
https://orcid.org/0000-0003-3551-2623
c
https://orcid.org/0000-0003-1937-6393
d
https://orcid.org/0000-0001-8140-5621
e
https://orcid.org/0000-0002-7811-7896
2 RELATED WORK
Gait analysis is a valuable tool in healthcare, tradi-
tionally relying on methods such as optical motion
capture systems, force platforms, and pressure sen-
sors. While these methods are considered highly ac-
curate, they are often expensive and require special-
ized setups that normally involve complex data pro-
cessing, limiting their use outside clinical environ-
ments (Hausdorff and Alexander, 2005).
Wearable technologies and smartphones, how-
ever, typically feature embedded Inertial Mea-
surement Units (IMUs)—accelerometers and gyro-
scopes—which serve as affordable and portable al-
ternatives for gait analysis. Their accessibility allows
for broader use beyond clinical settings. Research has
demonstrated that smartphone accelerometer and gy-
roscope data can yield gait analysis results compara-
ble to those produced by traditional methods (Caro-
Alvaro et al., 2024).
The quality of data from smartphone sensors can
significantly impact the accuracy of gait analysis. To
mitigate this, preprocessing techniques such as noise
filtering, signal normalization, and feature extraction
are applied to make raw sensor data more usable.
Standard filtering methods, like the Kalman filter,
help reduce noise (Kim et al., 2018), while frequency-
domain techniques such as the Fourier Transform
aid in identifying gait patterns within acceleration
data (Shi et al., 2023). Additionally, studies have
shown the effectiveness of preprocessing across var-
ious walking conditions and sensor placements (Ar-
shad et al., 2022) (Ramli et al., 2024).
Oliveira, M., Fröhlich, W., Baptista, R., Rigo, S. and Marcon, C.
Smartphone Inertial Sensors in Gait Analysis: A Comparison with a Commercial Device.
DOI: 10.5220/0013172700003911
Paper published under CC license (CC BY-NC-ND 4.0)
In Proceedings of the 18th International Joint Conference on Biomedical Engineering Systems and Technologies (BIOSTEC 2025) - Volume 2: HEALTHINF, pages 595-602
ISBN: 978-989-758-731-3; ISSN: 2184-4305
Proceedings Copyright © 2025 by SCITEPRESS – Science and Technology Publications, Lda.
595
Machine learning techniques have further en-
hanced gait analysis by enabling the automated de-
tection of gait events. Commonly used algorithms
in this field include Convolutional Neural Networks
(CNNs) and Long Short-Term Memory (LSTM) net-
works, which are particularly well-suited for analyz-
ing time-series sensor data. LSTM networks, in par-
ticular, can outperform traditional techniques in rec-
ognizing gait phases (Huang et al., 2021) (Marimon
et al., 2024), and combining CNNs with LSTM net-
works has proven effective in classifying complex gait
patterns (Das et al., 2022).
While techniques used in G-Walk (BTS Bioengi-
neering, 2024) offer highly detailed data using spe-
cialized hardware, smartphone-based gait analysis
aims to replicate this precision at a lower cost. Pre-
vious studies have found that calibrated smartphone
sensors can closely match the performance of widely
used commercial equipment when used under con-
trolled conditions (Lopez-Nava et al., 2020). How-
ever, several challenges remain for smartphone-based
gait analysis to achieve the accuracy of traditional
methods. Factors such as variations in sensor qual-
ity across smartphone models, noise from different
sensor attachment methods, and environmental influ-
ences like walking speed or uneven surfaces can af-
fect the results. Ongoing validation, calibration, and
algorithm improvements are necessary to ensure the
reliability of smartphone-based gait analysis in real-
world scenarios (Kocuvan et al., 2023).
This study builds on previous research by com-
paring smartphone sensor data with the G-Walk sys-
tem to assess the viability of smartphones as data-
gathering tools for gait monitoring.
3 MATERIALS AND METHODS
This section outlines the data collection, processing,
and analysis procedure to ensure the study follows a
robust methodological framework. All essential ele-
ments were carefully addressed to enable the valida-
tion of the smartphone-based method as a reliable al-
ternative to established systems used in gait analysis.
3.1 Sensors Specifications
Comparing the hardware specifications of the sensors
was essential for an initial compatibility evaluation,
ensuring that both devices have a similar capacity for
capturing data. This subsection presents the main
specifications of the sensors.
The ’device info’ function in Phyphox (Staacks
et al., 2018) was used to discover the hardware con-
tained in the smartphone. The main sensor is the
LSM6DSO from STMicroelectronics. Its specifica-
tions are as follows (STMicroelectronics, 2024):
• Accelerometer: 16-bit/axis triaxial accelerome-
ter with a full-scale range of ±2, ±4, ±8, ±16 g
• Gyroscope: 16-bit/axis triaxial gyroscope with
a full-scale range of ±125, ±250, ±500, ±1000,
±2000 °/s
The G-Walk has three main sensors, but since this
paper does not address the usage of the magnetome-
ter, the specifications of the two sensors used are as
follows (BTS Bioengineering, 2024):
• Accelerometer: 16-bit/axis triaxial accelerome-
ter with a full-scale range of ±2, ±4, ±8, ±16 g
• Gyroscope: 16-bit/axis triaxial gyroscope with a
full-scale range of ±250, ±500, ±1000, ±2000 °/s
An initial evaluation shows that both devices
have identical accelerometer hardware specifications.
However, the main difference for the gyroscope is that
the LSM6DSO is better suited for measuring low-
speed rotations, as it offers an additional range of
±125 degrees per second.
3.2 Data Gathering
The initial step involved collecting raw gait data from
our reference commercial system using inertial sen-
sors from both the smartphone and G-Walk.
The smartphone application Phyphox (Staacks
et al., 2018) captures linear acceleration and angu-
lar velocity. Phyphox is an open-source tool devel-
oped by RWTH Aachen University, allowing access
to all available sensor data on smartphones. The pri-
mary sensors used in this study include accelerome-
ters, which measure linear acceleration (in m/s²), and
gyroscopes, which measure angular velocity (in °/s).
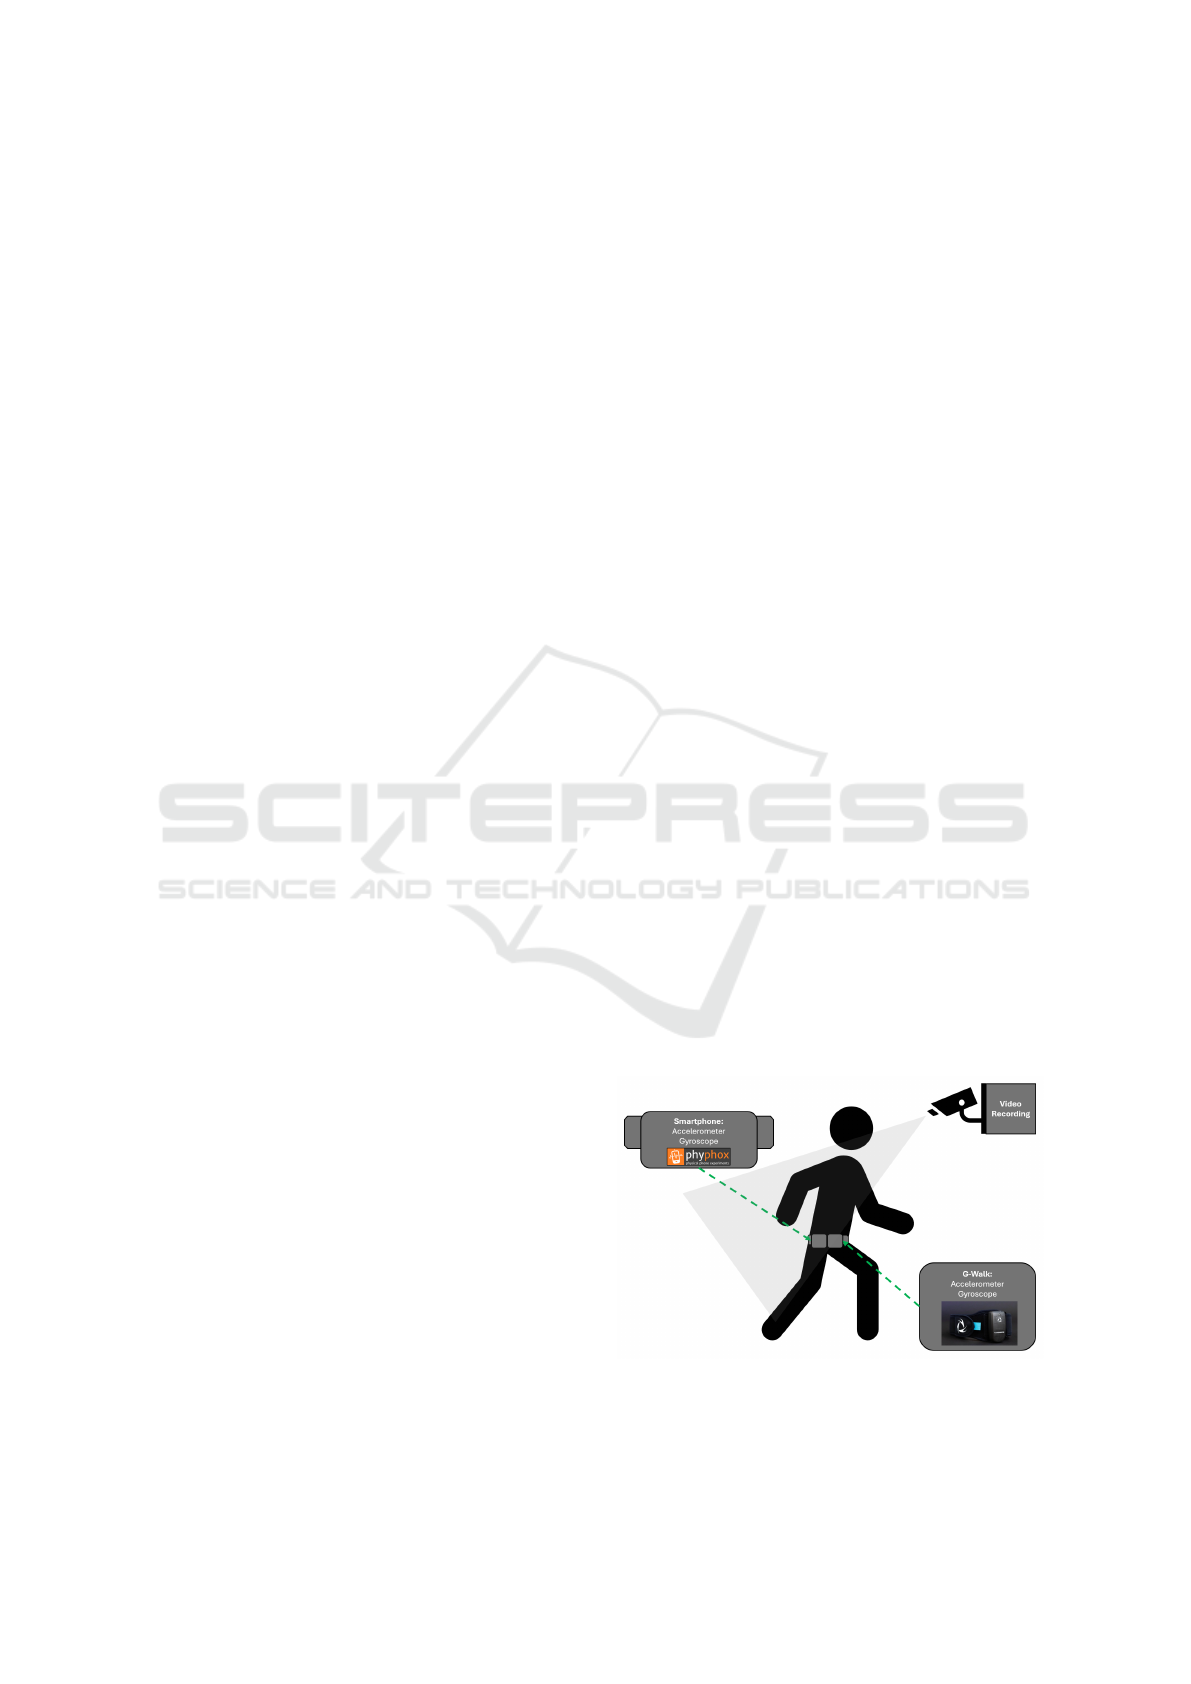
Figure 1: Methodology used in the trial.
Figure 1 shows that both devices—the smartphone
and G-Walk—were mounted on the subject’s waist
HEALTHINF 2025 - 18th International Conference on Health Informatics
596
using a running belt. This placement was selected
because it is the standard position for using the G-
Walk system, allowing for direct comparisons. Ad-
ditionally, it ensures consistency in the data collec-
tion process, as this location effectively captures hip
motion. Both devices recorded data simultaneously
while walking to minimize variations caused by sep-
arate data collection sessions.
The trial consisted of a single subject walking reg-
ularly along a straight path. It lasted approximately 40
seconds, during which 60 steps were recorded. This
number was determined empirically by analyzing a
video recorded during data collection. The video was
also used for time synchronization purposes.
The data was saved in a structured format. Phy-
phox generated a spreadsheet containing the smart-
phone data, and the G-Walk system provided a text
file with the recorded signals and a report summariz-
ing the gait analysis.
3.3 Preprocessing
Several steps were taken to prepare the data for fur-
ther analysis, primarily because the data from Phy-
phox and G-Walk were in different formats. The first
step was to ensure compatibility between the datasets
by renaming columns, converting units, and ensuring
consistent time references.
The initial timestamps were discrepant since the
recordings were manually started on both devices. An
offset correction was applied to align the timestamps,
ensuring both datasets had a common structure for
more straightforward analysis. Additionally, an ex-
tra offset adjustment was made to ensure that the zero
level of each axis was consistent across both datasets.
Following the data cleaning and synchronization,
some features were calculated from the raw signals.
The columns below were added to both datasets:
• Absolute acceleration - calculated as the magni-
tude of the acceleration vector, combining the X,
Y, and Z axes;
• Absolute angular velocity - similar to absolute
acceleration, but for the gyroscope data;
• Roll, Pitch, and Yaw - obtained by integrating the
angular velocity over time, allowing the analysis
of rotational motion.
3.4 Visual Comparison
Before conducting a more advanced statistical analy-
sis, a visual comparison was used to evaluate the col-
lected data preliminary. This approach provided an
intuitive way to assess the similarity between the sig-
nals captured from the smartphone and those from the
G-Walk system.
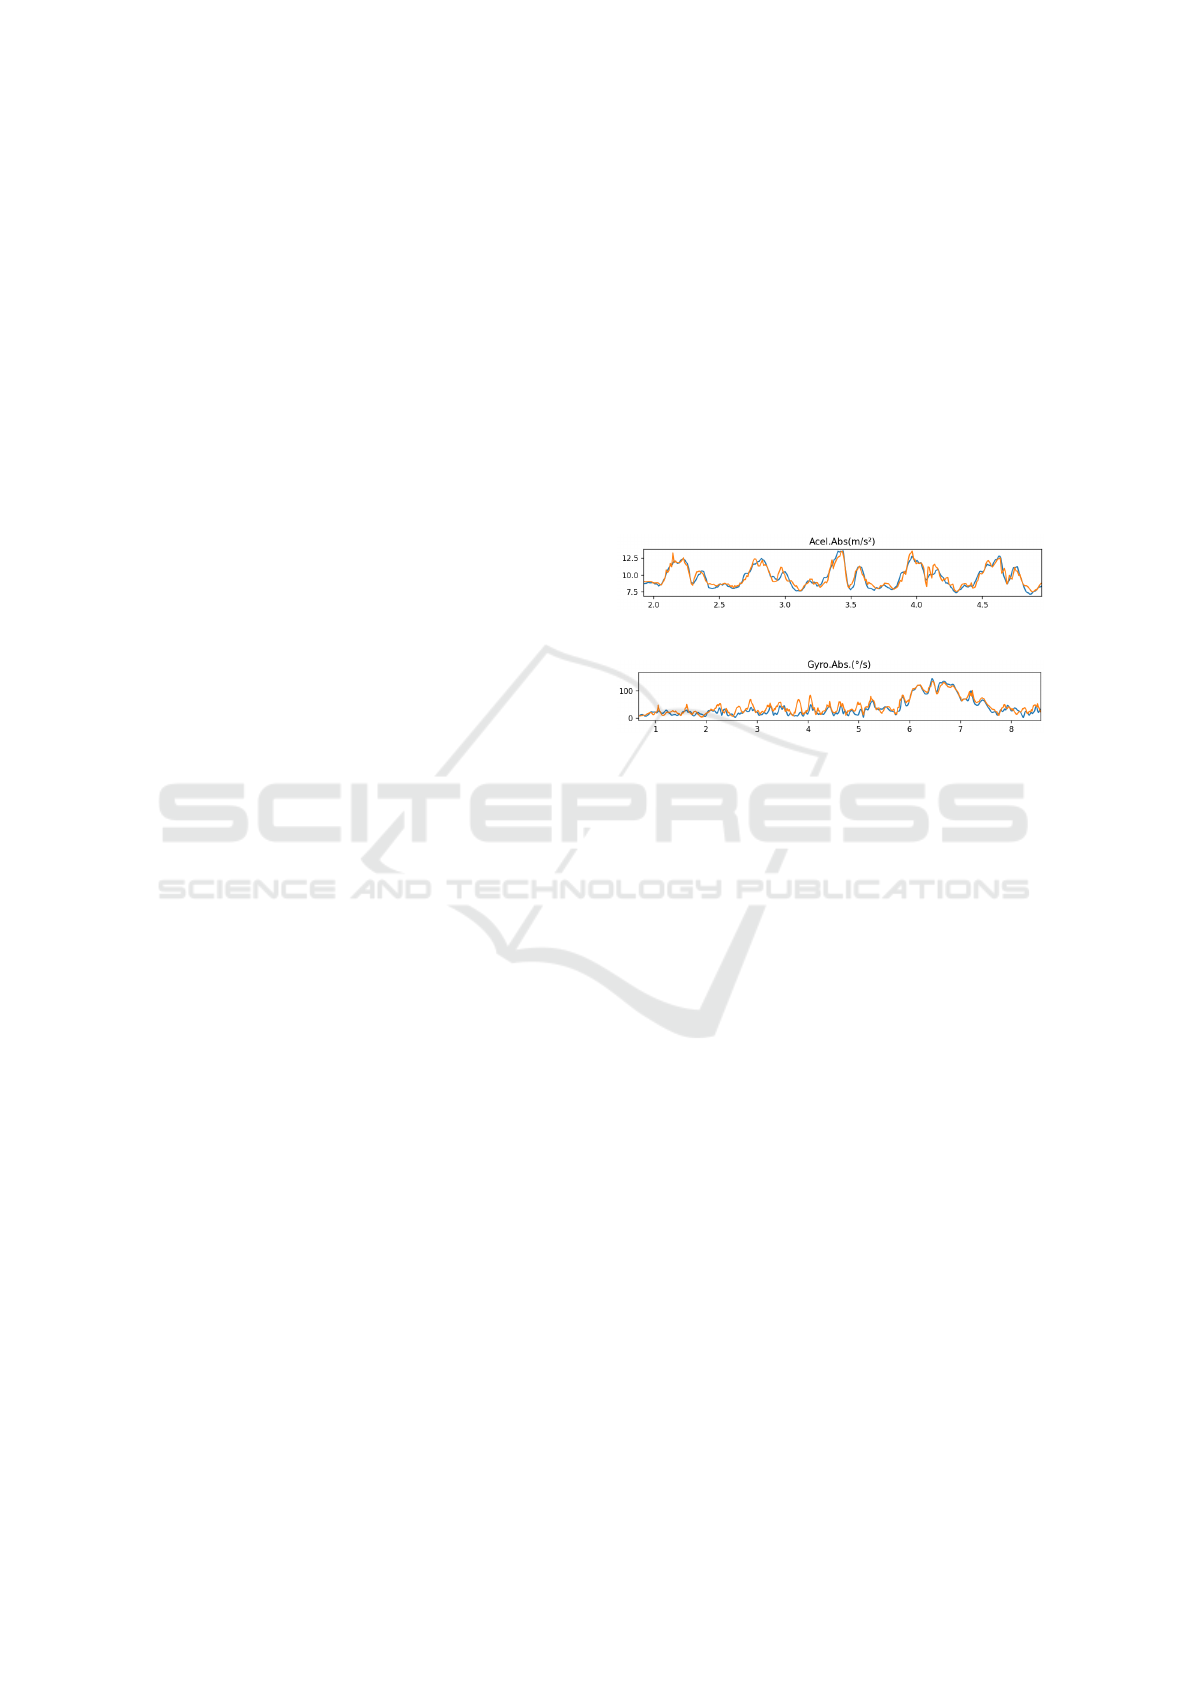
The primary method involved creating figures to
overlay the smartphone and G-Walk time-series data:
acceleration and angular velocity. Specific data seg-
ments were enlarged to focus on individual gait cycles
to facilitate this comparison. These zoomed-in figures
provided a closer look at the alignment of peaks and
the shape of the waveforms, helping to identify mi-
nor differences that might not be as evident in full-
length plots. The zoomed-in figure for the accelerom-
eter data is presented in Figure 2, while the zoomed-in
figure for the gyroscope data is shown in Figure 3.
Figure 2: Accelerometer time series zoomed-in.
Figure 3: Gyroscope time series zoomed-in.
3.5 Statistical/Hypothesis Test
This section outlines the steps taken for data prepro-
cessing and the statistical methods used to compare
the datasets collected by the wearable device and the
smartphone.
3.5.1 Data Preprocessing
Initially, the raw data underwent preprocessing to en-
sure consistency and comparability between the de-
vices. Invalid values recorded during data collection
were first removed. Next, interpolation techniques
were applied to address missing data (NaN values)
and fill gaps in the time series. A low-pass Butter-
worth filter was then used to eliminate high-frequency
noise that could distort the signal and affect the qual-
ity of subsequent analyses. The StandardScaler nor-
malization technique was applied to standardize the
datasets, ensuring that both were on the same scale,
which is critical for meaningful comparisons.
The two devices had different sampling rates, so
the datasets were synchronized using a temporal ap-
proximation technique. This alignment was essential
to ensure that data points from both devices corre-
sponded to the same events in time, allowing for an
accurate comparison between the specialized sensors
of the wearable device and the general-purpose IMU
sensors of the smartphone.
Smartphone Inertial Sensors in Gait Analysis: A Comparison with a Commercial Device
597

3.5.2 Correlation and Cross-Correlation
We applied correlation techniques to assess the simi-
larity between the data from the two devices. Pearson
correlation was used to measure the linear relation-
ship between the datasets. Pearson is ideal when the
data follows a normal distribution and a linear rela-
tionship between variables is assumed. However, this
method is sensitive to outliers, which can dispropor-
tionately affect the correlation coefficient, potentially
leading to skewed results.
In addition to Pearson, we applied Spearman cor-
relation to evaluate cases where the relationship be-
tween variables might not be strictly linear. Spear-
man is a non-parametric measure of rank correlation,
assessing how well the relationship between two vari-
ables can be described using a monotonic function.
This method does not assume normality or linearity;
it is less sensitive to outliers, making it suitable for
scenarios where the data might contain anomalies or
the relationship between the datasets is non-linear.
We captured linear and non-linear relationships be-
tween the two data sources by combining Pearson and
Spearman correlations.
We also applied cross-correlation to analyze the
temporal alignment between the signals. This tech-
nique identifies the time shift that maximizes the sim-
ilarity between the two signals, enabling us to detect
potential delays or desynchronization between the de-
vices. This is particularly relevant for cyclic events
such as gait, where slight timing discrepancies could
affect the data interpretation.
3.5.3 Bland-Altman Analysis
We employed the Bland-Altman analysis to assess
the agreement between the wearable and smartphone
measurements. This method plots the difference be-
tween the two measurements against their mean, al-
lowing for identifying biases and limits of agreement.
The Bland-Altman plot is handy for detecting system-
atic differences (bias) between methods, something
that correlation analysis alone may fail to reveal. For
instance, even when two methods show high correla-
tion, they may still exhibit a consistent bias, evident
in the Bland-Altman plot but not in the correlation co-
efficient.
3.5.4 Error Analysis: RMSE and MAE
In addition to these qualitative assessments, we quan-
tified the magnitude of the errors between the two
devices using Root Mean Square Error (RMSE) and
Mean Absolute Error (MAE). RMSE emphasizes
more significant deviations by taking the square root
of the average of the squared differences between the
two sets of measurements, making it more sensitive
to substantial errors. In contrast, MAE provides a
straightforward interpretation of the average absolute
error, offering a more robust measure in the presence
of outliers. These error metrics are crucial for evalu-
ating the overall accuracy of the devices in capturing
similar measurements.
3.5.5 Lin’s Concordance Correlation Coefficient
To provide a more robust evaluation of concordance
between the devices, we also computed Lin’s Con-
cordance Correlation Coefficient (CCC). This metric
combines measures of correlation and agreement, as-
sessing how closely the measurements from the two
devices align in trend and magnitude. Lin’s CCC is
beneficial when the goal is to determine if the two
methods are correlated and if their values are similar
in absolute terms.
3.5.6 Fast Fourier Transform Analysis
Lastly, we performed a Fast Fourier Transform (FFT)
analysis to compare the frequency content of the sig-
nals from both devices. FFT decomposes the time-
domain signals into frequency components, enabling
us to assess whether the devices captured the same
dominant frequencies in the gait cycle. Frequencies
related to step cadence and stride patterns are critical
for gait analysis. Differences in the frequency com-
ponents between the two datasets may indicate that
the devices are not capturing the movement dynamics
with the same precision, which could be necessary de-
pending on the intended application of the data.
4 RESULTS AND DISCUSSION
4.1 Correlation and Cross-Correlation
When analyzing Pearson and Spearman correlations
between wearable sensors and smartphones, we ob-
serve varying levels of correlation across acceleration
variables (acc), gyroscope variables (gyro), and rota-
tion angles (roll, pitch, yaw).
From an initial analysis using Pearson correla-
tions, as seen in Figure 4, which measures linear re-
lationships between variables, we find high correla-
tions for most acceleration and gyroscope axes. For
instance, the absolute acceleration (acc abs) shows a
strong correlation of 0.931, suggesting that wearable
devices and smartphones similarly capture overall ac-
celeration magnitude. Gyroscope values exhibit even
HEALTHINF 2025 - 18th International Conference on Health Informatics
598
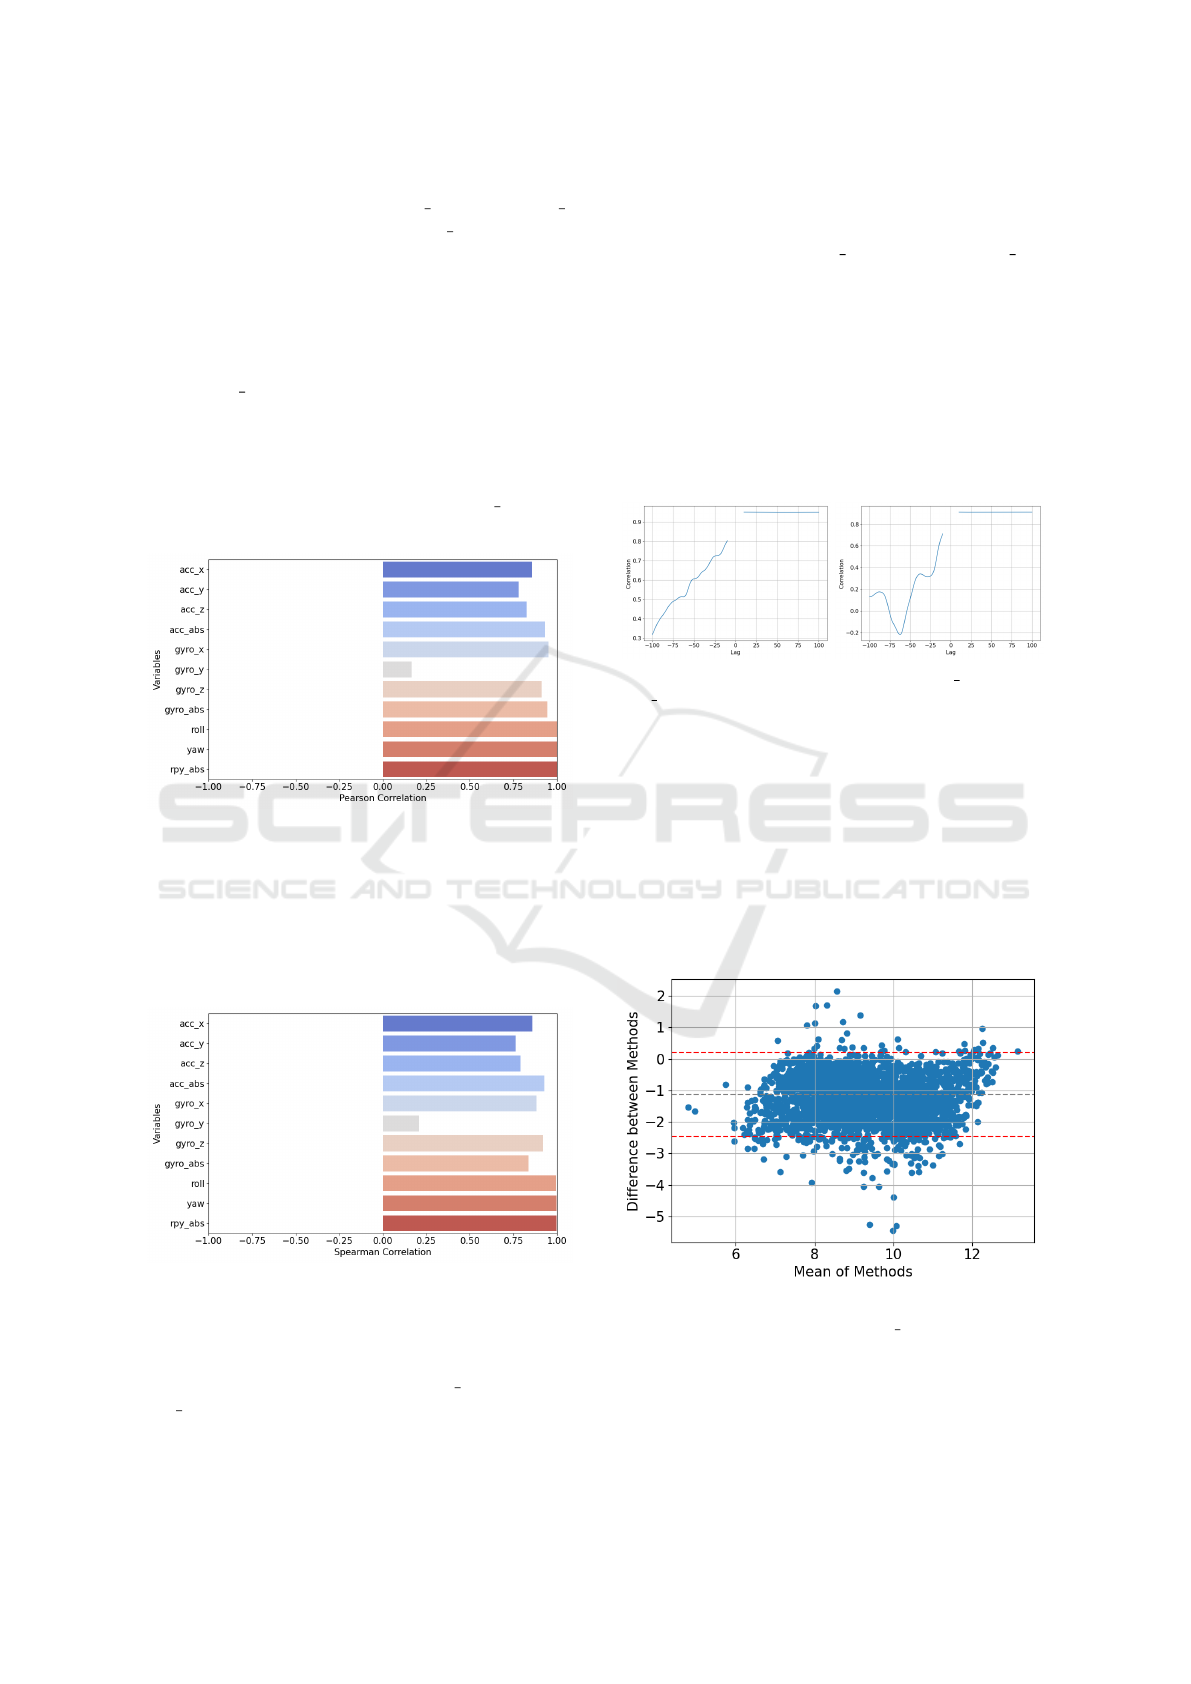
higher correlations, such as gyro x (0.951), gyro z
(0.911), and absolute gyroscope (gyro abs, 0.944), in-
dicating substantial agreement between the sensors in
measuring rotational movement. The highest correla-
tions are found in roll (0.99996) and yaw (0.99976),
reflecting a near-perfect agreement in these rotational
angles. Yet, a fundamental exception is the low cor-
relation in the Y-axis, particularly for the gyroscope,
where gyro y shows a correlation of just 0.165. This
suggests a significant discrepancy between the wear-
able and smartphone measurements on the Y-axis for
gyroscope data. The accelerometer on the Y-axis also
has the lowest correlation among the acceleration axes
but performs significantly better than gyro y, with a
Pearson correlation coefficient of 0.779.
Figure 4: Pearson correlation between wearable sensor and
smartphone data across acceleration, gyroscope, and rota-
tion variables.
Figure 5 also displays Spearman correlations,
measuring monotonic relationships and generally
confirming the patterns observed with Pearson corre-
lations, albeit with some differences.
Figure 5: Spearman correlation between wearable sensor
and smartphone data across acceleration, gyroscope, and ro-
tation variables.
As expected, the Spearman correlations for ac-
celeration are also high, such as acc x (0.858) and
acc abs (0.928), indicating that the overall trend be-
tween the two devices remains strong even when
considering non-linear relationships. However, for
the gyroscope, Spearman correlations are slightly
lower, especially for gyro x (0.884) and gyro abs
(0.835), suggesting that the devices may detect rota-
tions differently, particularly when considering non-
linear movements.
We observed a consistent pattern in the cross-
correlation analysis across all data points analyzed.
There was either a low negative or low positive cor-
relation for negative lag values, with values gradually
increasing. However, the correlation remained stable
at the observed levels for positive lag values, as shown
in Figure 6.
Figure 6: Cross-correlation analysis for gyro x (left) and
gyro z (right), showing correlation patterns across lag val-
ues.
4.2 Bland-Altman Analysis
Figure 7 displays the results for acc
x
using the Bland-
Altman technique, which assesses the agreement be-
tween two measurement methods: a wearable device
and a smartphone. The X-axis represents the average
of the measurements between the two methods, while
the Y-axis shows the difference between these mea-
surements.
Figure 7: Bland-Altman plot comparing wearable sensor
and smartphone measurements for acc x.
The central gray line indicates the mean of the
differences, which is slightly below -1. This sug-
gests that the wearable device tends to register slightly
lower values than the smartphone, revealing a slight
Smartphone Inertial Sensors in Gait Analysis: A Comparison with a Commercial Device
599
negative bias, implying that one device may slightly
underestimate the values.
The red dashed lines mark the limits of agree-
ment, which range approximately from -3 to +1. Most
data points fall within these limits, indicating good
agreement between the methods for most of the data.
However, a few points fall outside these limits, repre-
senting outliers where the devices show more signifi-
cant disagreement. Hence, both methods demonstrate
good agreement on the acc x axis, with a slight nega-
tive bias and relatively consistent differences through-
out the measurements.
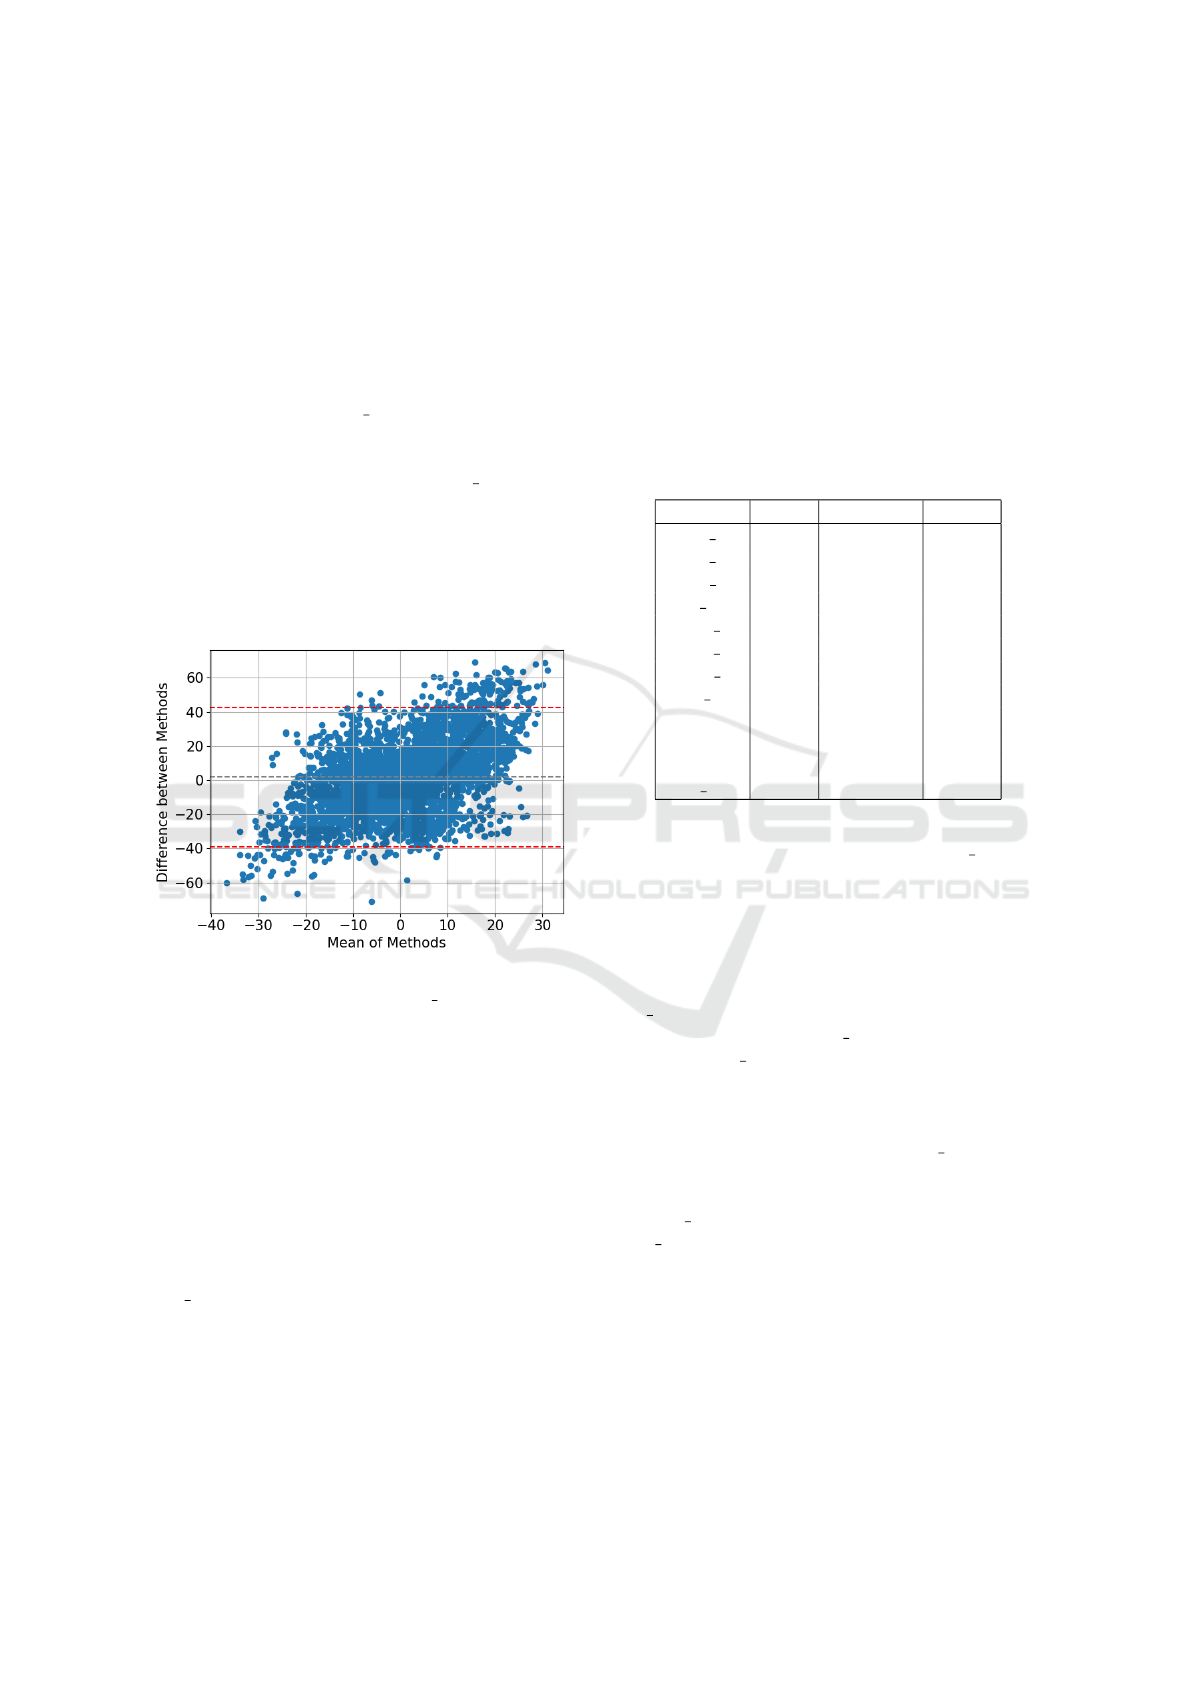
In contrast, Figure 8 analyzes gyro y using the
Bland-Altman agreement technique. The central gray
line represents the mean of the differences, which is
around 0 but shows a slight upward shift. This indi-
cates a small positive bias, suggesting that the wear-
able device records slightly higher values than the
smartphone.
Figure 8: Bland-Altman plot comparing wearable sensor
and smartphone measurements for gyro y.
The red dashed lines mark the limits of agreement,
encompassing most of the data points. These lim-
its, approximately between -40 and +40, represent the
range where most differences are concentrated, with
a few outliers falling outside these limits.
Furthermore, the data suggests a proportional
bias. The agreement between the two methods is
stronger for smaller measurements, but the differ-
ences also tend to grow as the average values in-
crease. This divergence is particularly noticeable dur-
ing faster rotations or larger movements along the
gyro y axis, indicating a potential limitation of the
wearable device in capturing such movements.
4.3 Error Analysis: MSE, RMSE, and
MAE
Table 1 presents the error metrics analyzed in this
study, comparing the results from data obtained using
a wearable sensor and a smartphone. The table high-
lights three key error metrics: Mean Absolute Error
(MAE), Mean Squared Error (MSE), and Root Mean
Squared Error (RMSE).
Table 1: Error metrics (MAE, MSE, RMSE) comparing
wearable sensor and smartphone data across various vari-
ables.
Variable MAE MSE RMSE
acc x 0.416 0.286 0.535
acc y 0.531 0.441 0.664
acc z 0.455 0.346 0.588
acc abs 0.248 0.137 0.370
gyro x 0.237 0.097 0.312
gyro y 1.005 1.668 1.291
gyro z 0.335 0.177 0.421
gyro abs 0.251 0.111 0.333
pitch 1.544 3.349 1.830
roll 0.007 7.712e-05 0.008
yaw 0.018 0.001 0.021
rpy abs 0.004 3.199e-05 0.005
When analyzing the accelerometer variables, we
observe that the absolute acceleration (acc abs) has
the lowest errors across all metrics, with an MAE of
0.248, MSE of 0.137, and RMSE of 0.370. This in-
dicates that the overall magnitude of acceleration is
well-estimated, demonstrating a solid agreement be-
tween the sensors.
Among the individual accelerometer axes, the
acc x axis performs slightly better with an MAE of
0.416, followed by the acc z axis with an MAE of
0.455. The acc y axis shows the highest error among
the accelerometer axes, with an MAE of 0.531, MSE
of 0.441, and RMSE of 0.664, indicating lower preci-
sion on this axis.
For the gyroscope variables, the gyro x axis stands
out with the lowest errors, showing an MAE of 0.237,
MSE of 0.097, and RMSE of 0.312, followed closely
by gyro abs with similar values. In contrast, the
gyro y axis presents significantly higher errors, with
an MAE of 1.005, MSE of 1.668, and RMSE of 1.291,
indicating considerable inaccuracy in gyroscope mea-
surements on this axis. This discrepancy reflects a
more significant variation between the wearable and
smartphone sensors and aligns with the previously an-
alyzed correlation values.
The rotation angles (pitch, roll, yaw) also exhibit
error variability. The roll angle shows the lowest er-
HEALTHINF 2025 - 18th International Conference on Health Informatics
600
rors, with minimal values (MAE of 0.007), suggest-
ing almost no discrepancy. The yaw angle performs
slightly worse, though still very accurate, with an
MAE of 0.018. On the other hand, the pitch angle has
the highest errors among the rotation variables, with
an MAE of 1.544, MSE of 3.349, and RMSE of 1.830,
indicating more incredible difficulty in estimating this
angle.
Overall, the results show strong agreement be-
tween the sensors for most variables, with notable ex-
ceptions for the gyro
y
axis and the pitch angle, which
present higher error levels.
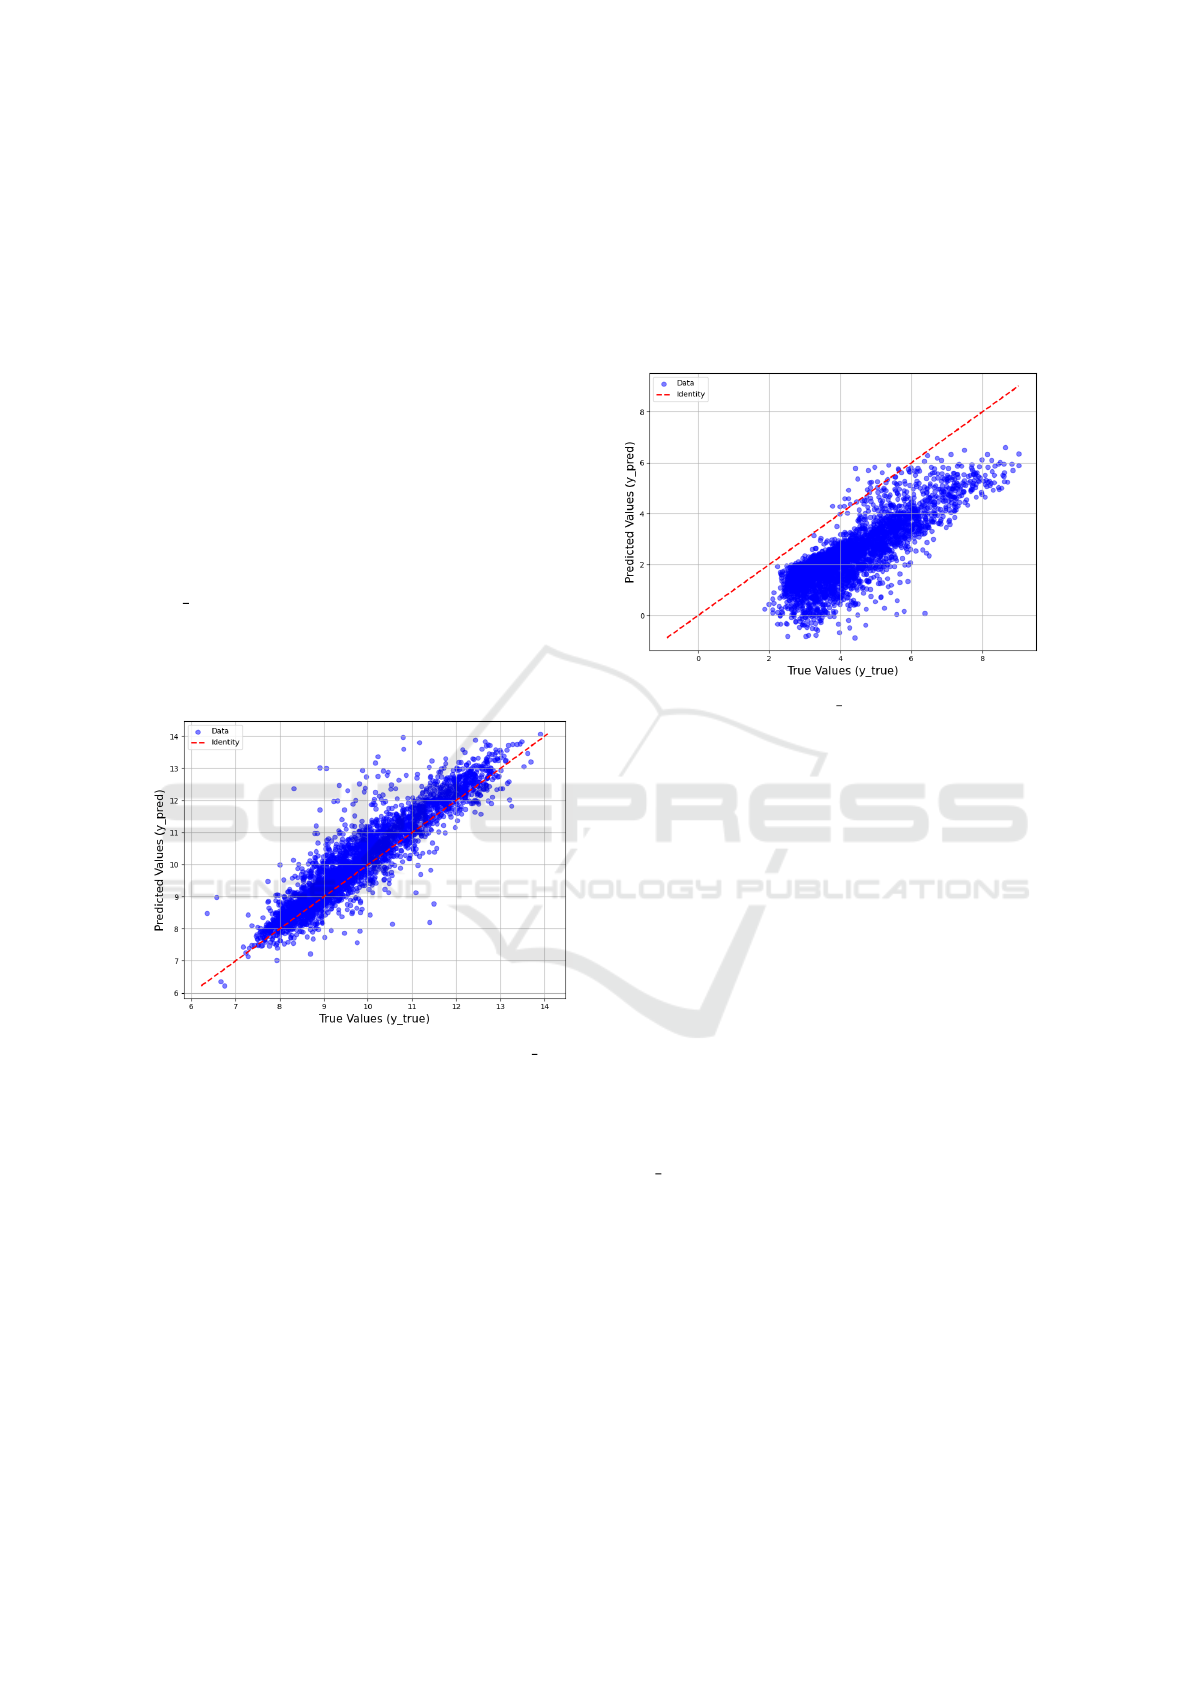
4.4 Lin’s Concordance Correlation
Figure 9 depicts the results of the Concordance Cor-
relation Coefficient (CCC) for absolute acceleration
(acc abs). We have the actual and predicted values
on the X and Y axes. Each blue dot corresponds to a
pair of actual and predicted values from the dataset,
while the red dashed line represents the identity line,
which indicates perfect agreement.
Figure 9: Lin’s CCC for absolute acceleration (acc abs),
showing agreement between wearable sensor and smart-
phone measurements.
We can discern a strong positive correlation be-
tween the actual and predicted values. Most points
are clustered around the red identity line, indicating a
good fit. However, some variations are present, par-
ticularly at the higher and lower extremes, suggest-
ing potential limitations in extreme conditions. The
spread of the points suggests a certain degree of vari-
ability. Yet, the strong clustering near the identity line
reassures us about the model’s accuracy in capturing
the overall trend, suggesting that the model or sensors
perform well but may show limitations in extreme
conditions, where predictions deviate slightly from
the actual values. Nonetheless, the overall alignment
with the identity line indicates good agreement be-
tween the actual and predicted measurements. How-
ever, Figure 10 shows a strong correlation between the
points. Still, they show a slight offset below the red
identity line, indicating that the data does not exhibit a
perfect concordance correlation, therefore, there may
be variations in magnitude compared to absolute ac-
celeration, demonstrating a closer correlation.
Figure 10: Lin’s CCC for acc z, showing slight deviations
from the identity line.
4.5 Fast Fourier Transform Analysis
Figure 11 shows the first analysis with the FFT ap-
plied to acc
x
. We observed a very sharp peak around
0 Hz in magnitude and frequency, indicating a dom-
inant frequency component near zero and predomi-
nantly low-frequency components, with minimal vari-
ation in magnitude outside the central peak. This sug-
gests that the accelerometer’s X-axis data contains a
significant DC component or a slow-moving trend.
The accelerometer on the X-axis may be sensing min-
imal or constant motion over time, leading to this
dominant low-frequency component. The sharp peak
near 0 Hz implies that both datasets recorded mini-
mal acceleration on the X-axis, indicating little to no
significant movement or only slow changes.
Figure 12 displays the second signal analyzed -
gyro
y. This figure shows more distributed peaks cen-
tered around 0 Hz, with visible spikes across the fre-
quency range. We identified higher frequencies, indi-
cating more variability or dynamic activity in the gy-
roscope’s Y-axis data. The signal’s amplitude is also
more spread, suggesting that the gyroscope detected
rotational movements oscillating at different frequen-
cies. This could result from rotational motion or ori-
entation changes, causing the gyroscope’s Y-axis to
pick up varying frequencies. Both devices recorded
rotational movements on the Y-axis but with different
frequency components.
Smartphone Inertial Sensors in Gait Analysis: A Comparison with a Commercial Device
601
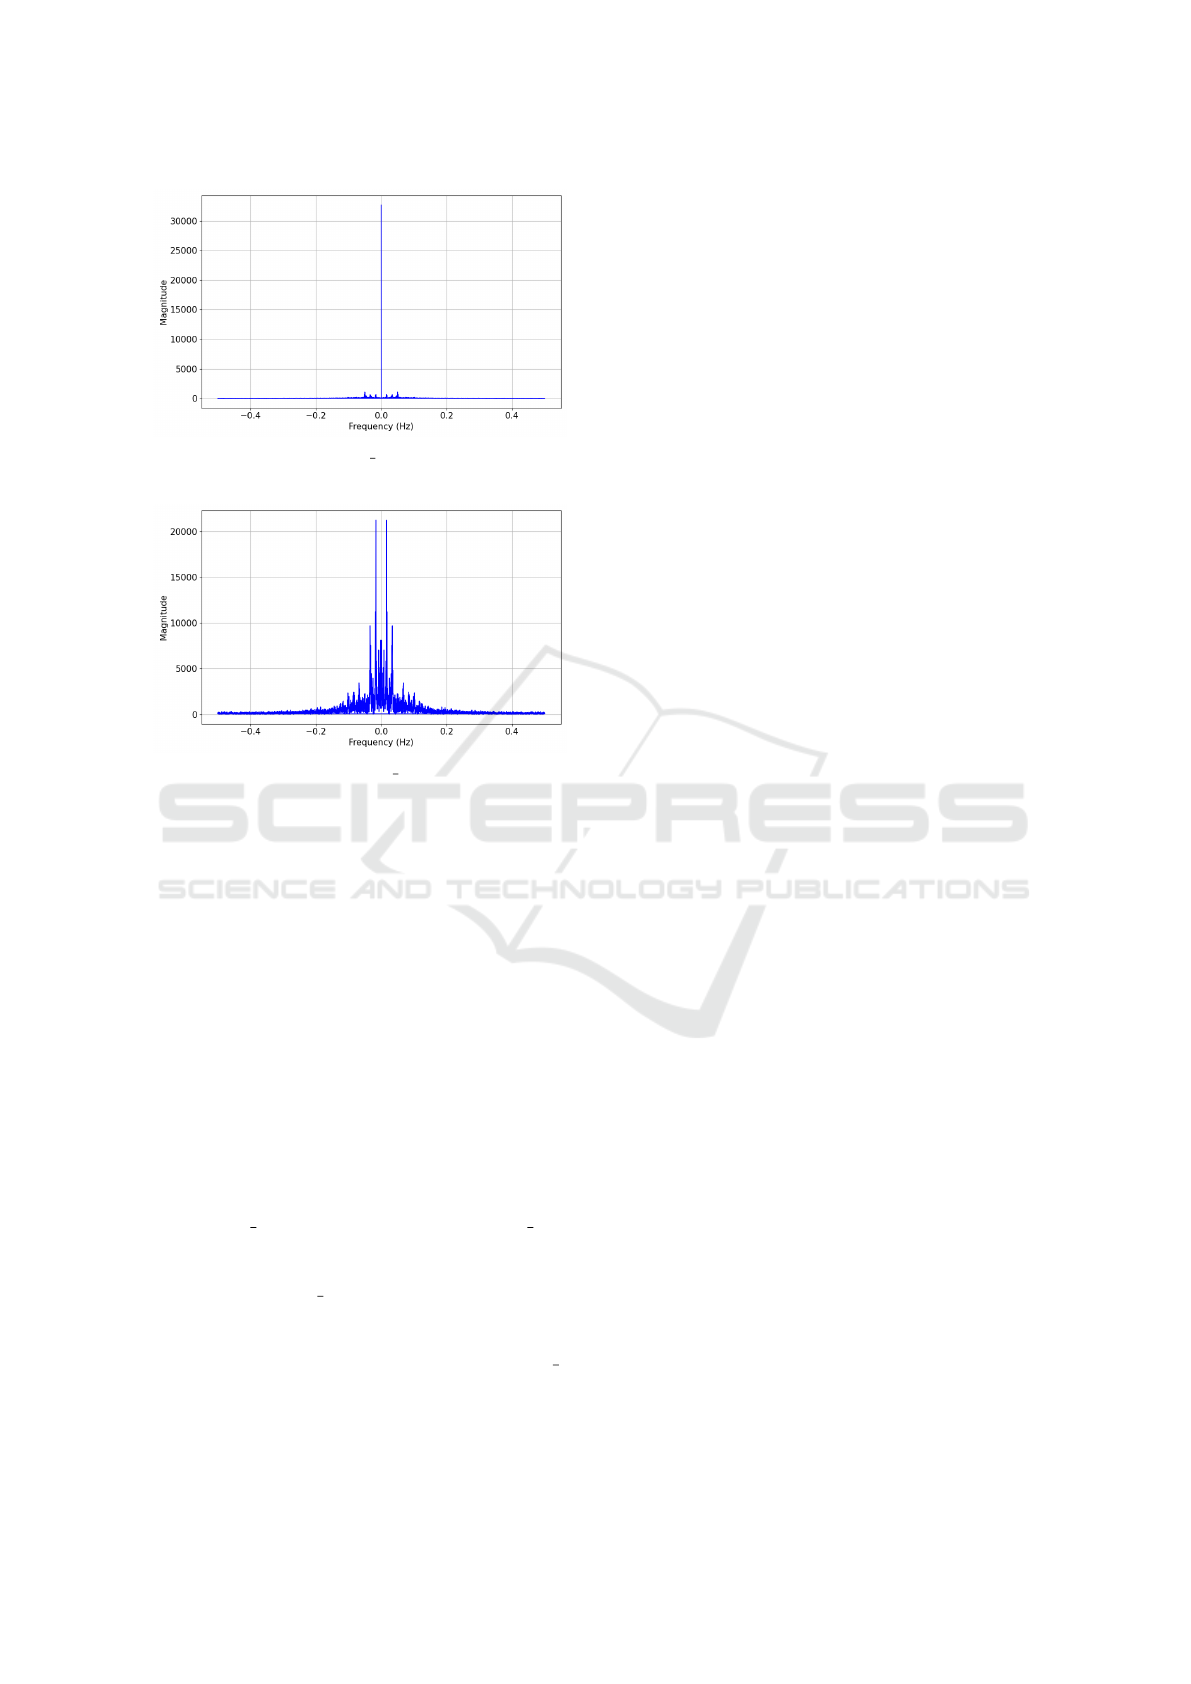
Figure 11: FFT analysis of acc x from wearable sensor and
smartphone data, showing the frequency spectrum.
Figure 12: FFT analysis of gyro y from wearable sensor
and smartphone data, showing dynamic movement across
frequencies.
5 CONCLUSION
Linear correlation provides an overview of relation-
ships between signals but lacks precision in evalu-
ating agreement. In contrast, Bland-Altman plots
and Lin’s Concordance Correlation Coefficient of-
fer a more robust assessment, essential for validating
methods in clinical and biomechanical studies. Error
metrics like RMSE and MAE quantify discrepancies,
while FFT confirms whether devices capture critical
motion frequencies similarly.
Our findings demonstrate that smartphones with
inertial sensors are highly promising for gait anal-
ysis. They showed strong correlations with the
G-Walk system for variables like absolute accel-
eration (acc abs) and gyroscope data (gyro abs).
Bland-Altman analysis revealed satisfactory agree-
ment overall, though notable discrepancies in the gy-
roscope Y-axis (gyro y) highlight limitations in cap-
turing specific rotational movements. Error metrics
confirmed these results, with minimal errors in abso-
lute acceleration and larger discrepancies in gyro y.
FFT analysis validated the smartphone’s ability to
represent essential gait cycle phases accurately.
This study establishes smartphones as accessible
alternatives for gait analysis, though improving Y-
axis gyroscope accuracy is critical for complete in-
terchangeability. Future work should focus on devel-
oping algorithms to analyze accelerometer and gyro-
scope data, identify gait phases, and generate detailed
reports for healthcare professionals.
REFERENCES
Arshad, M., Jamsrandorj, A., Kim, J., and Mun, K.-R.
(2022). Gait events prediction using hybrid cnn-rnn-
based deep learning models through a single waist-
worn wearable sensor. Sensors, 22(21):8226.
BTS Bioengineering (2024). G-walk: Wearable inertial sen-
sor for motion analysis.
Caro-Alvaro, S., Garcia-Lopez, E., et al. (2024). Gesture-
based interactions: Integrating accelerometer and gy-
roscope sensors in the use of mobile apps. Sensors,
24(3):1004.
Das, S., Meher, S., and Sahoo, U. K. (2022). A uni-
fied local–global feature extraction network for hu-
man gait recognition using smartphone sensors. Sen-
sors, 22(11):3968.
Hausdorff, J. and Alexander, N. (2005). Gait disorders eval-
uation and management. CRC Press.
Huang, H., Zhou, P., Li, Y., and Sun, F. (2021). A
lightweight attention-based cnn model for efficient
gait recognition with wearable imu sensors. Sensors,
21(8):2866.
Kim, Y., Bang, H., et al. (2018). Introduction to kalman
filter and its applications. Introduction and Implemen-
tations of the Kalman Filter, 1:1–16.
Kocuvan, P., Hrasti
ˇ
c, A., Kareska, A., and Gams, M.
(2023). Predicting a fall based on gait anomaly de-
tection: a comparative study of wrist-worn three-axis
and mobile phone-based accelerometer sensors. Sen-
sors, 23(19):8294.
Lopez-Nava, I. H., Valent
´
ın-Coronado, L. M., Garcia-
Constantino, M., and Favela, J. (2020). Gait ac-
tivity classification on unbalanced data from inertial
sensors using shallow and deep learning. Sensors,
20(17):4756.
Marimon, X., Mengual, I., et al. (2024). Kinematic analysis
of human gait in healthy young adults using imu sen-
sors: exploring relevant machine learning features for
clinical applications. Bioengineering, 11(2):105.
Ramli, A., Liu, X., , et al. (2024). Gait characterization in
duchenne muscular dystrophy (dmd) using a single-
sensor accelerometer: classical machine learning and
deep learning approaches. Sensors, 24(4):1123.
Shi, L.-F., Liu, Z.-Y., Zhou, K.-J., Shi, Y., and Jing, X.
(2023). Novel deep learning network for gait recog-
nition using multimodal inertial sensors. Sensors,
23(2):849.
Staacks, S., H
¨
utz, S., Heinke, H., and Stampfer, C. (2018).
Advanced tools for smartphone-based experiments:
phyphox. Physics education, 53(4):045009.
STMicroelectronics (2024). Lsm6dso. Acessado em: 20 de
outubro de 2024.
HEALTHINF 2025 - 18th International Conference on Health Informatics
602
