
Coconut Palm Tree Counting on Drone Images with Deep Object
Detection and Synthetic Training Data
Tobias Rohe
1 a
, Barbara B
¨
ohm
1
, Michael K
¨
olle
1 b
, Jonas Stein
1,2 c
, Robert M
¨
uller
1
and Claudia Linnhoff-Popien
1 d
1
Mobile and Distributed Systems Group, LMU Munich, Germany
2
Aqarios GmbH, Germany
fi
Keywords:
Object Detection, Synthetic Training Data, YOLOv7.
Abstract:
Drones have revolutionized various domains, including agriculture. Recent advances in deep learning have
propelled among other things object detection in computer vision. This study utilized YOLO, a real-time ob-
ject detector, to identify and count coconut palm trees in Ghanaian farm drone footage. The farm presented
has lost track of its trees due to different planting phases. While manual counting would be very tedious
and error-prone, accurately determining the number of trees is crucial for efficient planning and management
of agricultural processes, especially for optimizing yields and predicting production. We assessed YOLO
for palm detection within a semi-automated framework, evaluated accuracy augmentations, and pondered its
potential for farmers. Data was captured in September 2022 via drones. To optimize YOLO with scarce
data, synthetic images were created for model training and validation. The YOLOv7 model, pretrained on
the COCO dataset (excluding coconut palms), was adapted using tailored data. Trees from footage were
repositioned on synthetic images, with testing on distinct authentic images. In our experiments, we adjusted
hyperparameters, improving YOLO’s mean average precision (mAP). We also tested various altitudes to de-
termine the best drone height. From an initial mAP@.5 of 0.65, we achieved 0.88, highlighting the value of
synthetic images in agricultural scenarios.
1 INTRODUCTION
Coconut farming, pivotal to West African economies,
offers both a sustainable livelihood and essential con-
tributions to regional food systems. However, chal-
lenges in monitoring the growth and count of co-
conut palm trees, increased by varied planting phases
and environmental conditions, pose significant opera-
tional hindrances for larger farms. This paper presents
an innovative approach to address these challenges by
leveraging deep learning to detect and count coconut
palm trees using drone imagery, specifically focusing
on a farming project in the eastern region of Ghana.
Initiated in August 2021, the farming project
aimed to cultivate approximately 2,500 coconut palm
trees alongside other crops. The overarching goal was
not only to foster a sustainable family-run coconut
a
https://orcid.org/0009-0003-3283-0586
b
https://orcid.org/0000-0002-8472-9944
c
https://orcid.org/0000-0001-5727-9151
d
https://orcid.org/0000-0001-6284-9286
farming business but also to bolster employment op-
portunities and social benefits for local communi-
ties, thereby intertwining traditional farming practices
with modern techniques. However, as the farm ex-
panded, maintaining an accurate count of the trees
became a daunting task, with manual surveys proving
both time-consuming and error-prone.
Addressing this, we explored the application of
computer vision, a subfield of computer science fo-
cusing on replicating human vision system capa-
bilities, to detect and enumerate the coconut palm
trees. While classical object detection methods re-
lied on handcrafted features, recent advancements in
machine learning and deep learning have revolution-
ized this space, with techniques such as YOLO (You
Only Look Once) offering enhanced accuracy and ef-
ficiency.
This study delves into the application of the
YOLOv7 framework, released in 2022, to our spe-
cific use case. Beyond mere counting, future appli-
cations of this methodology might extend to discern-
ing the health of plants, thereby offering comprehen-
662
Rohe, T., Böhm, B., Kölle, M., Stein, J., Müller, R. and Linnhoff-Popien, C.
Coconut Palm Tree Counting on Drone Images with Deep Object Detection and Synthetic Training Data.
DOI: 10.5220/0013172900003890
In Proceedings of the 17th International Conference on Agents and Artificial Intelligence (ICAART 2025) - Volume 3, pages 662-669
ISBN: 978-989-758-737-5; ISSN: 2184-433X
Copyright © 2025 by Paper published under CC license (CC BY-NC-ND 4.0)

sive farm management solutions. By focusing on a
real-world problem, this work aims to bridge the gap
between advanced technical solutions and practical
agricultural challenges, setting the stage for more in-
tegrative, technology-driven farming practices in the
future. In summary, our contributions are:
1. We introduce a novel real world application: Fine-
tuning a deep object detector to count coconut
palm trees.
2. We show that performance can substantially be
increased by not only considering coconut palm
trees during training but also other plants. This
allows the object detector to better differentiate
between the plants it sees.
3. We show that it suffices to train on synthetically
generated images and thereby eliminate the need
to manually label the images.
2 BACKGROUND
This section delves into the foundational concepts and
the current state of object detection. We start with
Convolutional neural networks. Subsequently, our fo-
cus shifts to object detection, a critical component to
address our use case. In this context, we enumer-
ate the four scenarios encountered during object de-
tection, especially when positioning bounding boxes.
We also elucidate the concept of Intersection-Over-
Union. Building on this, we discuss key performance
metrics in object detection, namely precision, recall,
and mean average precision. Concluding this section,
we present the YOLO architecture, emphasizing the
advancements in YOLOv7—a state-of-the-art object
detector. The experiments we discuss in Section 4
predominantly leverage this technology.
2.1 Convolutional Neural Networks
Convolutional Neural Networks (CNNs) have
emerged as a pivotal technology in the domain of
computer vision. Originating from the larger family
of Deep Neural Networks (DNNs), CNNs are specif-
ically tailored for image data, making them adept at
tasks such as face recognition, image classification,
and object detection.
A standard CNN architecture comprises several
layers. The inaugural layer, the convolutional layer,
is pivotal for feature extraction. By utilizing filter ma-
trices, or kernels, this layer captures intricate patterns
such as colours and edges from an image. The unique
property of these filters is their translational invari-
ance, allowing objects to be recognized irrespective
of their spatial positioning in an image.
Following the convolutional layer is the pooling
layer, designed for dimensionality reduction. This di-
mension reduction not only decreases the computa-
tional burden but also helps in extracting dominant
features. Two common pooling methods exist: max
pooling and average pooling, which respectively cap-
ture the maximum and average values from a desig-
nated window in the input.
In the deeper sections of the network, fully-
connected layers serve the crucial role of integrating
features from previous layers and mapping them to
the desired output. These layers essentially form the
decision-making component of the CNN.
Training a CNN involves defining its architec-
ture and then optimising it over several iterations,
known as epochs. Throughout this training phase,
the model’s internal parameters get refined to enhance
prediction accuracy. This training is supervised, re-
quiring labelled datasets to guide the iterative minimi-
sation of prediction errors. Within the realm of CNNs,
renowned architectures include AlexNet, GoogLeNet,
and VGGNet.
Critical challenges in training CNNs encompass
phenomena like underfitting and overfitting. Address-
ing these challenges, often by tuning hyperparame-
ters, ensures that the trained model is both robust and
accurate in its predictions (Sevarac, 2021).
2.2 Object Detection
Computer vision, pivotal in numerous applications,
encompasses tasks such as image classification, seg-
mentation, and object detection. Object detection
marries object recognition — identifying and clas-
sifying objects within media — with object local-
ization, which encapsulates these identified objects
within bounding boxes (Khandelwal, 2020). A key
metric here is the Intersection-over-Union (IoU),
which quantifies the overlap between the predicted
bounding box and the ground truth — the actual an-
notated bounding box. It calculates the ratio of their
intersection to their union. IoU values range between
0 and 1: values close to 0 imply minimal overlap and
those nearing 1 signify accurate predictions (Anwer,
2022).
2.3 YOLO: You Only Look Once
This section delves into modern object detectors, fo-
cusing on YOLO (You Only Look Once). The field
of object detection began with Region-based Convo-
lutional Network (R-CNN) in 2014. It proposed re-
Coconut Palm Tree Counting on Drone Images with Deep Object Detection and Synthetic Training Data
663

gions and fed them into a classifier, a methodology
advanced by its successors: Fast R-CNN, Faster R-
CNN, and Mask R-CNN. These methods identified
potential regions of interest and subsequently classi-
fied them for detection (Szeliski, 2022).
YOLO, introduced in 2016, diverges from this
two-step approach. It performs real-time object de-
tection by predicting bounding boxes and class prob-
abilities directly from images in a single evaluation,
enhancing speed and requiring fewer resources (Red-
mon et al., 2016). The model encompasses 24 convo-
lutional layers followed by 2 fully connected layers,
leveraging a rectified linear activation function in all
but the final layer (Redmon et al., 2016). YOLO’s ar-
chitecture breaks the input image into an S × S grid,
making predictions encoded as an S × S × (B ∗ 5 +C)
tensor (Redmon et al., 2016).
Our experiments in section 4 employ YOLOv7,
released in 2022. This variant, pretrained on the MS
Coco Dataset with 80 object categories, lacks a cat-
egory for coconut palm trees, necessitating custom
data for our use case: counting coconut palm trees
in drone images. YOLOv7 boasts innovations like
the extended efficient layer aggregation network (E-
ELAN) and a trainable bag of freebies, enhancing
speed and accuracy without elevating costs (Kukil and
Rath, 2022). The architecture, with around 37 mil-
lion parameters, features a backbone established in
the first 50 layers.
3 METHOD
In this section our concept and the derived workflow
is described. Both are geared towards answering the
overarching question of the use case. The concept and
workflow was chosen as follows and reflects the typi-
cal phases of a deep learning project.
3.1 Data Acquisition
In September 2022, aerial drone images were cap-
tured in Ghana at heights of 10m, 25m, 45m, 70m,
and 85m. These 73 images, captured using a DJI
Mini 2 drone camera, have a resolution of 4000x2250
pixels. Given the common data scarcity challenge in
deep learning and the guideline suggesting roughly
5000 labeled examples per category for adequate per-
formance (Goodfellow I., 2016), we generated addi-
tional data synthetically. We based this on 13 se-
lected drone images, keeping the remaining images
for model testing.
3.2 Data Preparation and Generation
Data preparation follows a cross-validation approach,
partitioning the data into training, validation, and test
sets (Prince, 2023). Due to data limitations, we gener-
ated synthetic images to train YOLOv7. Using GIMP,
specific plants were extracted from the raw images,
while Dall-E produced the backgrounds (BG). A cus-
tom Python generator then assembled these compo-
nents into synthetic images by:
• Randomly selecting BGs and plants
• Applying random plant rotation, size, and flip
• Positioning plants on the BG without overlaps
• Adjusting the plant count per BG based on con-
figuration
This generator also produces YOLO-formatted la-
bel files, essential for training and validation. We up-
loaded the synthetic and test images to Google Drive,
organizing them into specific directories for compati-
bility with YOLOv7.
3.3 Metric
The precision-recall curve graphically illustrates the
trade-off between the two metrics for different con-
fidence thresholds. As a reminder these metrics are
utilised to evaluate the performance of deep learning
models. The curve is typically depicted in a coor-
dinate system where the x-axis is the recall and the
y-axis is the precision and both values are always be-
tween 0 and 1. The graph shows how both metrics
change as the threshold is adjusted. A higher curve
generally points out better model performance. Ad-
ditionally, the area underneath the curve is known as
the average precision (AP) (Glassner, 2021).
AP is an essential performance indicator for one
object class, whereas the mean average precision
(mAP) is used when detecting multiple object cate-
gories in an image. It is calculated by the sub metrics
confusion matrix, IoU, recall and precision. “For each
class k, we calculate the mAP across different IoU
thresholds, and the final metric mAP across test data
is calculated by taking an average of all mAP values
per class.” (Shah, 2022). Higher values show better
performance in object detection tasks. The mAP is
defined as:
mAP =
1
n
k=n
∑
k=1
AP
k
where AP
k
denotes the average precision of class k
and n is the number of classes. In subsequent sections
we use mAP@.5 to compare the outcome of the ex-
periments, which means a single IoU-threshold of 0.5
ICAART 2025 - 17th International Conference on Agents and Artificial Intelligence
664

was applied. The mAP@.5 value seemed appropriate
for the use case, since counting is more essential than
precise localisation.
3.4 Training, Validation and Test
Model training, validation, and testing occurred on
Google Colab. We installed YOLOv7 and its depen-
dencies on the Colab virtual machine and utilized pre-
trained COCO dataset weights. After adjusting the
necessary configuration files, the model underwent
training and subsequent testing for mAP results. Ten-
sorBoard helped in monitoring the training process.
4 RESULTS
This study conducted a series of experiments aiming
to enhance the mAP at an IoU threshold of 0.5 by
refining the workflow parameters. We established a
baseline using coconut palm trees as the primary ob-
ject class.
4.1 Baseline
Establishing a baseline is pivotal for contextualiz-
ing model performance and offering a point of refer-
ence for subsequent experiments(Nair, 2022). Given
Ghana’s reddish laterite soil, DALL-E simulated
these background colors. Focusing on the objective
of counting coconut palm trees, we initially consid-
ered this as the sole object class. We generated 300
synthetic images for training, featuring between 15 to
25 trees each, totaling approximately 6000 trees. Af-
ter 40 epochs of training using pre-trained YOLOv7
weights, we achieved a mAP@.5 value of 0.65, de-
tailed in the subsequent section.
4.2 Varying Background Colors
Healthy coconut trees possess vibrant green leaves
with patches of brown, with color variations influ-
enced by health, age, and environment. Notably, West
Africa’s laterite soil presents a reddish hue, while sur-
rounding vegetation remains chiefly green.
To ascertain the optimal background texture or
dominant color yielding the highest results with
trained YOLO models, backgrounds for training and
validation were crafted using stable diffusion, utiliz-
ing DALL-E, an AI that translates natural language
descriptions into images. As illustrated in Table 1, the
prompts were: dense green vegetation, red soil (offer-
ing enhanced contrast with the trees), and a combina-
tion of the two.
Each experiment iteration followed a similar pro-
cedure. The column ”Size of BG pool” specifies the
backgrounds available for test (T) and validation (V)
datasets. Palm trees, rotated and placed at random,
ranged between 15 to 25 per image. Models were
trained over 40 epochs with a batch size of 16.
To account for result variability, models were
thrice tested on data taken 25 meters above ground.
Tests utilized the optimal model from prior training
in terms of mAP on the validation set (Skelton, 2022)
with an object confidence threshold set at 0.6.
Figure 1’s bar plot delineates the mAP@0.5 val-
ues, revealing that the green background, akin to ac-
tual drone imagery grounds, outperformed others and
thus was selected for subsequent experiments.
The detect command results for the green back-
ground indicate fewer false positives/negatives than
its counterparts. Raising the confidence threshold to
0.71 further refined results. A potential inference
from Figure 1 is that the model’s capacity to discern
palm trees improves substantially when the stark con-
trast of green trees against a red backdrop isn’t the
dominant visual cue, but rather the model has to learn
other features for detection.
Figure 1: mAP@.5 values for different BG.
4.3 Multiple Object Classes
While the initial approach focused solely on identify-
ing coconut palm trees, certain plants like okra and
weeds were mistakenly identified as coconut palm
trees. This experiment aimed to determine if incorpo-
rating these misidentified objects as separate classes
would enhance the mAP@0.5 accuracy for the pri-
mary object – the coconut palm trees. Table 2 lists the
variants.
Okra, a staple in Ghanaian cuisine, can grow up
to 2 metres tall and has a notable presence in Ghana,
ranking it among the top ten global okra producers.
Its distinct shape, as well as that of tree trunks, eases
the generation of training data. However, tree trunks
Coconut Palm Tree Counting on Drone Images with Deep Object Detection and Synthetic Training Data
665
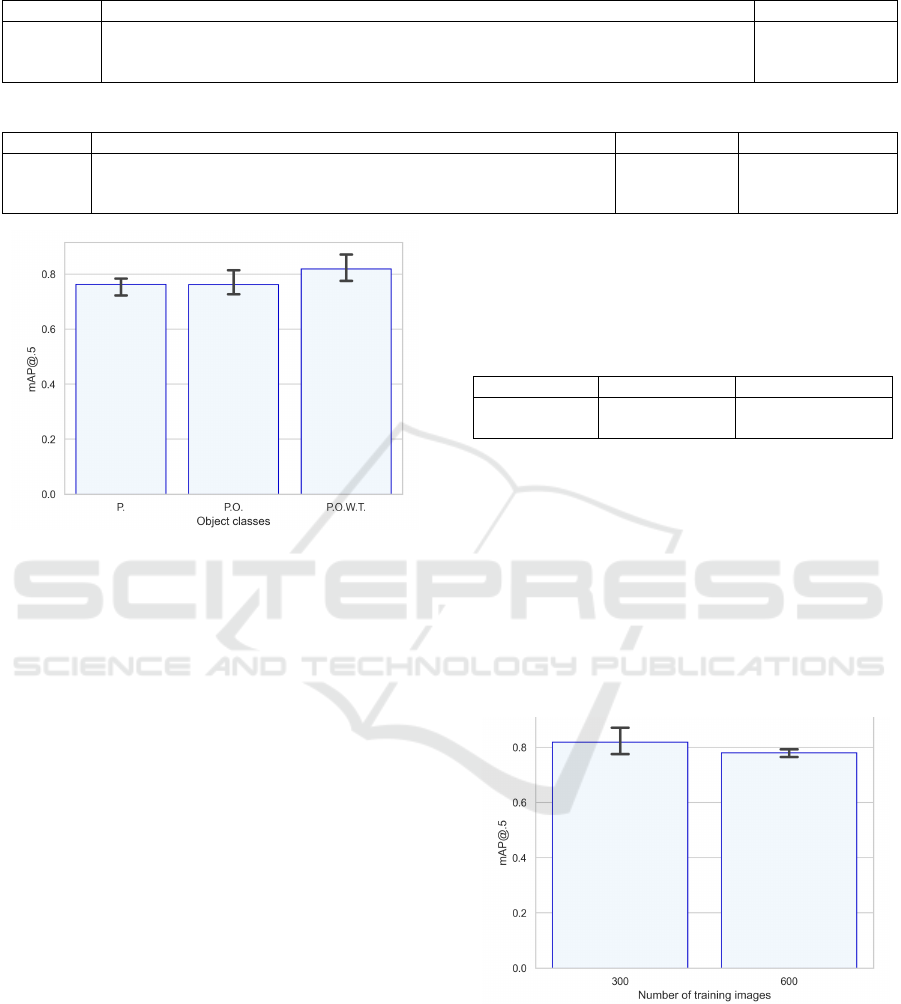
Table 1: Prompts to create background with DALL-E.
BG Color Prompt Size of BG Pool
green ”vertical aerial drone picture of ghana farm grass” T:35 V:21
red ”vertical aerial drone pictures of ghana soil” T:35 V:21
mixed equal composition of a and b T:35 V:21
Table 2: Set of object classes.
Abbr. Obj. Classes Cut out obj. Labelled (25m)
P. palm trees 44 187
P.O. palm trees, okra plants 44, 30 187, 2471
P.O.W.T. palm trees, okra plants, weeds, tree trunks 44, 30, 17, 24 187, 2471, 62, 193
Figure 2: Test results with one, two and four classes.
and patches of grass, which had prior misidentified,
were isolated and labelled. This necessitated extend-
ing the Python generator to accommodate multiple
object classes, as reflected in Table 2 with an aggre-
gate of 2, 911 plants.
Maintaining the green background, the workflow
remained consistent across trials. Results in Figure 2
suggest the four-class model offers superior mAP@.5
values. Furthermore, it demonstrates effective okra
recognition alongside the primary palm tree identifi-
cation, achieving up to 85% accuracy for palm trees.
This highlights a potential strategy: reducing false
identifications in the primary object class by training
the model on frequently misidentified objects. How-
ever, this demands extensive manual labeling, as seen
with nearly 2, 000 okra plants in this case.
Subsequent experiments will utilize the green
background and four object classes, given their
demonstrated superiority in mAP@.5 outcomes.
4.4 Effect of Increasing Training
Images on Accuracy
This study investigates the potential correlation be-
tween increasing training images and the mAP@0.5
metric. The experiments conducted previously con-
sistently used 300 training and 120 validation images.
The most promising mAP@0.5 values emerged us-
ing the green BG and four object classes, which then
served as our consistent benchmark, as detailed in Ta-
ble 3.
Table 3: Number of training and validation images.
Training img Validation img ∅ Number palms
300 120 T:6000 V:2400
600 240 T:12000 V:4800
Notably, doubling the training images to 600 led
to a drop in mAP@0.5 values, not surpassing the 0.8
benchmark. This may suggest that using more images
from the same source pool can lead to model overfit-
ting, thus impairing its ability to generalize for unseen
data. This is further evidenced by the rise in false pos-
itives across all classes.
Furthermore, enlarging the training dataset corre-
spondingly extends the experiment duration, notably
during the upload to Google Drive and subsequent
Colab training.
Figure 3: Increased number of training images with 4
classes and green BG.
4.5 Influence of Drone Altitude on Test
Image Quality
Until now, training and validation data primarily came
from drone shots taken at approximately 10m and
25m above the ground. The test data was predomi-
ICAART 2025 - 17th International Conference on Agents and Artificial Intelligence
666
nantly captured at 25m. With the most consistent re-
sults using the green BG, four object classes, and 300
training images, this configuration became the base-
line for this study.
With the goal of counting all coconut trees using a
trained model, efficient drone photography becomes
pivotal. A central question is determining the opti-
mal drone altitude to capture the maximum number
of trees without compromising image quality. While
greater altitude captures more trees in one shot, the
trees occupy fewer pixels, as detailed in Table 4.
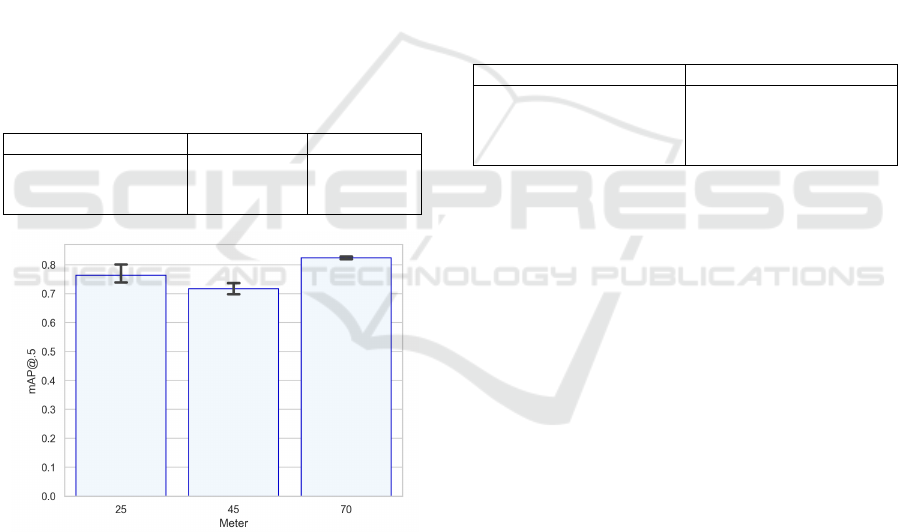
Results, visualized in Figure 4, indicate that 70m
above ground provides the most promising test data.
However, due to the scarcity of high-altitude footage,
this conclusion serves only as an initial indicator.
While 70m seems to be the optimal altitude, this con-
clusion, based on only three test images with 66 co-
conut trees, requires further validation. Furthermore,
strategies must be developed to ensure comprehen-
sive land coverage with drone shots, avoiding gaps
or overlaps. Subsequent experiments will continue to
rely on the 25m data.
Table 4: Number of test images and palms in total.
Height of test images Image count Total palms
25m 38 187
45m 12 126
70m 3 66
Figure 4: Height of test images.
4.6 Number of Palm Trees on Training
Images
We investigated the impact of varying the number of
palm trees placed on backgrounds during training and
validation data generation. Prior experiments em-
ployed a random placement of 15 to 25 palm trees
per image. Table 5 enumerates the chosen ranges,
with results visualized in Figure 5a. It’s notable that
our model incorporated a green BG, identified the co-
conut palm tree as its single object class, and was
trained using 300 synthetic images.
A range of 5 to 15 palm trees yielded the highest
mAP@.5 scores. Given the average palm tree count
of 13 in the test drone footage, the model possibly
aligned better with test images having 2 to 14 palms.
This suggests that training and validation data with
similar palm tree ranges potentially improves model
assumptions on test data. On the contrary, the 15
to 25 range resulted in the lowest mAP@.5, possibly
due to the absence of this tree range in test images,
suggesting the model’s assumptions based on training
data might misalign. The 25 to 50 range saw mAP.5
improvements, likely reflecting the tree counts in test
data.
This theory warrants further exploration to better
understand model internalizations and their effects. A
subsequent experiment delves deeper into this.
Table 5: Number of palm trees in training and validation
images.
Palms per image ∅ Number of palms
5 to 15 3000
15 to 25 6000
25 to 50 11250
5 to 60 9750
4.7 Different Palm Count for Training
and Validation
Up to now the number range of palms in training and
validation data was equal. In the previous experiment
a theory was set up that there might be some internal-
isation in the model that the number of palm trees in
validation and test are similar to those in training. In
this section the range used for training and validation
data differs. Figure 5b depicts 3 variants, the first two
variants with different ranges and the last variant with
same ranges for comparison. This is summarized in
table 6. The experiment explores if there is an im-
provement in the mAP.5 values by having different
training and validation ranges utilised for the training
of the model. It was trained with a green BG, one
object class (coconut palm trees) and 300 synthetic
images.
The first variant shows slightly higher mAP@.5
values, which makes it one of the best results so far.
The second variant depicts lower mAP@.5 values.
The third variant show the result of the previous sec-
tion.
One possible explanation for the first variant could
be that by training the model with different training
and validation ranges, it can handle the variety of
palm trees in each test image better. That means the
Coconut Palm Tree Counting on Drone Images with Deep Object Detection and Synthetic Training Data
667

(a) Number of palm trees (b) Range of palm trees
Figure 5: Numbers and range of palm trees in training and validation.
detection and classification of palm trees are more ac-
curate. Another reason could be that the total number
of palms and their split in training and validation is
more important than the values per image.
Table 6: Number of palm trees in training and validation
images.
Palms per image ∅ Palms (train) ∅ Palms (val)
t:5-15 v:15-25 3000 2400
t:15-25 v:5-15 6000 1200
t:5-15 v:5-15 3000 1200
4.8 Freezing Layers
Yolov7, as detailed in section 2.4, boasts various lay-
ers with its initial weights trained on the Coco dataset.
When we freeze a layer, we prevent its weights from
updating during training. Typically, the architecture’s
initial layers capture basic features like edges. The
backbone of YOLOv7 encompasses 50 layers. In
this experiment, we adjusted the freeze hyperparam-
eter for fine-tuning. Figure 6 presents outcomes when
fixing the first 5 and 11 layers. We trained using a
green BG, four object classes, and 300 images over 5
repetitions. The mAP@.5 values remained consistent
across both frozen and non-frozen variants, suggest-
ing that the freeze hyperparameter might not provide
added benefits. Detection results revealed a high true
positive rate: of the 187 palm trees labeled in ground
truth, 199 were detected with minimal false positives.
4.9 Agricultural Implications
Through the conducted experiments, we successfully
elevated mAP@0.5 from an initial 0.65 to an average
of 0.88. For agricultural planning, such as procur-
ing fertilizers and protective nets, this accuracy proves
sufficient. Table 7 consolidates the baseline and op-
timal variants from each experiment. Notably, in the
Figure 6: Freezing initial layers from 0-4 and 0-10.
final freeze experiment, out of 187 labeled palm trees
in the ground truth, 199 were accurately detected with
minimal false positives. While all experiments in-
clude interpretations, further testing is essential for
validation, given the inherent variability in mAP.5 re-
sults even under consistent parameters. Enhancing
model transparency and clarity can also benefit from
advances in explainable AI.
5 CONCLUSION
This research tackled the challenge of counting co-
conut palm trees in drone imagery using deep learn-
ing. Among various real-time object detectors,
YOLOv7 from the YOLO family emerged as the pre-
ferred choice. Given the limited availability of drone
footage, we generated synthetic images to train and
validate our model, which is also an important method
for this science. As a result, we witnessed a signifi-
cant enhancement in the mAP@.5 value, elevating it
from 0.65 to 0.88. We varied input parameters and
fine-tuned hyperparameters, finding that the genera-
ICAART 2025 - 17th International Conference on Agents and Artificial Intelligence
668

Table 7: Comparison of best variants of selected experiments.
BG Classes Train Img Palms per Img Freeze Min mAP Max mAP
Red Palms 300 15-25 none 0.63 0.69
Green Palms 300 15-25 none 0.73 0.80
Green Palms 300 T:5-15 V:15-25 none 0.79 0.84
Green Palms 300 5-15 none. 0.69 0.86
Green P.O.W.T. 300 15-25 none 0.77 0.87
Green P.O.W.T. 300 5-15 0-10 0.75 0.88
tion of synthetic images, particularly with stable dif-
fusion backgrounds, was beneficial. Our best model
detected 199 palm trees out of 187 labelled in the test
data, with minimal false positives.
For comprehensive results, systematic drone cap-
ture of land remains essential. Additional fine-tuning
and experiments can further optimize the model.
Transitioning this methodology into a scalable prod-
uct holds potential for aiding nearby farms in yield
estimation and strategic planning. Future research
could also focus on assessing the health of coconut
palms. By integrating traditional farming with ad-
vanced techniques, we aimed to transform manual
surveys into a semi-automated, cloud-based solution.
This approach is not only cost-effective but also re-
duces time, labor, and errors. Bridging agriculture
with technology, especially through drones and deep
learning, unveils a horizon of promising opportuni-
ties.
ACKNOWLEDGEMENTS
This paper was partially funded by the German Fed-
eral Ministry of Education and Research through the
funding program ”quantum technologies - from basic
research to market” (contract number: 13N16196).
Furthermore, this paper was also partially funded
by the German Federal Ministry for Economic Af-
fairs and Climate Action through the funding program
”Quantum Computing – Applications for the indus-
try” (contract number: 01MQ22008A).
REFERENCES
Anwer, A. (2022). What is average precision in object de-
tection and localization algorithms and how to calcu-
late it?
Glassner, A. (2021). Deep Learning: A Visual Approach.
No Starch Press, San Francisco, California, 1st edi-
tion.
Goodfellow I., Bengio Y., C. A. (2016). Deep Learn-
ing (Adaptive Computation and Machine Learning se-
ries). The MIT Press, Cambridge, Massachusetts, 1st
edition.
Khandelwal, R. (2020). Tensorflow object detection api.
Kukil and Rath, S. (2022). Yolov7 object detection paper
explanation and inference.
Nair, A. (2022). Baseline models: Your guide for model
building.
Prince, S. J. (2023). Understanding Deep Learning. MIT
Press, Cambridge, Massachusetts.
Redmon, J., Divvala, S., Girshick, R., and Farhadi, A.
(2016). You only look once: Unified, real-time object
detection. In Proceedings of the IEEE conference on
computer vision and pattern recognition, pages 779–
788.
Sevarac, Z. (2021). How to get started with deep learning
in java.
Shah, D. (2022). Mean average precision (map) explained:
Everything you need to know.
Skelton, J. (2022). Step-by-step instructions for training
yolov7 on a custom dataset.
Szeliski, R. (2022). Computer Vision: Algorithms and Ap-
plications. Springer, Cham, Switzerland, 2nd edition.
Coconut Palm Tree Counting on Drone Images with Deep Object Detection and Synthetic Training Data
669
