
Enhanced Graph Representations of Chromatin Interaction Networks
Edgars Celms
a
, Lelde Lace
b
, Gatis Melkus
c
, Peteris Rucevskis
d
, Sandra Silina
e
,
Andrejs Sizovs
f
and Juris Viksna
g
Institute of Mathematics and Computer Science, University of Latvia, Raina Bulvaris 29, Riga, Latvia
{edgars.celms, lelde.lace, gatis.melkus, peteris.rucevskis, sandra.silina, andrejs.sizovs, juris.viksna}@lumii.lv
Keywords:
Chromatin Interaction Networks, Graph Representations, Network Topology, Graph Patterns.
Abstract:
We present a novel extension of graph representations of chromatin interaction networks incorporating edge
directionality and vertex label assignments and focus on patterns defined by different types of 3-cliques that can
occur under such assignments. 3-cliques are chosen for their simplicity and comparative ubiquity in chromatin
interaction graphs; also, our previous work indicates a certain level of biological significance that can be
assigned to them. Here we explore statistical distributions of different types of directionality- and strand-
based 3-cliques patterns in two well-curated promoter capture Hi-C data sets and observe that the pattern
distributions strongly deviate from random, if they are considered in the context of a number of additional
features. These observations provide a good justification for further exploration of chromatin interaction data
sets using network representations that include edge directionality and node label assignments and indicate a
possibility that these annotation features could be related to some specific underlying biological mechanisms.
1 INTRODUCTION
In this work, we explore the extension of graph rep-
resentations of chromatin interaction networks with
edge directionality and vertex label assignments. The
work was motivated by our previous studies, in which
we have shown the benefits of analysing chromatin in-
teraction networks in terms of topological features of
network representations by undirected graphs (Lace
et al., 2020; Viksna et al., 2020) as well as indica-
tions of the usefulness of enriching these representa-
tions by additional vertex and edge labelling and edge
directionality. The intention is to include in graph rep-
resentations to the maximum extent the available in-
formation about DNA spatial structure, with the pos-
sibility of 3D genome reconstruction from chromoso-
mal contact maps already been (at least, in principle)
demonstrated (Morlot et al., 2016).
The significance of DNA 3D structure became
well-acknowledged in 80s as an ’unanticipated dis-
covery’ (Schleif, 1992), backed by evidence of mi-
a
https://orcid.org/0000-0001-9608-3792
b
https://orcid.org/0000-0001-7650-2355
c
https://orcid.org/0000-0002-3077-6809
d
https://orcid.org/0009-0006-6189-2008
e
https://orcid.org/0009-0000-3917-9026
f
https://orcid.org/0009-0004-6958-9965
g
https://orcid.org/0000-0003-2283-2978
croscopy and targeted wet-lab experiment data. As
significant structural features were acknowledged
loops — free segments of DNA lacking interaction
with other DNA parts. The other types of well-
defined DNA structural features, however, were dis-
covered (or proposed) only after advances in chro-
matin conformation capture techniques. The first
comprehensive analysis of chromatin interactions was
presented in (Lieberman-Aiden et al., 2009); the au-
thors introduce the notion of compartments – parti-
tion of each chromosome in 2 loci (arbitrarily named
A and B) such that contacts within each set are en-
riched and contacts between them are depleted. The
provided compartment definition is not strictly for-
malised, though, and the notion of compartments later
seems to be used by other researchers in similar, but
not necessarily exactly the same, contexts.
Already well-defined and well-recognised fea-
tures are TADs (Topologically Associated Domains),
which were initially proposed in (Dixon et al., 2012)
with more precise definition and detection techniques
developed in (Rao et al., 2014). TADs can be con-
sidered as closely interacting continuous segments of
DNA and are ’well defined’ in the sense that they cor-
respond to obvious and usually well-separated activ-
ity spots on diagonals of heatmaps of Hi-C data. In
(Rao et al., 2014), a robust procedure for automated
loop identification from heatmaps is proposed by us-
Celms, E., Lace, L., Melkus, G., Rucevskis, P., Silina, S., Sizovs, A. and Viksna, J.
Enhanced Graph Representations of Chromatin Interaction Networks.
DOI: 10.5220/0013173100003911
Paper published under CC license (CC BY-NC-ND 4.0)
In Proceedings of the 18th International Joint Conference on Biomedical Engineering Systems and Technologies (BIOSTEC 2025) - Volume 1, pages 579-585
ISBN: 978-989-758-731-3; ISSN: 2184-4305
Proceedings Copyright © 2025 by SCITEPRESS – Science and Technology Publications, Lda.
579

ing a number of clustering methods. Potential biolog-
ical mechanisms for forming TADs are well described
in (Matharu and Ahituv, 2015). In (Grubert et al.,
2020) is provided a very recent statistical analysis of
loop and TAD cell type specificity for 24 human cell
types using datasets from ENCODE portal.
Another interesting (and not too widely studied)
features of interaction data are FIREs (Frequently
Interacting Regions) introduced in (Schmitt et al.,
2016). FIREs can be considered as small sub-
segments of TADs actively interacting with other
regions within them. The authors also propose a
method for FIRE identification and show that they
have strong tissue-specificity (on the basis of 21 tissue
data). A recent review of structural features of chro-
matin interactions (that partially also acknowledges
our still limited understanding of them) was presented
in (Eagen, 2018) and discusses all four structural fea-
tures mentioned above: loops, compartments, TADs,
and FIREs. The authors also provide a computation-
ally more robust definition of compartments as clus-
ters of two or more strongly interacting TADs.
Regarding the biological role of DNA structural
features, whilst in general it is already well acknowl-
edged (Schleif, 1992), the opinion of the importance
or role of particular structural features still somewhat
varies (that partially might be explained by the use of
different experimental techniques or data processing),
albeit in general consensus that all these structures
have important biological roles seems to be reached.
A number of potential biological mechanisms for this
have also been proposed (Catarino and Stark, 2018;
Mora et al., 2016; Schoenfelder et al., 2010).
Whilst processed chromatin interaction datasets
can naturally be considered as large weighted net-
works, there have been comparatively few studies that
have treated the data explicitly as such network. Most
often, one or several different heatmap (also known as
Hi-C interaction map) representations are used, which
provide a ’general picture’ but are certainly lacking
in detail. One of the first studies that tries to anal-
yse Hi-C data as the network is (Siahpirani et al.,
2016); the authors use a number of known cluster-
ing methods (as well as propose their own) for Hi-C
data analysis; the results allow us to differentiate be-
tween four (two human, two mice) cell lines. In (Thi-
bodeau et al., 2017) ML-based network analysis was
applied to data from 3 cell lines, and the authors have
identified several tens of small subgraphs (’graphlets’
with 2-5 vertices) that were over-represented in the
interaction networks; some of these were shown to be
cell type-specific, and some were not. Also (Javierre
et al., 2016) provides examples of a few small sub-
graphs of interaction networks, together with possible
explanations of their biological role. The most ex-
plicit network-oriented approach was probably used
by (Schulz et al., 2018), where the authors present an
algorithm for finding common single linkage clusters
(called δ-teams) in a set of interaction graphs. The
method was also applied to 3 interaction networks
generated by (Dixon et al., 2012), although without
strong conclusions being drawn.
One of the difficulties in analysing networks at the
graph topology level is the very wide range of den-
sities of graphs obtained from measured interaction
data. Thus, although the feasibility of reconstruction
of DNA 3D structure from chromatin contact maps
has been demonstrated (Morlot et al., 2016) in princi-
ple, the amount of information about 3D structure that
can be extracted from experimentally obtained Hi-C
datasets is a completely different matter.
Nevertheless, there is steadily increasing interest
in graph-based chromatin structure models (Pancaldi,
2023), including proposals of some very high abstrac-
tion level representations (Dotson et al., 2022; Tan
et al., 2018). Our previous results (Lace et al., 2020;
Viksna et al., 2020) have also shown that topologi-
cal properties of chromatin interaction graphs can be
successful for differentiation between different tissue
and cell types and that certain small network substruc-
tures can be well associated with groups of genes with
similar activity modes. In the background context, we
expect that the proposed extensions could broaden the
classes of networks to which the significance of spe-
cific topological features can be applied.
2 MATERIALS AND METHODS
2.1 Topological Patterns of 3-Cliques
The use of edge directionality is particularly appropri-
ate for promoter capture Hi-C (PCHi-C) data, where
it is already implicitly defined by interactions be-
ing measured between ’baits’ (promoters) and ’other
ends’ (some of which can also be promoters). Thus,
PCHi-C data sets can inherently be viewed as directed
graphs, the challenge is to gain some understanding
whether and/or how this directionality can be associ-
ated with biologically interesting features captured by
these data sets.
In our previous work we have successfully
demonstrated biological significance of a number of
specific topological features in PCHi-C graphs (and
also Hi-C graphs in general). The most of these topo-
logical features were defined by the presence of small
subnetworks, which we refer to as ’patterns’ (’mo-
tifs’ is another commonly used term in computational
BIOINFORMATICS 2025 - 16th International Conference on Bioinformatics Models, Methods and Algorithms
580

biology for such subnetworks, although it tend to im-
ply assignment of also some biological meaning; a
particularly elaborate approach of using subnetworks
in biological network analysis has been developed in
(Yaveroglu et al., 2015; Sarajlic et al., 2016; Przulj
and Malod-Dognin, 2016) by a research team who re-
fer to such substructures as ’graphlets’).
One of the simplest types of such identified topo-
logical features were k-cliques – fully connected sub-
graphs of k vertices. k-cliques provided good discrim-
inatory power between chromatin interaction graphs
between different tissues and cell types (Lace et al.,
2020), and clique-rich regions can also be well asso-
ciated with increased transcriptional activity (Melkus
et al., 2023). Due to complexity of k-clique finding
growing exponentially with k, we have limited explo-
ration of k-cliques for values of k = 3...5. Although,
when present, 4- and 5-cliques exhibited particularly
good discriminatory power, with the analysed Hi-C
data sets defining comparatively sparse graphs their
numbers were quite limited, and the most abundant
and particularly significant turned out to be such sim-
ple topological structures as 3-cliques. The pres-
ence and biological significance of specific types of
3-cliques has also been justified by the proposed as
well as experimentally observed transitivity of CTCF-
mediated chromatin loops (Wang et al., 2021).
Due to this it also appears to be very natural to
base the initial assessment of edge directionally and
labelling on the analysis of different types of 3-cliques
that can be obtained by such assignments. We call
these clique types patterns and consider here patterns
that are defined by edge directionality (patterns A, B,
C and D) and by strand assignments to edge endpoints
(patterns X, Y and Z).
In representations of PCHi-C data, 3-clique pat-
terns are defined by the order of their vertices on chro-
mosomes and the direction of edges between them –
up to symmetries, this leads to 4 different types of pat-
terns A, B, C and D (Figure 1). The underlying data
do not imply that A, B, C and D patterns can be di-
rectly associated with different 3D conformations of
chromatin structure. However, they affect the rela-
tive locations of genes and their promoting regions on
DNA loops formed by 3-cliques. Patterns of types A,
B and C are all defined by two promoters, and one can
expect that they will occur with similar frequencies.
Type D patterns, however, are defined by three pro-
moters. Assuming that for all the edges the probabil-
ities for their ’other ends’ to happen to be also ’baits’
are completely random, the probability of pattern to
have three promoters by chance would be p = N
p
/N
e
,
with N
p
being the total number of promoters and N
e
being the total number of edge endpoints for a par-
ticular chromosome. Such assumption would lead to
the expected frequencies of patterns A, B, and C be-
ing 1/(p + 3) and the frequency of pattern D being
p/(p + 3). In practice, however, the probabilities p
are not distributed to edges completely randomly, but
depend on multiple other factors (e.g. node degree
distribution), some of which are data set specific. Due
to this it is difficult to assign meaningful exact expec-
tation frequencies of patterns, but we can assume that
the types A, B and C should be equally frequent, and
the type D is expected to occur less frequently.
Another natural way to partition 3-cliques into
subtypes is by defining patterns according to the
strand specificity of interacting regions associated
with endpoints of edges. Strand-specificity of inter-
acting regions likely could be of relevance for vari-
ous types of chromosome conformation capture tech-
niques, not only PCHi-C, provided that such infor-
mation can be extracted from measurement data. As-
suming that the endpoint regions of an observed chro-
matin interaction can be reliably assigned to specific
chromosome strands, we, up to symmetries, obtain
three types of patterns: X, Y and Z (Figure 1). In
this case, different patterns can already be directly
related to different folding of DNA in 3D space, al-
though the significance of this might start to manifest
only for short-range interactions. Clique node allo-
cation to strands is characterised by node sequence
a → b → c, with a, b, c denoting one of the two strands
A and B, which provides 8 possible allocations. Two
of these correspond to type X patterns (A → A → A
and B → B → B), two correspond to type Y patterns
(A → B → A and B → A → B), and four to type Z
patterns (A → A → B, A → B → B, B → B → A and
B → A → A). Thus, with 3-clique vertices being ran-
domly located on strands, patterns of types X and Y
are expected to occur with the probabilities 1/4 each
and pattern of type Z with the probability 1/2.
Figure 1: Four types of patterns of 3-cliques of chromatin
interactions defined by edge directionality: A, B, C and D
(left); and three types of 3-clique patterns defined by gene
locations on strands: X, Y and Z (right).
Enhanced Graph Representations of Chromatin Interaction Networks
581

2.2 Data Sets Used
We have analysed statistical properties of distribu-
tions of these edge directionality and strand location
patterns for two datasets of promoter capture Hi-C
(PCHi-C) data.
One of the best-suited datasets available for such a
purpose is the data set of long-range interactions be-
tween promoters and other regulatory elements that
were generated by The Babraham Institute and Uni-
versity of Cambridge (Javierre et al., 2016). This
data set is still largely unique because it contains
genome-wide data covering a representative subset
of the entire haematopoietic lineage collected using
a unified protocol. The data was obtained by pro-
moter capture Hi-C (PCHi-C) in 17 human primary
haematopoietic cell types, and from 31253 identified
promoter interaction regions across all chromosomes,
a subset of high-confidence PCHi-C interactions have
been selected using CHiCAGO pipeline (Cairns et al.,
2016). The graphs defining PCHi-C networks were
constructed using the same significance score of de-
tected interaction that was proposed in the dataset
analysed here. We use the same threshold that was
proposed in (Javierre et al., 2016) – i.e., interactions
with a significance score 5 or above were selected
for defining graph edges. Depending on the chromo-
some, the number of graph vertices ranges between
3000 and 23000 and the number of edges ranges be-
tween 8000 and 66000. We refer to this dataset as
Haema17.
The other well-curated promoter capture Hi-C
dataset (Jung et al., 2019) that we have used contains
data of 28 human tissue samples with an average of
9000 nodes and 17000 interactions per chromosome’s
tissue sample (when filtered by the suggested p-value
threshold p ≥ 0.7). Due to longer-range interactions
being considered less reliable, the authors have in-
cluded in their data only interactions with lengths not
exceeding 2Mb (which, unfortunately, is a limitation
from our perspective). We refer to this dataset as Tis-
sue28.
The average graph densities are similar for both
datasets and range between 2 and 3 depending on
the chromosome if cell type or tissue specificity of
the edges are not taken into account. The number of
edges shared by several cell lines or tissues, however,
is slightly higher in Haema17 dataset; this well cor-
responds to the fact that the Haema17 contains data
for more closely related cell types in comparison to
Tissue28.
Only interactions within the same chromosomes
are included in graphs defined by these datasets (thus,
each chromosome is represented separately by its spe-
cific graph). Chromosomes X and Y are not included
in the analysis. The edge directionally used to define
A, B, C and D types of 3-clique patterns are directly
based on ’bait’ and ’other end’ assignments as given
in PCHi-C data sets. Strand assignments for defining
X, Y and Z types of patterns were derived from strand
assignments of promoter regions according to the En-
sembl reference genome (GRCh38). Not all strand
assignments could be derived in such a way, and a
number of derived assignments were ambiguous. The
corresponding chromatin interactions in these cases
were excluded from datasets, resulting in the exclu-
sion of approximately 50% of interactions.
3 RESULTS
We have analysed statistical properties of distribu-
tions of edge directionality and strand location pat-
terns for Haema17 and Tissue28 data sets. Figure 2
shows the distribution of pattern A, B, C and D fre-
quencies (as counted in thousands) for each of the
chromosomes and also their average lengths (in kilo-
bases) for Haema17 data set. As it was anticipated,
there are no significant distinctions of pattern A, B
and C frequencies (466119 type A, 457752 type B
and 500289 type C patterns across the all chromo-
somes). Also, as it was anticipated, pattern D is less
abundant (81287 type D patterns across all the chro-
mosomes), although there is a notable variation in its
relative frequency by chromosomes. Very noticeably,
however, span lengths for type D patterns are signif-
icantly larger, indicating that their occurrence is not
distributed randomly – the average span lengths of
type A, B and C patterns being around 80Mb, and the
average span length of type D patterns around 205Mb.
Also worth noticing is the fact that the average length
increase for type D patterns is less pronounced for
chromosomes in which they occur more frequently
(e.g., for chromosomes 6 and 19, which have, corre-
spondingly, the average lengths around 30Mb and 130
Mb for the A, B and C types and the average lengths
around 50Mb and 150 Mb for the D type).
Unfortunately, Tissue28 data set does not allow to
replicate or validate the observation of substantially
increased span lengths of type D patterns since longer
range interactions have been explicitly excluded from
it.
At the present stage we can not provide a plausi-
ble biological explanation for increased span lengths
of type D patterns, although the observed increase of
lengths is statistically significant and likely must have
underlying reasons that merit further exploration.
A property that is shared by both datasets is the
BIOINFORMATICS 2025 - 16th International Conference on Bioinformatics Models, Methods and Algorithms
582
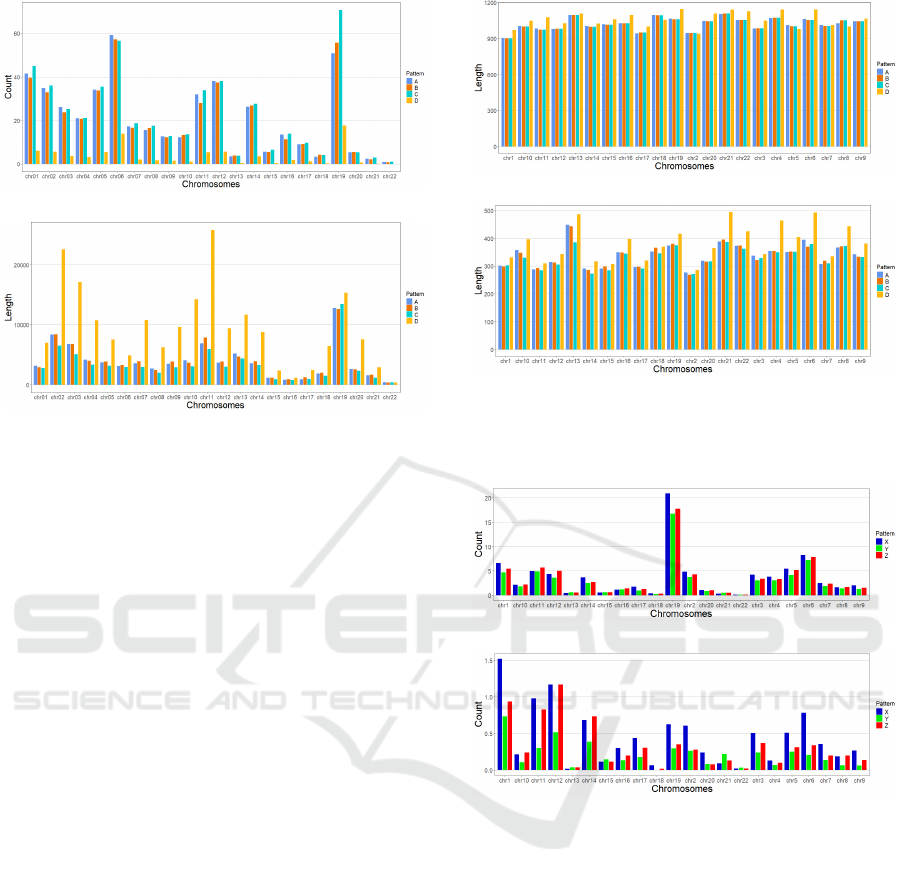
Figure 2: Counts (in thousands) of A, B, C and D type pat-
terns (above), and their average span lengths (in kb) (below)
for Haema17 dataset.
reduction of span lengths for all types of patterns
that are present in a larger number of tissues or cell
types. Figure 3 shows a comparison of average pat-
tern lengths in Tissue28 data set for unrestricted pat-
terns and patterns that occur in at least 5 different tis-
sue types – for the latter, the average span lengths drop
more than twice. Very similar approximately twofold
size reduction can be observed for Haema17 data set
(for cut-off using the same requirement, that patterns
must be shared by at least 5 different cell types), al-
though in numerical terms, the average span lengths
for this data set are larger. It should be noted that
this reduction of span lengths can not be explained by
reduced span lengths of single interactions shared by
multiple tissue or cell types, average lengths of which
depend little on the number of tissue or cell types in
which a particular interaction is observed.
The frequencies of X, Y and Z type patterns ob-
served in the whole data sets generally correspond to
random expectations, with similar counts of types X
and Y and type Z patterns being approximately twice
as frequent. For Haema17 data set, their frequency
distribution is shown in Figure 4 (above). (For eas-
ier comparison, the counts of Z types of patterns are
divided by 2.) The frequency distribution, however,
noticeably changes when we restrict our attention to
patterns with limited span lengths. In this case, a no-
ticeable increase in pattern X frequencies, as well as
a noticeable decrease in pattern Y frequencies, can be
observed. The results for Haema17 data set using 200
kilobase length cut-off is shown in Figure 4 (below).
Very similar results of X, Y and Z type pattern distri-
bution can be observed also for Tissue28 data set.
Figure 3: Average span lengths (in kb) of A, B, C and D
type patterns without tissue type specificity (above), and for
patterns that occur in at least 5 different tissues (below) for
Tissue28 dataset.
Figure 4: Counts (in thousands) of X, Y and Z type patterns
with unrestricted lengths (above), and with lengths up to
200kb (below) for Haema17 data set. For easier comparison
the counts of Z type patterns are divided by 2.
4 DISCUSSION
We have proposed an extension of graph represen-
tations of chromatin interaction networks by incor-
porating edge directionality and vertex label assign-
ments and have analysed statistical properties of dis-
tributions of patterns defined by edge directional-
ity (types A, B, C and D) and strand assignments
(types X, Y and Z) in well-curated two promoter cap-
ture Hi-C data sets. The results confirm that both
directionality- and strand-based patterns are not ran-
domly distributed, and there should be underlying bi-
ological reasons for the observed deviations.
One of the observed deviations is significantly in-
Enhanced Graph Representations of Chromatin Interaction Networks
583

creased span lengths of type D patterns, which are de-
fined by three promoters (in comparison, A, B and
C types of patterns involve only two promoters). A
possible explanation for this might be that, compared
to other types, the observed type D patterns can be
more likely associated with functioning gene regula-
tory feedback loops. Such a hypothesis could be val-
idated from gene expression measurements. Unfortu-
nately, no appropriate gene expression data with good
genome-wide coverage are available for cell types
from Haema17 data set. Similar validation would
be much easier to perform for Tissue28 data set us-
ing, e.g., gene expression data from GTEx consortium
(Consortium, 2020). However, the long-span chro-
matin interactions for which to perform such valida-
tions have not been included in the underlying PCHi-
C data. Nevertheless, there is a good potential to val-
idate or refute such a hypothesis when new, better-
suited experimental data sets become available. Pro-
vided that appropriate datasets for such type of analy-
sis is at hand, an interesting and promising challenge
in this research direction would be integrated analy-
sis of chromatin interaction and gene expression net-
works using a unified approach already well estab-
lished for gene expression networks, such as (Song
and Zhang, 2015).
The observation that for all types of patterns, their
average span lengths are reduced for patterns that are
present in a larger number of tissues or cell types is
consistent and complements a previously known fact
of tissue specificity of 3-cliques. The underlying rea-
sons for this merit additional exploration; however,
any pattern-type specificity for this property is lack-
ing.
Of notable interest might be the observed bias of
X, Y and Z pattern distributions for shorter-range in-
teractions. The most abundant type X patterns involve
all promoters positioned on the same strand, and the
least frequent type Y involves all adjacent promoters
lying on alternate strands. Thus, a plausible explana-
tion for such a bias could be related to local spatial
constraints on chromosome 3D structure, although a
much more detailed and comprehensive study would
be needed to assess this.
The observed statistical biases of 3-clique pattern
distribution are based on analysis of two PCHi-C data
sets and it remains an open question of how general-
izable or data set-specific these statistical deviations
could be. We also do not anticipate that any particular
type of the proposed patterns can be closely related
to some very specific biological role. Nevertheless,
the analysis gives a good justification for a further,
more comprehensive exploration of chromatin inter-
action data sets using network representations that in-
clude edge directionality and strand-based node la-
bel assignments, if these can be assigned on the basis
of the available data, and indicates a possibility that
these features might be related to some underlying bi-
ological mechanisms.
ACKNOWLEDGEMENTS
The research was supported by Latvian Council of
Science project lzp-2021/1-0236.
REFERENCES
Cairns, J.and Freire-Pritchett, P. et al. (2016). CHiCAGO:
robust detection of DNA looping interactions in cap-
ture Hi-C data. Genome Biology, 17:127.
Catarino, R. and Stark, A. (2018). Assessing sufficiency
and necessity of enhancer activities for gene expres-
sion and the mechanisms of transcription activation.
Genes & Development, 32(3-4):202–223.
Consortium, G. (2020). The GTEx Consortium atlas of ge-
netic regulatory effects across human tissues. Science,
369(6509):1318–1330.
Dixon, J., Selvaraj, S., et al. (2012). Topological domains
in mammalian genomes identified by analysis of chro-
matin interactions. Nature, 485:376–380.
Dotson, G., Chen, C., et al. (2022). Deciphering multi-way
interactions in the human genome. Nature Communi-
cations, 13:5498.
Eagen, K. (2018). Principles of chromosome architecture
revealed by Hi-C. Trends in Biochemical Sciences,
43(6):469–478.
Grubert, F., Srivas, R., et al. (2020). Landscape of cohesin-
mediated chromatin loops in the human genome. Na-
ture, 583(7818):737–743.
Javierre, B. Burre, O. et al. (2016). Lineage-specific
genome architecture links enhancers and non-coding
disease variants to target gene promoters. Cell,
167(5):1369–1384.
Jung, I., Schmitt, A., et al. (2019). A compendium of
promoter-centered long-range chromatin interactions
in the human genome. Nature Genetics, 51(10):1442–
1449.
Lace, L., Melkus, G., et al. (2020). Characteristic topo-
logical features of promoter capture Hi-C interaction
networks. Communications in Computer and Infor-
mation Science, 1211:192–215.
Lieberman-Aiden, E., Van Berkum, N., et al. (2009). Com-
prehensive mapping of long-range interactions reveals
folding principles of the human genome. Science,
326(5950):289–293.
Matharu, N. and Ahituv, N. (2015). Minor loops
in major folds: Enhancer–promoter looping, chro-
matin restructuring, and their association with tran-
scriptional regulation and disease. PLOS Genetics,
11(12):e1005640:476–486.
BIOINFORMATICS 2025 - 16th International Conference on Bioinformatics Models, Methods and Algorithms
584

Melkus, G., Silina, S., et al. (2023). Clique-based topo-
logical characterization of chromatin interaction hubs.
Lecture Notes in Computer Science, 14248:476–486.
Mora, A., Sandve, G., et al. (2016). In the loop: promoter-
enhancer interactions and bioinformatics. Briefings in
Bioinformatics, 17(6):980–995.
Morlot, J., Mozziconacci, J., et al. (2016). Network con-
cepts for analyzing 3D genome structure from chro-
mosomal contact maps. PJ Nonlinear Biomedical
Physics, 4:2.
Pancaldi, V. (2023). Network models of chromatin struc-
tures. Current Opinion in Genetics & Development,
80:102051.
Przulj, N. and Malod-Dognin, N. (2016). Network analytics
in the age of big data. Science, 353(6295):123–124.
Rao, S., Huntley, M., et al. (2014). A 3D map of the hu-
man genome at kilobase resolution reveals principles
of chromatin looping. Cell, 162(3):687–688.
Sarajlic, A., Malod-Dognin, N., et al. (2016). Graphlet-
based characterization of directed networks. Scientific
Reports, 6(35098).
Schleif, R. (1992). DNA looping. Annual Review of Bio-
chemistry, 61:199–223.
Schmitt, A., Hu, M., et al. (2016). A compendium of chro-
matin contact maps reveal spatially active regions in
the human genome. Cell Reports, 17(8):2042–2059.
Schoenfelder, S., Clay, I., et al. (2010). The transcriptional
interactome: gene expression in 3D. Current Opinion
in Genetics & Development, 20(2):127–133.
Schulz, T., Stoye, J., et al. (2018). GraphTeams. a method
for discovering spatial gene clusters in hi-c sequenc-
ing data. BMC Genomics, 19(S5):308.
Siahpirani, A., Ferhat, A., et al. (2016). A multi-task
graph-clustering approach for chromosome conforma-
tion capture data sets identifies conserved modules of
chromosomal interactions. Genome Biology, 17:114.
Song, W. and Zhang, B. (2015). Multiscale embedded gene
co-expression network analysis. PLoS Computational
Biology, 11(11):e1004574.
Tan, Z., Guarnera, E., et al. (2018). Exploring chromatin
hierarchical organization via Markov State Modelling.
PLOS Computational Biology, 14(12):e1006686.
Thibodeau, A., Marquez, E., et al. (2017). Chromatin inter-
action networks revealed unique connectivity patterns
of broad H3K4me3 domains and super enhancers in
3D chromatin. Scientific Reports, 7(1):14466.
Viksna, J., Melkus, G., et al. (2020). Topological struc-
ture analysis of chromatin interaction networks. BMC
Bioinformatics, 20(S23):618.
Wang, W., Gao, L., et al. (2021). Ccip: predicting ctcf-
mediated chromatin loops with transitivity. Bioinfor-
matics, 37(24):4635–4642.
Yaveroglu, O., Milenkovic, T., and Przulj, N. (2015).
Proper evaluation of alignment-free network compar-
ison methods. Bioinformatics, 31(16):2697–2704.
Enhanced Graph Representations of Chromatin Interaction Networks
585
