
Exploring the Relationship Between Intracavitary Electrohysterogram
Characteristics from Contraction and Window Analysis
Juan Miguel Mira-Tomas
1a
, Alba Diaz-Martinez
1b
, Jose Alberola-Rubio
1c
, Pilar Alamá Faubel
2d
,
Gemma Castillón Cortés
2e
, Sergio Caballero Sanz
2f
and Javier Garcia-Casado
3g
1
SONDA DEVICES S.L, Valencia, Spain
2
Instituto Valenciano de Infertilidad (IVI), Valencia, Spain
3
Centro de Investigación e Innovación en Bioingeniería, Universitat Politècnica de València, Ci2B UPV, Valencia, Spain
Keywords: Intracavitary Electrohysterography, Contraction Analysis, Window Analysis, Uterine Peristalsis.
Abstract: Assisted reproductive technologies are increasingly common due to the rising maternal age. One potential
cause of embryo implantation failure is altered uterine peristalsis patterns. Intracavitary electrohysterography
(IC-EHG) is a recent technique developed to characterize the electrophysiology of uterine peristalsis
throughout the menstrual cycle. Two primary methodologies are employed for analysis: Contraction Analysis
and Window Analysis. This study aims to examine the relationship between parameters describing the same
characteristics of the signals using contraction and window analysis of 2, 4 and 10 minutes. Peristalsis was
recorded at three different menstrual cycle phases from 10 fertile healthy women. Continuous 10 minutes
recordings free of artifacts were selected. A very strong linear relationship (R
2
≥ 0.95) was found between the
amplitude parameter from contraction (Root Mean Square (RMS)) and window (80
th
percentile of signal RMS
envelope) analysis. For the spectral parameter (Median Frequency), the relationship was strong (0.59 ≤ R
2
≤
0.75), while for the non-linear parameter (Sample Entropy), it was moderate (0.19 ≤ R
2
≤ 0.29). Strongest
relationships were obtained with 2-minutes windows. The findings suggest that window analysis can
accurately assess contraction intensity and, more moderately its spectral content; but basal segments in
window analysis significantly influence the signal complexity parameter.
1 INTRODUCTION
The increasing maternal age in recent decades has led
to a raise in infertility rates, often needing assisted
reproductive technologies (Balasch, 2010).
Congenital and acquired uterine anomalies, such as
septate uterus or leiomyomas, are the most
contributing factor in approximately 30 % of
infertility cases (Brugo-Olmedo et al., 2001).
Endometriosis and adenomyosis are closely related
with infertility, since the appearance of endometrial
tissue in atypical places alter the normal anatomy of
a
https://orcid.org/0009-0001-7899-4864
b
https://orcid.org/0000-0002-4605-6048
c
https://orcid.org/0000-0003-2112-7927
d
https://orcid.org/0000-0003-0204-0826
e
https://orcid.org/0009-0006-0558-0421
f
https://orcid.org/0000-0002-1020-0239
g
https://orcid.org/0000-0003-1410-2721
the uterine tract. These uterine pathologies express a
disturbed peristaltic pattern, since there exists a
significant increase in the number and power of
contractions (Leyendecker et al., 2022), which can
further complicate reproductive outcomes by
interfering with both sperm ascent and embryo
implantation.
Therefore, studying and characterizing uterine
peristalsis is crucial for developing effective therapies
for reproductive disorders associated with abnormal
uterine dynamics. Various techniques can be
employed to monitor uterine contractions throughout
914
Mira-Tomas, J. M., Diaz-Martinez, A., Alberola-Rubio, J., Faubel, P. A., Cortés, G. C., Sanz, S. C. and Garcia-Casado, J.
Exploring the Relationship Between Intracavitary Electrohysterogram Characteristics from Contraction and Window Analysis.
DOI: 10.5220/0013174000003911
Paper published under CC license (CC BY-NC-ND 4.0)
In Proceedings of the 18th International Joint Conference on Biomedical Engineering Systems and Technologies (BIOSTEC 2025) - Volume 1, pages 914-920
ISBN: 978-989-758-731-3; ISSN: 2184-4305
Proceedings Copyright © 2025 by SCITEPRESS – Science and Technology Publications, Lda.

the menstrual cycle. Intrauterine pressure (IUP)
measurements are useful for obtaining mechanical
parameters such as contraction frequency of
occurrence, duration and amplitude (Benalcazar-
Parra et al., 2019). However, this method does not
provide information about spectral and nonlinear
domain parameters, as well as may not be sensitive
enough to capture low-intensity contractions that
occur during the menstrual cycle. Imaging-based
techniques such as transvaginal ultrasound (TVUS)
or magnetic resonance imaging (MRI), can visualize
waves propagating throughout the endometrium by
watching video files at accelerated speed. In addition
to requiring expert operator and the subjectiveness of
the evaluation, the limitation of these techniques is
that they can only characterize the frequency of
occurrence and directionality of contractions, without
obtaining intrinsic contraction parameters (van Gestel
et al., 2007), (Togashi, 2007). All of these techniques
have been used to monitor uterine contractions during
menstrual cycle, as well as during pregnancy and
childbirth. Nevertheless, another technique known as
electrohisterography (EHG), allows the measurement
of myometrial electrical activity from the abdominal
surface during pregnancy (Diaz-Martinez et al., 2024)
and childbirth (Alberola-Rubio et al., 2017).
Intracavitary electrohysterography (IC-EHG)
emerged due to the need to study the
electrophysiology of low intensity uterine peristalsis
during the menstrual cycle (Alberola Rubio, 2021).
This technique enables the exploration of all
parameters assessed by the previous techniques, in
addition to those in the spectral and nonlinear
domains.
When characterizing myometrial electrical
activity using EHG, two primary approaches can be
followed: window analysis (WND) or contraction
analysis (CTR) (Díaz-Martinez et al., 2021), (Mas-
Cabo et al., 2019). In the former, fixed-length
segments are selected to encompass continously
physiological information from the signal. It is crucial
to ensure that these segments are free from artifacts
or interference that could distort parameter
calculations. Conversely, in contraction analysis,
parameters are computed over the signal bursts,
requiring prior identification of these contractions,
often a manual, subjective and time-consuming task
(Mas-Cabo et al., 2019).
The aim of this study is to investigate the degree
of association between parameters characterizing the
same characteristics of IC-EHG signals when using
either CTR or WND analysis.
2 MATERIALS AND METHODS
2.1 Database Composition
This study included 30 IC-EHG signals acquired from
10 volunteer women at the Ovodonation Unit of the
Valencian Infertility Institute from Valencia, Madrid
and Barcelona. Participants of reproductive age (18-
34 years) were recruited if they exhibited regular
menstrual cycles, a body mass index between 18.5
and 25 kg/m², and a documented history of fertility.
Exclusion criteria included uterine malformations,
pregnancy, sexual intercourse within the previous 48
hours, use of any contraceptive method, severe
dysmenorrhea, irritable bowel syndrome, or a history
of ectopic pregnancies.
Following enrollment, each participant
underwent three recordings: one during the mid-
follicular phase (MF, 6-8 days post-menses), another
during the early luteal phase (EL, 2-4 days post-LH
surge), and a final one during the late-luteal phase
(LL, 7-9 days post-LH surge). All participants were
provided with detailed information about the study
and gave their informed consent. The study adhered
to the guidelines outlined in the Declaration of
Helsinki and was approved by the Institutional
Review Board of the Hospital Universitari i
Politècnic La Fe (Valencia, Spain) under registration
number 2023-108-1.
2.2 Signal Recording and Preprocessing
All recordings were conducted using a disposable 6-
pole multipolar catheter for the detection of non-
pregnant myometrial electrical activity (Alberola
Rubio, 2021). The tip electrode was in contact with
the uterine fundus, while the distal electrode was
closer to the cervix. The later served as the reference
electrode as smooth muscle cells content decreases
towards the cervix (Wray & Prendergast, n.d.).
Monopolar signals from each electrode were
amplified with a bandwidth of 0.1 to 30 Hz and
acquired for 30 minutes at a sampling rate of 500 Hz.
For this study, a bipolar signal from the uterine
fundus region was obtained as the difference between
the signals capturated by the first two catheter
electrodes. The signal was digitally filtered in the fast
wave bandwidth (Devedeux et al., 1993), (Fele-Žorž
et al., 2008). For each recording, a segment of 10
minutes of continous physiological information was
carefully selected by consensus between two experts,
avoiding artefacted signal segments
Exploring the Relationship Between Intracavitary Electrohysterogram Characteristics from Contraction and Window Analysis
915
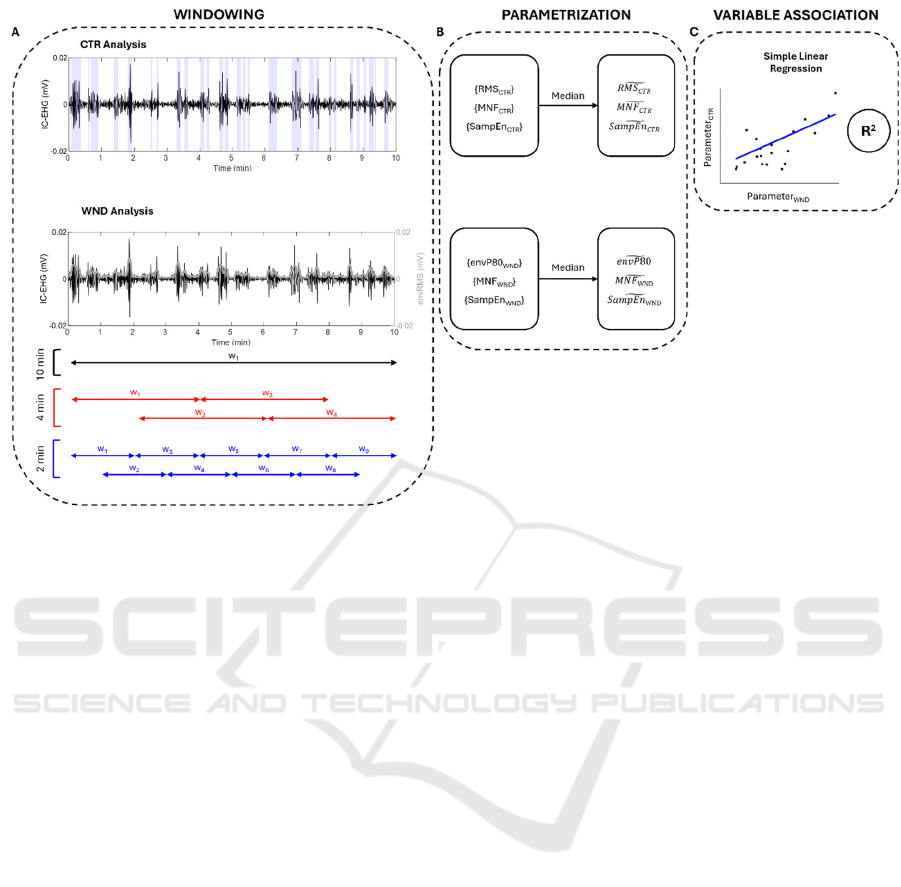
Figure 1: Signal analysis methodology. A) Windowing step with CTR and WND analysis. Contractions have been identified
in CTR, whereas three different window sizes (10, 4 and 2 minutes) have been used in WND analysis. B) Amplitude, spectrum
and complexity parameter calculation for each analysis. C) Simple linear regression for assessing the relationship between
the same IC-EHG characteristics with CTR and WND analysis.
2.3 Windowing and Parametrization
Figure 1 illustrates the methodology employed in this
study. Initially, a windowing step is implemented to
identify the segments for analysis based on CTR o
WND approaches. Subsequently, parameters are
extracted from these segments and summarized at a
recording level by their median value. Finally, a
simple linear regression is performed for parameters
that characterize same IC-EHG features with CTR
and WND analysis.
As represented in Figure 1A, CTR analysis
requires the identification of the start and end points
of peristaltic waves. This was carried out by two
experts in electrohysterographic recording and
analysis. For each identified contraction, three widely
used parameters were calculated to describe different
aspects of the signal: signal amplitude/intensity,
spectrum and complexity.
Root Mean Square (RMS
CTR
): is a robust
measure for characterizing the intensity of the
uterine myoelectrical activity. It is defined as
the square root of the arithmetic mean of the
squares of the values (Mohammadi Far et al.,
2022).
Mean Frequency (MNF
CTR
): is a spectral
parameter related with cell excitability (Mas-
Cabo et al., 2020). It is computed as the sum of
product of the IC-EHG power spectrum and the
frequency divided by the total sum of the power
spectrum (Phinyomark et al., 2012).
Sample Entropy (SampEn
CTR
): is a non-
linear parameter which estimates signal
complexity. It is computed as the negative
natural logarithm of the probability that two
sequences similar for m points remain similar
at the next point, with a certain tolerance r and
ignoring self-matches. Hyperparameters m=2
and r=0.1 have been chosen as suggested in
(Radomski, 2010).
On the other hand, the WND analysis does not
require precise identification of peristaltic events but
does necessitate the setting of a hyperparameter, the
window size. In this study, three window sizes were
tested: 10, 4, and 2 minutes, with a 50% overlap
(except for 10 minutes windows), represented by
arrows of different color in Figure 1A. The following
parameters were computed for each window of
analysis.
To describe the intensity of the uterine
myoelectric activity, it is common to create an
envelope signal to analyze and characterize amplitude
evolution of EHG signals (Chowdhury et al., 2024).
BIOSIGNALS 2025 - 18th International Conference on Bio-inspired Systems and Signal Processing
916
It was calculated using a 5-second moving RMS,
computed sample by sample. Following the
generation of this smoothed version, the 80
th
percentile of the envelope weas selected for each
window (envP80
WND
). This selection was based on a
percentile sweep conducted with a step size of 5%,
identifying the percentile that exhibited the strongest
linear relationship with RMS
CTR
. MNF
WND
and
SampEn
WND
were computed as in the contraction
analysis, but on whole windows of the signal rather
than on single contractions.
To summarize the information at the recording
level, the median values of the contractions or
window’s parameters were calculated for each
analysis as represented in Figure 1B.
2.4 Variable Association
A simple linear regression model was used to assess
the relationship between the parameters derived from
CTR and WND analysis that characterized the signal
intensity, spectrum and complexity. The coefficient
of determination (R
2
) was computed to quantify the
proportion of variance in the dependent variable that
could be attributed to the predictor variable. This
metric provides an indication of the strength of the
linear association between the two variables, and it is
the evaluation metric selected as shown in Figure 1C.
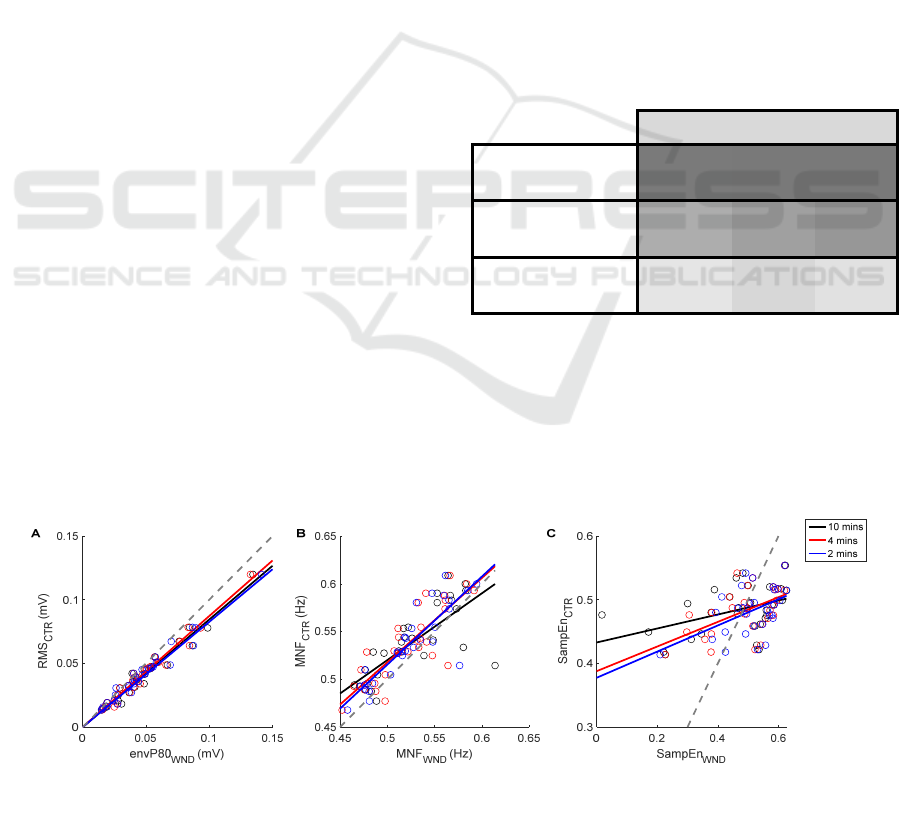
3 RESULTS
Figure 2 shows the scatterplots and linear
interpolation curves between contractions parameters
and their counterparts with window analysis using
different window sizes. Complementarily, Table 1
shows the coefficient of determination (R
2
) that
quantifies the strength of the linear relationship
between variables. Regarding amplitude parameters,
a very strong linear association (R
2
>0.95) was
obtained between RMS
CTR
and envP80
WND
for any
window size as observed in Table 1. Moreover, as it
can be appreciated in Figure 2A, the fitted lines for
the three window sizes show intercepts close to zero
and slopes slightly smaller than 1. Frequency domain
parameters MNF
CTR
and MNF
WND
also showed a
strong linear relationship between them. The
maximum R
2
is obtained when using a window size
of 2 minutes (R
2
=0.75), followed by the 4-min
window size (R
2
=0.69). The strength of the
relationship is s significantly reduced with a 10-min
window size (R
2
=0.59). Finally, complexity
parameters SampEn
CTR
and SampEn
WND
show a weak
relationship when using 10-min windows (R
2
=0.19),
and moderate for 2-min and 4-min windows (R
2
=0.22
and 0.29, respectively). This can also be seen in
Figure 2C, where it can be observed that the different
measurements are quite scattered without being
concentrated near the fit lines.
Table 1: Coefficients of determination (R
2
) of associations
between contraction and window analysis parameters using
different window sizes.
10 min 4 min 2 min
RMS
CTR
vs
envP80
WND
0.96 0.97 0.97
MNF
CTR
vs
MNF
WND
0.59 0.69 0.75
SampEn
CTR
vs
SampEn
WND
0.19 0.29 0.22
Moreover, to assess the effect of menstrual phase in the
analysis, same procedure has been carried out but
splitting the population into 3 different subpopulations
(MF, EL and LL), so that 10 recordings are analysed
for each group. Table 2 shows the strength of
association between same CTR and WND parameters
depending on each menstrual phase.
Figure 2: Scatterplot showing simple linear regression for the association between CTR and WND parameters when computed
using different window sizes. Dashed line represents 1:1 relationship (identity).
Exploring the Relationship Between Intracavitary Electrohysterogram Characteristics from Contraction and Window Analysis
917

Table 2: Coefficients of determination (R
2
) of associations
between CTR and WND parameters in subpopulations
based on menstrual phase (MF: mid follicular, EL: early
luteal, LL: late luteal).
10 min 4 min 2min
RMS
CTR
vs
envP80
WND
MF 0.95 0.95 0.94
EL 0.95 0.97 0.99
LL 0.92 0.93 0.95
MNF
CTR
vs
MNF
WND
MF 0.92 0.91 0.92
EL 0.21 0.49 0.56
LL 0.77 0.54 0.81
SampEn
CTR
vs
SampEn
WND
MF 0.55 0.56 0.55
EL 0.23 0.51 0.46
LL 0.08 0.12 0.12
It can be appreciated from Table 2 that amplitude
parameters are highly correlated irrespective of the
menstrual phase. However, some differences can be
appreciated in frequency and non-linear parameters
with respect to the menstrual phase. MNF
WND
in early
luteal phase do not correlate with MNF
CTR
as in MF
or LL. Similarly, SampEn
WND
and SampEn
CTR
do not
show linear correlation when assessed in LL.
4 DISCUSION
As shown in Table 1, there is a strong correlation
between amplitude parameters from contraction and
window analysis. The window size for the WND
analysis does not affect the strength of this
association. Nevertheless, we believe it is preferable
to use small window values, as spurious artifacts
might appear and, by selecting the median
envP80
WND
value across all windows, the analysis
could be more robust to outliers caused by high-
energy artifacts (Batista et al., 2016). According to
Table 2, the menstrual phase does not influence the
correlation between these two variables. While the
intensity of uterine contractions varies throughout the
menstrual cycle (Bulletti et al., 2004) under the
influence of sexual hormones, the association
between the two variables is robust to the influence of
the cycle phase. Therefore, the coefficients of the
simple linear regression could be used to predict the
RMS
CTR
parameter without the need for prior
segmentation of peristaltic contractions.
Regarding the spectral parameters MNF
CTR
and
MNF
WND
, there is a significant relationship between
them. Generally, MNF
CTR
values are higher than
MNF
WND
values (they lie above the identity line,
Figure 2B). This should mainly be associated to the
inclusion of basal segments in the calculation of
MNF
WND
. Basal segments are of lower power and
hence the power of the whole signal is reduced in
comparison to that of only contractions.
Consequently, the more concentrated power in the
lower frequencies of contraction segments is
emphasized with respect of this reduced total power,
yielding lower mean frequencies. Another aspect that
can provoke differences between MNF
CTR
and
MNF
WND
could be the difference in the frequency
resolution. As can be seen in Figure 1, the duration of
contractions is smaller than any window size (2, 4 or
10 mins), which modifies the frequency resolution for
CTR and WND analysis. The smallest window size
has the most similar frequency resolution to that of
contractions and could also be contributing to
obtaining the strongest relationship between spectral
parameters derived from CTR and WND analysis. It
is worth noting the low relationship between the two
parameters in EL phase in comparison to that of MF
phase. This could be related to differences in the
electrophysiological conditions of uterine muscle in
these two phases. More specifically, IUP recordings
during EL phase have shown a greater rate of
contractions and an elevated basal tone (Van Gestel
et al., 2003), which may be attributed to altered
cellular excitability in this phase, influencing the
basal state. Further studies would be necessary for a
more refined interpretation of these results.
Finally, a significant but moderate relationship
exists between SampEn
CTR
and SampEn
WND
. As
illustrated in Figure 2, it is preferable to use shorter
windows, of 2 or 4 minutes, as the regularity of the
signal may vary throughout the recording or differ
significantly between phases of the menstrual cycle,
making it challenging to generalize the relationship
between these variables across the entire menstrual
cycle. Physiologically, a decrease in entropy can be
interpreted as a result of increased coordination
among myometrial cells (Mischi et al., 2018). Similar
to findings regarding MNF, significant differences
have been observed between SampEn of contractile
and non-contractile segments in EHG recordings
from pregnant women (Hao et al., 2019). While the
behavior in non-pregnant uteri is not fully
understood, it is likely that coordination among cells
changes throughout the menstrual cycle for both
contractile and non-contractile segments. Table 2
supports this hypothesis, as the correlation between
SampEn
CTR
and SampEn
WND
decreases as the cycle
progresses, being much lower in the luteal phase than
the mid-follicular phase. This may be attributed to
changes in the expression of gap junctions throughout
BIOSIGNALS 2025 - 18th International Conference on Bio-inspired Systems and Signal Processing
918

the menstrual cycle. Estrogen, the dominant hormone
during the follicular phase, promotes the formation of
connexin 43 (the protein that makes up gap junctions,
which facilitate the electrical communication between
adjacent cells). In contrast, progesterone, which
dominates the luteal phase, reduces the expression of
connexin 43, leading to decreased cellular coordination
during this phase (Condon et al., 2020).
This study has several limitations. The
identification of the artefactual signal segments to be
excluded from the analysis is carried out manually by
two experts. In future studies, automatic classifiers
could be used to annotate artifacted segments.
To assess the degree of relationship between the
parameters derived from the WND and CTR
methods, the R2 of the linear regression was used. An
error analysis could provide additional information.
For example, a Bland-Altman plot would be
informative to identify and provide further insight
into the causes of those specific cases where a
significant deviation is observed between the
parameter calculated using the WND and CTR
methods. In addition, the sample size is small and it
would be necessary to expand the database and ensure
the reproducibility of the experiment by obtaining
multiple samples per subject and phase.
5 CONCLUSIONS
The IC-EHG technology has emerged as an
alternative technique for analyzing myometrial
electrophysiology in non-pregnant uteri. This
technique allows for the exploration of spectral and
non-linear parameters that have only previously been
examined in pregnant uteri through EHG recordings
on the abdominal surface. Two primary
methodologies have been used in this context: CTR
and WND analysis. This study aimed to investigate
the relationship between parameters that characterize
the same characteristics of the IC-EHG signal using
CTR and WND analysis to assess their estimation
without the need for cumbersome annotation of
contractions.
In terms of the amplitude, the parameters from
both methods are very highly correlated, indicating
that the envP80
WND
parameter could be used to assess
contraction intensity without prior segmentation,
regardless of the menstrual cycle phase. Regarding
the spectral content, associated to cell excitability, the
MNF of uterine contractions can also be accurately
inferred from whole window analysis, especially in
MF and LL phases. Nonetheless, the signal
complexity during contractions, associated to
coordination among cells, would be poorly inferred
without IC-EHG bursts identification.
Another important conclusion of this work is that,
although longer recordings are necessary to reduce
the possible variability between analysis windows,
the optimal window size for these calculations is 2
minutes.
ACKNOWLEDGEMENTS
This research was funded and supported by the
Science and Innovation Ministry of Spain (DIN2021-
012073).
REFERENCES
Alberola Rubio, J. (2021). Probes, Systems and Methods
for Measuring and/or Characterizing Uterine Activity
in a Non-Pregnant Uterus. https://patentscope.
wipo.int/search/en/detail.jsf?docId=WO2021185781
Alberola-Rubio, J., Garcia-Casado, J., Prats-Boluda, G.,
Ye-Lin, Y., Desantes, D., Valero, J., & Perales, A.
(2017). Prediction of labor onset type: Spontaneous vs
induced; role of electrohysterography? Computer
Methods and Programs in Biomedicine, 144, 127–133.
https://doi.org/10.1016/j.cmpb.2017.03.018
Balasch, J. (2010). Ageing and infertility: An overview.
Gynecological Endocrinology, 26(12), 855–860.
https://doi.org/10.3109/09513590.2010.501889
Batista, A. G., Najdi, S., Godinho, D. M., Martins, C.,
Serrano, F. C., Ortigueira, M. D., & Rato, R. T. (2016).
A multichannel time–frequency and multi-wavelet
toolbox for uterine electromyography processing and
visualisation. Computers in Biology and Medicine, 76,
178–191. https://doi.org/10.1016/j.compbiomed.2016.
07.003
Benalcazar-Parra, C., Garcia-Casado, J., Ye-Lin, Y.,
Alberola-Rubio, J., Lopez, Á., Perales-Marin, A., &
Prats-Boluda, G. (2019). New electrohysterogram-
based estimators of intrauterine pressure signal, tonus
and contraction peak for non-invasive labor monitoring.
Physiological Measurement, 40(8), 085003.
https://doi.org/10.1088/1361-6579/ab37db
Brugo-Olmedo, S., Chillik, C., & Kopelman, S. (2001).
Definition and causes of infertility. Reproductive
BioMedicine Online, 2(1), 173–185. https://doi.org/
10.1016/S1472-6483(10)62193-1
Bulletti, C., De Ziegler, D., Setti, P. L., Cicinelli, E., Polli,
V., & Flamigni, C. (2004). The Patterns of Uterine
Contractility in Normal Menstruating Women: From
Physiology to Pathology. Annals of the New York
Academy of Sciences, 1034(1), 64–83. https://doi.org/
10.1196/annals.1335.007
Chowdhury, R. H., Hossain, Q. D., & Ahmad, M. (2024).
Automated Method for Uterine Contraction Extraction
Exploring the Relationship Between Intracavitary Electrohysterogram Characteristics from Contraction and Window Analysis
919

and Classification of Term Versus Pre-Term EHG
Signals. IEEE Access, 12, 49363–49375. IEEE Access.
https://doi.org/10.1109/ACCESS.2024.3384258
Condon, J. C., Kyathanahalli, C., Anamthathmakula, P., &
Jeyasuria, P. (2020). Estrogen/estrogen receptor action
and the pregnant myometrium. Current Opinion in
Physiology, 13, 135–140. https://doi.org/10.1016/
j.cophys.2019.10.017
Devedeux, D., Marque, C., Mansour, S., Germain, G., &
Duchêne, J. (1993). Uterine electromyography: A
critical review. American Journal of Obstetrics &
Gynecology, 169(6), 1636–1653. https://doi.org/
10.1016/0002-9378(93)90456-S
Díaz-Martinez, A., Monfort-Ortiz, R., Ye-Lin, Y., Garcia-
Casado, J., Nieto-Del-Amor, F., Diago-Almela, V. J.,
Rey-Ferreira, I., Nieto-Tous, M., & Prats-Boluda, G.
(2021). Comparative Study of Uterine Myoelectrical
Response to Labour Induction Drugs in Nulliparous and
Parous Women with Different EHG Analysis
Techniques. 2021 International Conference on E-
Health and Bioengineering (EHB), 1–4.
https://doi.org/10.1109/EHB52898.2021.9657548
Diaz-Martinez, A., Prats-Boluda, G., Monfort-Ortiz, R.,
Garcia-Casado, J., Roca-Prats, A., Tormo-Crespo, E.,
Nieto-del-Amor, F., Diago-Almela, V.-J., & Ye-Lin, Y.
(2024). Overdistention Accelerates Electrophysiolo-
gical Changes in Uterine Muscle Towards Labour in
Multiple Gestations. IRBM, 45(3), 100837.
https://doi.org/10.1016/j.irbm.2024.100837
Fele-Žorž, G., Kavšek, G., Novak-Antolič, Ž., & Jager, F.
(2008). A comparison of various linear and non-linear
signal processing techniques to separate uterine EMG
records of term and pre-term delivery groups. Medical
& Biological Engineering & Computing, 46(9), 911–
922. https://doi.org/10.1007/s11517-008-0350-y
Hao, D., An, Y., Qiao, X., Qiu, Q., Zhou, X., & Peng, J.
(2019). Development of Electrohysterogram Recording
System for Monitoring Uterine Contraction. Journal of
Healthcare Engineering, 2019(1), 4230157.
https://doi.org/10.1155/2019/4230157
Leyendecker, G., Wildt, L., Laschke, M. W., & Mall, G.
(2022). Archimetrosis: The evolution of a disease and
its extant presentation: Pathogenesis and
pathophysiology of archimetrosis (uterine adenomyosis
and endometriosis). Archives of Gynecology and
Obstetrics, 307(1), 93–112. https://doi.org/10.1007/
s00404-022-06597-y
Mas-Cabo, J., Prats-Boluda, G., Perales, A., Garcia-
Casado, J., Alberola-Rubio, J., & Ye-Lin, Y. (2019).
Uterine electromyography for discrimination of labor
imminence in women with threatened preterm labor
under tocolytic treatment. Medical & Biological
Engineering & Computing, 57(2), 401–411.
https://doi.org/10.1007/s11517-018-1888-y
Mas-Cabo, J., Ye-Lin, Y., Garcia-Casado, J., Díaz-
Martinez, A., Perales-Marin, A., Monfort-Ortiz, R.,
Roca-Prats, A., López-Corral, Á., & Prats-Boluda, G.
(2020). Robust Characterization of the Uterine
Myoelectrical Activity in Different Obstetric Scenarios.
Entropy, 22(7), Article 7. https://doi.org/10.3390/e220
70743
Mischi, M., Chen, C., Ignatenko, T., de Lau, H., Ding, B.,
Oei, S. G. G., & Rabotti, C. (2018). Dedicated Entropy
Measures for Early Assessment of Pregnancy
Progression From Single-Channel Electrohystero-
graphy. IEEE Transactions on Biomedical Engineering,
65(4), 875–884. IEEE Transactions on Biomedical
Engineering. https://doi.org/10.1109/TBME.2017.2723
933
Mohammadi Far, S., Beiramvand, M., Shahbakhti, M., &
Augustyniak, P. (2022). Prediction of Preterm Delivery
from Unbalanced EHG Database. Sensors, 22(4),
Article 4. https://doi.org/10.3390/s22041507
Phinyomark, A., Thongpanja, S., Hu, H., Phukpattaranont,
P., Limsakul, C., Phinyomark, A., Thongpanja, S., Hu,
H., Phukpattaranont, P., & Limsakul, C. (2012). The
Usefulness of Mean and Median Frequencies in
Electromyography Analysis. In Computational
Intelligence in Electromyography Analysis—A
Perspective on Current Applications and Future
Challenges. IntechOpen. https://doi.org/10.5772/50639
Radomski, D. (2010). Sensitivity analysis of a sample
entropy estimator on its parameters in application to
electrohysterographical signals. Biocybernetics and
Biomedical Engineering, Vol. 30, 2, 67–72.
Togashi, K. (2007). Uterine Contractility Evaluated on Cine
Magnetic Resonance Imaging. Annals of the New York
Academy of Sciences, 1101(1), 62–71. https://doi.org/
10.1196/annals.1389.030
van Gestel, I., IJland, M. M., Evers, J. L. H., & Hoogland,
H. J. (2007). Complex endometrial wave-patterns in
IVF. Fertility and Sterility, 88(3), 612–615.
https://doi.org/10.1016/j.fertnstert.2006.12.050
Van Gestel, I., IJland, M. M., Hoogland, H. J., & Evers, J.
L. H. (2003). Endometrial wave-like activity in the non-
pregnant uterus. Human Reproduction Update, 9(2),
131–138. https://doi.org/10.1093/humupd/dmg011
Wray, S., & Prendergast, C. P. (n.d.). The Myometrium:
From Excitation to Contractions and Labour. In Smooth
Muscle Spontaneous: Activity Physiological and
Pathological Modulation (Vol. 1124, pp. 233–263).
Springer International Publishing.
BIOSIGNALS 2025 - 18th International Conference on Bio-inspired Systems and Signal Processing
920
