
Post-Processing of Thresholding or Deep Learning Methods for
Enhanced Tissue Segmentation of Whole-Slide Histopathological
Images
Michal Marczyk
1,2 a
, Agata Wrobel
3
, Julia Merta
3
and Joanna Polanska
1b
1
Department of Data Science and Engineering, Silesian University of Technology, 44-100 Gliwice, Poland
2
Yale Cancer Center, Yale School of Medicine, 06511 New Haven, CT, U.S.A.
3
Faculty of Automatic Control, Electronics and Computer Science, Silesian University of Technology,
44-100 Gliwice, Poland
Keywords: Histopathology, Whole-Slide Image, Tissue Staining, Tissue Segmentation, Post-Processing.
Abstract: Digital pathology allows for the efficient storage and advanced computational analysis of stained
histopathological slides of various tissues. Tissue segmentation is a crucial first step of digital pathology
aimed at eliminating background, pen markings, and other artifacts, reducing image size, and increasing the
efficiency of further analysis. In most cases, color thresholding or deep learning models are used, but their
effectiveness is reduced due to complex artifacts and huge color variations between slides. We propose a post-
processing method to increase the tissue segmentation performance of any initial segmentation algorithm.
Using a set of 197 manually annotated histopathological images of breast cancer patients and 63 images of
endometrial cancer patients, we tested our method with 3 thresholding techniques and 3 deep learning-based
algorithms by calculating the Dice index, Jaccard index, precision, and recall. In both datasets, applying post-
processing increased precision and recall for thresholding methods and mostly precision for deep learning
models. Overall, applying post-processing gave better tissue segmentation performance than initial
segmentation methods, significantly increasing Dice and Jaccard indices. Our results proved that thanks to
post-processing, the tissue segmentation pipeline is more robust to noises and artifacts commonly present in
histopathological images.
1 INTRODUCTION
Modern medical imaging enables precise assessment
of the stained histopathologic slides of different
tissues. The most common staining method is
hematoxylin and eosin (HE) since using only these
two stains allows the visualization of major tissue
structures. Hematoxylin stains nuclei blue, while
eosin stains the cytoplasm and connective tissue pink
or red. With histopathological slides, pathologists can
determine the presence and stage of the disease or the
effect of medical treatment (Cooper, L.A., et al.,
2018). The development of digital scanners that can
obtain high-resolution whole-slide images (WSIs)
has contributed to creating extensive datasets with
images for various diseases. Digital processing of
slides and the decreasing data storage costs stimulated
a
https://orcid.org/0000-0003-2508-5736
b
https://orcid.org/0000-0001-8004-9864
the development of new algorithms in the fields of
image processing and machine learning (Serag, A., et
al., 2019). However, the main obstacle is that scanned
images are much larger than natural images, so
analysis could be extremely time-consuming with
high computational capacity requirements.
Most WSIs contain a lot of the background area,
which is uninformative for pathologists and only
increases the computational cost of image analysis.
Tissue segmentation leads to the accurate
identification and isolation of relevant regions of
WSI, which can significantly impact the efficiency
and speed of analysis and decrease the cost of data
storage (Salvi, M., et al., 2021). It is also crucial when
supervised methods are developed on digital slides
since it prevents learning from background noise.
Known semi-automated and manual segmentation
Marczyk, M., Wrobel, A., Merta, J. and Polanska, J.
Post-Processing of Thresholding or Deep Learning Methods for Enhanced Tissue Segmentation of Whole-Slide Histopathological Images.
DOI: 10.5220/0013174700003911
Paper published under CC license (CC BY-NC-ND 4.0)
In Proceedings of the 18th International Joint Conference on Biomedical Engineering Systems and Technologies (BIOSTEC 2025) - Volume 1, pages 229-238
ISBN: 978-989-758-731-3; ISSN: 2184-4305
Proceedings Copyright © 2025 by SCITEPRESS – Science and Technology Publications, Lda.
229

methods, such as color classification, edge detection,
and region growing, can be time-consuming and
labor-intensive, especially when dealing with WSIs.
Thus in practice one of the two approaches is chosen:
traditional thresholding with morphological
operations (Alomari, R.S., et al., 2009; Song, Y., et
al., 2023) or deep learning-based (DL-based)
methods (Riasatian, A., et al., 2020; Lucassen, R.T.,
et al., 2024). In DL models, an encoder is often used
to extract image features while a decoder is used to
restore extracted features to the original image size
and output the final segmentation results, like in U-
Net architecture (Riasatian, A., et al., 2020).
SlideSegmenter, based also on convolutional neural
network encoder-decoder architecture, introduces
some post-processing steps but only for dividing the
segmented tissue into cross-sections (Lucassen, R.T.,
et al., 2024). Additionally, SlideSegmenter provides
pen marking segmentation to exclude these regions
from tissue segmentation. Even though few
techniques have been introduced, there are still many
problems unsolved: (i) the requirement for the color
of the input image to be normalized, due to
differences in staining between laboratories; (ii)
manual adjustments of parameters for atypical cases;
(iii) the performance of the DL models depends on
the datasets used in developing the algorithm or
model training; (iv) supervised methods require
annotation by an expert pathologist.
Post-processing refinements like hole filling and
noise reduction could improve initial segmentation
performance. For example, traditional image
processing techniques produce initial segmentations
that contain single-pixel errors. Also, they might
work well on images with high contrast between
tissue and background but could struggle with images
containing a lot of noise or debris. WSIs often contain
artifacts, such as pen markings, air bubbles, and tissue
folds, that can interfere with subsequent analyses.
Post-processing techniques can be employed to
specifically detect and remove these artifacts,
resulting in cleaner and more reliable data for
downstream tasks. Lastly, DL models also often
benefit from post-processing steps that can refine
their predictions and improve their accuracy.
Here, we propose a method for post-processing
results of various tissue segmentation methods. We
tested a combination of our method with three
traditional thresholding algorithms and three DL-
based solutions on a set of manually annotated HE-
stained histopathological images. For thresholding,
we chose adaptive methods that are unsupervised,
parameter-free, and robust to changes in color
intensity distribution between slides.
2 MATERIALS AND METHODS
2.1 Data
Randomly selected 197 histopathological images of
breast cancer patients (BRCA) and 63 images of
uterine corpus endometrial cancer patients (UCEC)
from The Cancer Genome Atlas (TCGA) obtained
through The Cancer Imaging Archive (Clark, K., et
al., 2013) were manually annotated by a single expert.
The data were saved in .svs format that included
slides in different magnifications. For manual
annotation, images scanned with a magnification of
2.5x were selected. The annotation was done in a
MATLAB environment using the roipoly() function
or using ImageJ software. All fragments of the tissue
in a single slide were marked, excluding artifacts like
pen markings, shades, and others, and extremely
small fragments.
2.2 Adaptive Image Thresholding
Methods
Each scanned HE-stained image is composed of three
channels, R, G, and B, that represent color
components. Thresholding is done on each color
separately. Three thresholding methods were tested:
(i) GaMRed; (ii) Otsu; and (iii) Peaks. GaMRed is
based on the Gaussian mixture decomposition of 1D
signal and includes unique data cleaning and post-
processing steps (Marczyk, M., et al., 2020). Color
intensity from each channel was decomposed into 2
Gaussian components. The component with the
higher mean intensity represents background pixels.
The threshold value was found as the intersection
point between two Gaussians. The Otsu thresholding
method (Otsu, N., 1979) was implemented as a two-
step algorithm. First, the Otsu method is applied to
the original image color channels and cut-off values
are found. Second, the Otsu method is applied to
image color channels thresholded using cut-off values
from the first step, and new cut-off values are
estimated. The Peaks method is based on the peak
detection algorithm developed for the analysis of 1D
mass spectrometry data (Marczyk, M., et al.,2017).
The algorithm finds all maxima and minima using the
first derivative and then removes small amplitude
peaks, similar intensity peaks in close neighborhoods,
and the one with too small signal-to-noise ratio. For
each color, the threshold value was found as a
minimum between the two last peaks of color
intensity. All 3 methods allow adaptive estimation of
cut-of values for color thresholding without any
parameter tuning.
BIOIMAGING 2025 - 12th International Conference on Bioimaging
230

2.3 Deep Learning-Based Methods
Three existing methods based on deep learning (DL)
models were evaluated for a tissue segmentation task.
All models were previously trained by the respective
authors on their datasets and used as predictors with
TCGA data to mimic real life scenario in which tissue
annotations are not provided. All parameters were set
as default. The first method, called SlideSegmenter is
a convolutional neural network with a post-
processing method based on clustering predicted
centroid locations of the cross-sections in a 2D
histogram (Lucassen, R.T., et al., 2024). Another two
methods resulted from the experiments on the U-Net
architecture with different network backbones
(Riasatian, A., et al., 2020). Based on the published
results, the two best backbones were selected for
comparison: EfficientNet-B3 and MobileNet.
2.4 Post-Processing Methods
The proposed method consists of three subsequent
steps: (i) artifacts removal (P1); (ii) region filling
(P2); and (iii) small regions removal (P3). Artifacts,
which mainly are due to errors during specimen
preparation, staining, imaging, or tissue handling,
were found and removed using raw WSIs (without
thresholding). First, pixels including black and grey
color artifacts (resulting from tissue folding, air
bubbles, dust, debris and others) were identified using
the following steps: (i) create a mask of pixels with a
difference between red and green color channels
smaller than 10 and a difference between green and
blue color channels smaller than 10; (ii) remove the
background region resulting from image thresholding
from the mask; (iii) remove too small regions from
the mask (<30 pixels); (iv) apply morphological
closing using a disk of radius 3; (v) apply
morphological opening using a disk of radius 3.
Pixels including green color artifacts (mostly due to
green pen markings) were identified similarly, with
modifications only in the first step; the initial mask
was created using pixels with a difference between
red and blue color channels smaller than 10 and
intensity of green color higher than 150. Next, using
cleaned images an initial segmentation operation was
performed to find the tissue mask using methods
described in the previous section. Additionally, pixels
with low chroma component (square root of the sum
of squared a and b color values resulting from image
transformation to LAB color space smaller than 3)
were removed from the mask. Next, in P2 holes in the
mask were filled using the morphological region
filling method with 4 connectivity, and
morphological opening using a disk of radius 3 was
applied. Finally, in P3 small area objects were
removed from a tissue mask (smaller than 1% of the
total tissue mask region). All parameters were
estimated on a small pool of HE-stained images
scanned with 2.5x magnification, but not used in this
manuscript, and then fixed during the analysis. Codes
for thresholding and post-processing are available on
GitHub under the following adress:
github.com/ZAEDPolSl/WSI_TissueSeg .
2.5 Evaluation Metrics
Four different performance metrics were used to
compare tissue segmentation models before and after
applying post-processing: Dice coefficient, Jaccard
index, pixel precision, and pixel recall. These metrics
are defined as follows:
𝐷𝑖𝑐𝑒 =
2∗|𝑀𝑎𝑠𝑘∩𝐺𝑇|
|
𝑀𝑎𝑠𝑘
|
+
|
𝐺𝑇
|
(1)
𝐽
𝑎𝑐𝑐𝑎𝑟𝑑 =
|𝑀𝑎𝑠𝑘 ∩ 𝐺𝑇|
|
𝑀𝑎𝑠𝑘 ∪ 𝐺𝑇
|
(2)
𝑃𝑟𝑒𝑐𝑖𝑠𝑖𝑜𝑛 =
|𝑀𝑎𝑠𝑘 ∩ 𝐺𝑇|
|
𝑀𝑎𝑠𝑘
|
(3)
𝑅𝑒𝑐𝑎𝑙𝑙 =
|𝑀𝑎𝑠𝑘 ∩ 𝐺𝑇|
|
𝐺𝑇
|
(4)
In all equations, Mask represents all pixels within
the tissue mask, GT represents all pixels within
manual annotation (ground truth), and || represents
cardinality, which is a sum of pixels in the specified
area.
3 RESULTS AND DISCUSSION
We created a pipeline for the segmentation of tissue
regions on whole slide images, that is composed of
two subsequent steps (Figure 1A): (i) initial image
segmentation to eliminate the background area of the
tissue slide; (ii) image and tissue mask post-
processing to refine initial segmentation and isolate
only relevant tissue fragments. We tested different
methods of thresholding, which estimate the
background cut-off values based on the analysis of
histograms of color intensities and DL-based models.
For the resulting images, we applied image
processing techniques used in computer vision which
are necessary to increase the quality of the tissue
segmentation by removing artifacts, and all other
noise components of the image (see example in
Figure 1B).
Post-Processing of Thresholding or Deep Learning Methods for Enhanced Tissue Segmentation of Whole-Slide Histopathological Images
231
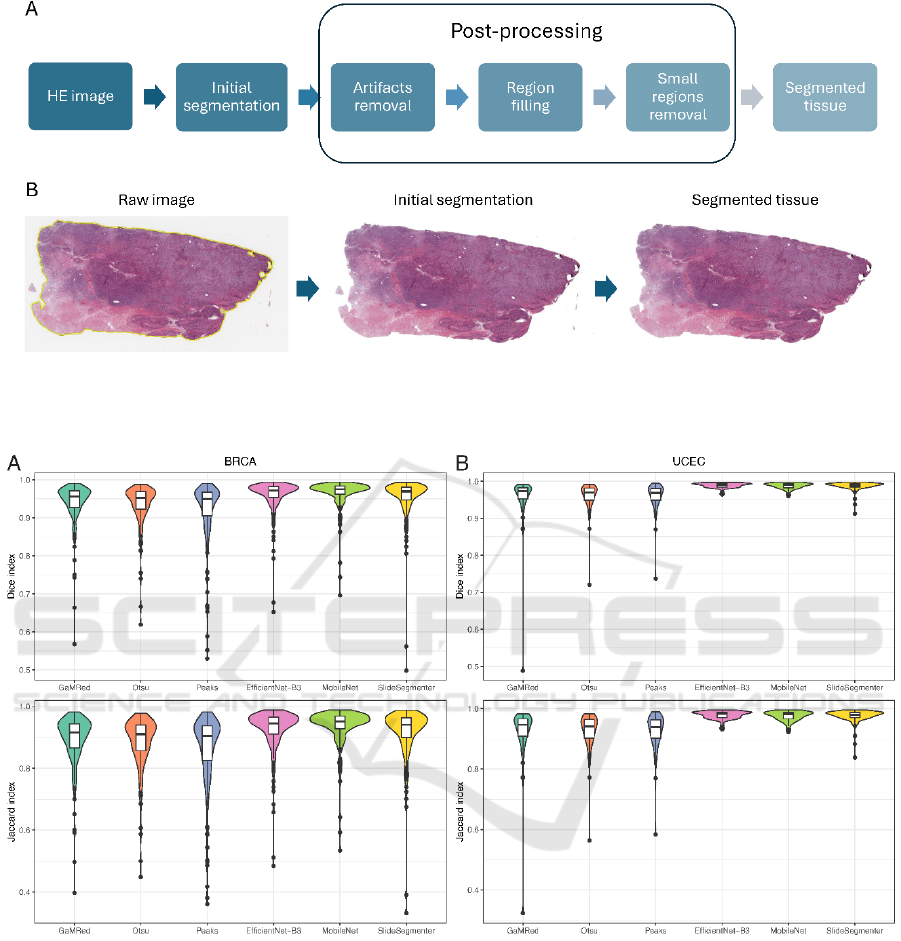
Figure 1: Proposed tissue segmentation algorithm including post-processing step. A) Subsequent steps of the full pipeline. B)
Exemplary results of applying the algorithm to the HE image: from raw image (left), through initial tissue segmentation
(middle) to segmented tissue after post-processing step (right).
Figure 2: Comparison of tissue segmentation performance between initial segmentation methods (without post-processing)
using Dice and Jaccard indices for BRCA (A) and UCEC (B) cohorts.
3.1 Initial Segmentation of WSIs
We compared three thresholding methods with three
different DL-based methods using Dice and Jaccard
indices and precision and recall metrics (Figure 2).
Overall, DL-based methods gave better results than
traditional methods on both datasets (Table 1).
Among thresholding methods, we observed the
highest values for GaMRed (median Dice = 0.9556 in
BRCA and 0.9725 in UCEC; median Jaccard =
0.9149 in BRCA and 0.9464 in UCEC) while the
lowest for the Peaks method. Among DL-based
method, we observed the highest values for
MobileNet in BRCA (median Dice = 0.9749; median
Jaccard = 0.9511) and EfficientNet-B3 in UCEC
(median Dice = 0.9913; median Jaccard = 0.9827).
Also, DL-based methods gave higher minimum
values of indices than thresholding methods,
especially in UCEC (Figure 2B).
BIOIMAGING 2025 - 12th International Conference on Bioimaging
232
GT
GaMRed
Otsu
Peaks
EfficientNet-
B3
Mobile
Net
Slide
Segmenter
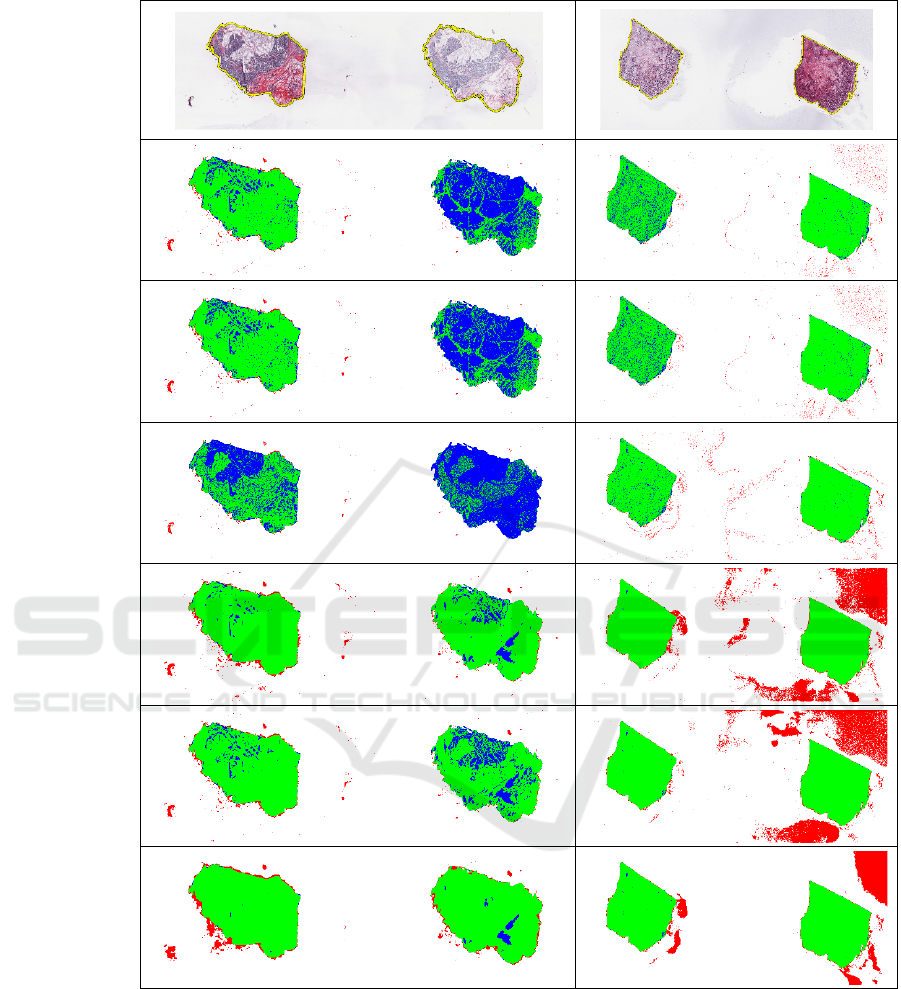
Figure 3: Selected cases with poor initial segmentation (no post-processing). GT is a ground truth segmentation (yellow line
around tissue). For each method, the green color indicates true positive, blue false negative, and red false positive regions.
On average, thresholding methods gave higher
precision than DL-based methods, but lower recall
(Table 1). We found the best precision for Peaks
(median = 0.9793 in BRCA and 0.9976 in UCEC)
while the worst for SlideSegmenter (median = 0.9461
in BRCA and 0.9933 in UCEC). On the opposite, the
best recall was for Slide Segmenter in BRCA (median
= 0.9970) and EfficientNet-B3 in UCEC (median =
0.9902). The worst recall was for the Peaks method
(median = 0.9193 in BRCA and 0.9437 in UCEC).
In Figure 3, we visualized the worst-case WSI for
thresholding methods (left), and DL-based methods
(right) in terms of Jaccard and Dice indices. For
thresholding methods, we observed mostly false
negative regions (colored blue), where the
segmentation algorithm omitted tissue regions
Post-Processing of Thresholding or Deep Learning Methods for Enhanced Tissue Segmentation of Whole-Slide Histopathological Images
233
selected by the expert giving lower recall. However,
in the original images, excluded regions were mostly
composed of adipose tissue, which is not relevant in
many digital pathology tasks. For the DL-based
method, we observed mostly false positive regions
(colored red), where the segmentation algorithm
marked a larger area than the expert giving lower
precision.
A closer investigation of ground truth images
shows that areas with noise or artifacts were wrongly
selected as tissue regions by DL-based methods,
which might bring worse consequences in further
analysis.
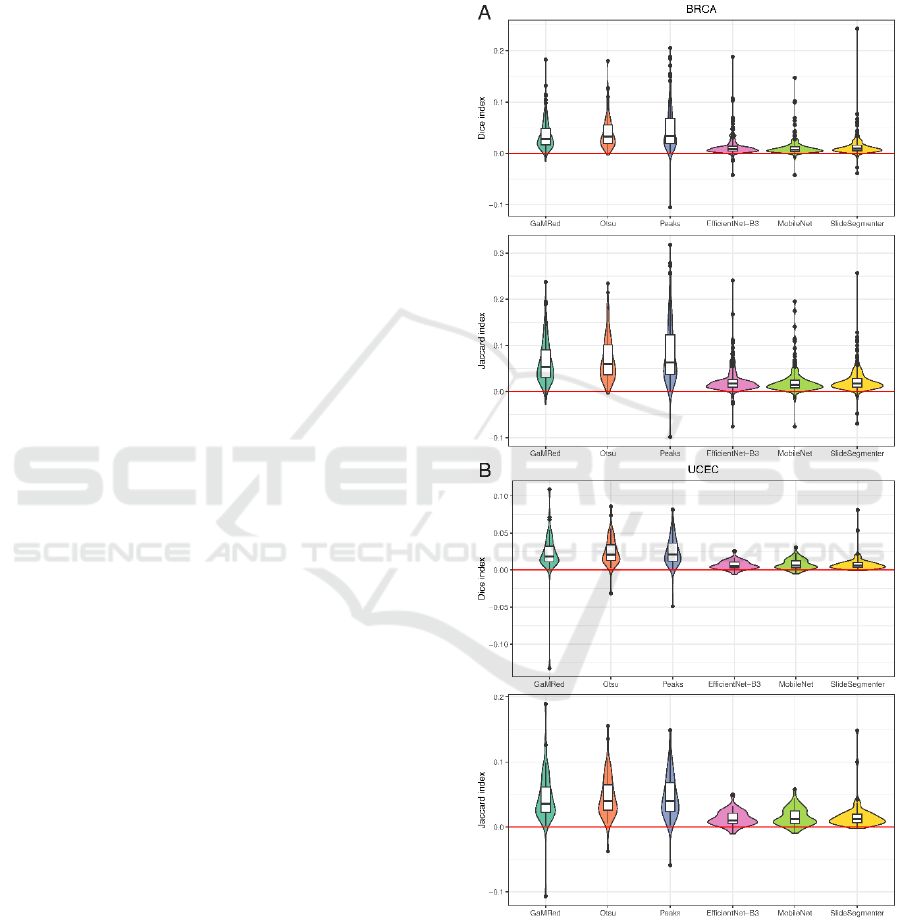
3.2 Influence of Post-Processing on
Tissue Segmentation Results
For both datasets and each initial segmentation
method, we found a significant increase in almost all
performance metrics (p-value from Wilcoxon test
smaller than 0.05) after applying the post-processing
step (Figure 4 and Tables 1 and 2). Only for
EfficientNet-B3 and Slide Segmenter, there was a
small decrease in recall in the BRCA dataset (median
equal to -0.0001 and -0.0003, respectively).
In terms of Dice and Jaccard indices, a higher gain
was observed for thresholding methods than DL-
based methods in both datasets, which leads to a
similar final performance for all methods (Table 1).
Among unsupervised methods, after post-processing,
we observed the highest values for GaMRed (median
Dice = 0.9865 in BRCA and 0.9941 in UCEC; median
Jaccard = 0.9733 in BRCA and 0.9883 in UCEC)
while the lowest for the Peaks method. Among DL-
based methods, the results are similar giving U-Net-
based methods better than Slide Segmenter. Even
after post-processing, thresholding methods gave
higher precision and lower recall than DL-based
methods, but the difference between them is now
smaller. Again, we found the best precision for Peaks
(median = 0.9923 in BRCA and 0.997 in UCEC)
while the worst for Slide Segmenter (median = 0.9657
in BRCA and 0.9964 in UCEC). The best recall was
found for Slide Segmenter in BRCA (median =
0.9971) and EfficientNet-B3 in UCEC (median =
0.9976) and the worst for the Peaks method (median
= 0.9836 in BRCA and 0.9881 in UCEC).
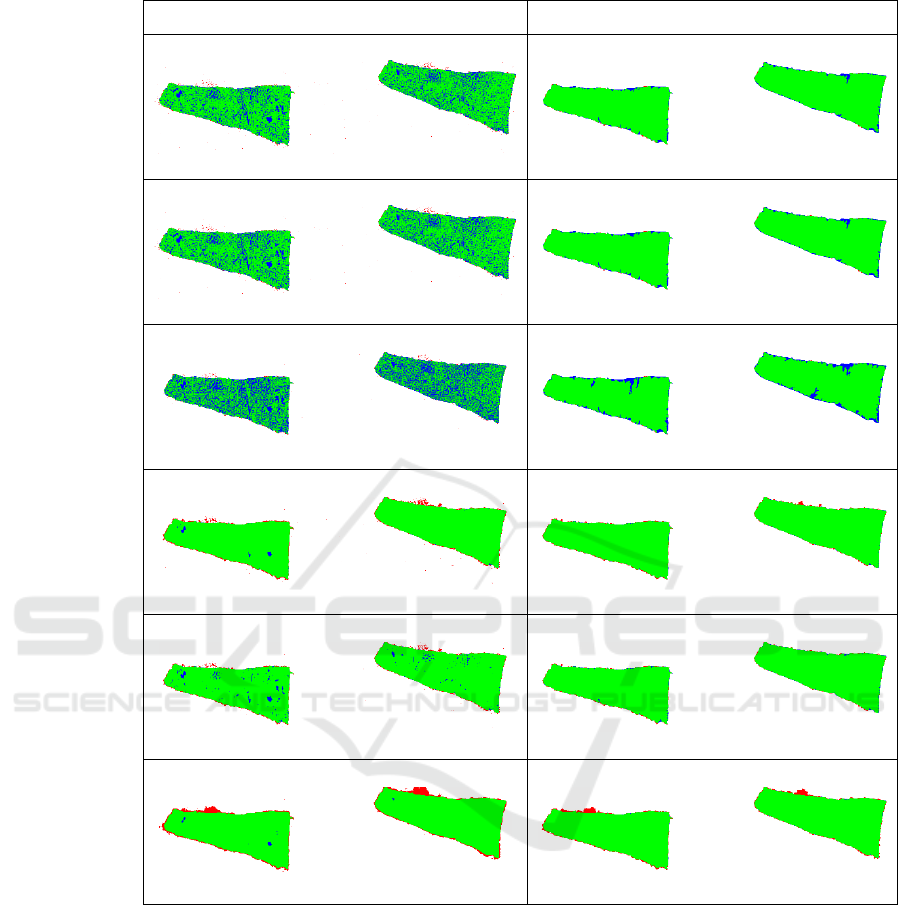
In Figures 5 and 6, we visualized selected WSI,
for which the number of false positive and false
negative pixels is significantly reduced after post-
processing for each initial segmentation method. The
selected image from BRCA (Figure 5) contains a lot
of small holes in the tissue, which caused poor
segmentation with thresholding methods. The
selected image from UCEC (Figure 6) contains a blue
pen marking, that was segmented as tissue mostly for
DL-based methods. Also, grey shades below the
tissue were falsely marked by Slide Segmenter. All
these mistakes were reduced by applying proposed
post-processing method.
Figure 4: Gain in tissue segmentation performance of
different initial segmentation methods after applying post-
processing measured using Dice and Jaccard indices for
BRCA (A) and UCEC (B) cohorts.
BIOIMAGING 2025 - 12th International Conference on Bioimaging
234
No post-processing After post-processing
GaMRed
Otsu
Peaks
EfficientNet
-B3
Mobile
Net
Slide
Segmenter
Figure 5: Selected case from BRCA dataset with high gain in performance after post-processing (right). . For each method,
the green color indicates true positive, blue false negative, and red false positive regions.
Post-Processing of Thresholding or Deep Learning Methods for Enhanced Tissue Segmentation of Whole-Slide Histopathological Images
235
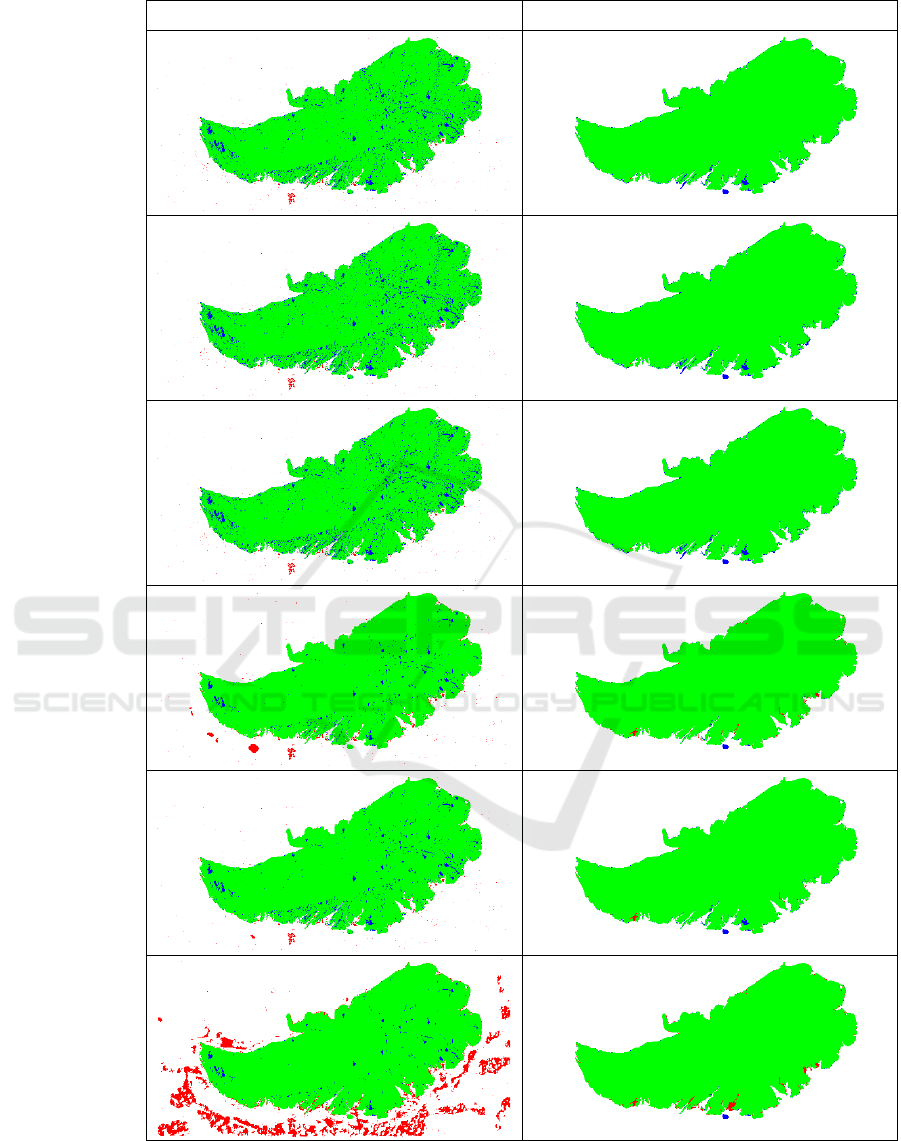
No post-processing After post-processing
GaMRed
Otsu
Peaks
EfficientNet-
B3
Mobile
Net
Slide
Segmenter
Figure 6: Selected case from UCEC dataset with high gain in performance after post-processing (right). For each method, the
green color indicates true positive, blue false negative, and red false positive regions.
BIOIMAGING 2025 - 12th International Conference on Bioimaging
236

Table 1: Median values of performance indices across all images for each dataset and initial segmentation method. Results
before and after post-processing are shown. Bold highlights the best value of each index within the dataset and pipeline step.
Dataset Step Method Dice Jaccard Precision Recall
BRCA
Initial
segmentation
GaMRe
d
0.9556 0.9149 0.9736 0.9449
Otsu 0.9528 0.9099 0.9759 0.9316
Peaks 0.9498 0.9043 0.9793 0.9193
EfficientNet-B3 0.9719 0.9454 0.9511 0.9961
MobileNet 0.9749 0.9511 0.9604 0.9936
SlideSegmente
r
0.9692 0.9403 0.9461 0.9970
Post-processed
GaMRe
d
0.9865 0.9733 0.9901 0.9862
Otsu 0.9859 0.9723 0.9910 0.9848
Peaks 0.9857 0.9719 0.9923 0.9836
EfficientNet-B3 0.9833 0.9671 0.9711 0.9965
MobileNet 0.9856 0.9715 0.9767 0.9955
SlideSegmente
r
0.9798 0.9603 0.9657 0.9971
UCEC
Initial
segmentation
GaMRe
d
0.9725 0.9464 0.9974 0.9487
Otsu 0.9697 0.9411 0.9974 0.9437
Peaks 0.9681 0.9382 0.9976 0.9437
EfficientNet-B3 0.9913 0.9827 0.9935 0.9902
MobileNet 0.9905 0.9812 0.9950 0.9870
SlideSegmente
r
0.9898 0.9798 0.9933 0.9893
Post-processed
GaMRe
d
0.9941 0.9883 0.9997 0.9891
Otsu 0.9936 0.9872 0.9997 0.9885
Peaks 0.9938 0.9878 0.9997 0.9881
EfficientNet-B3 0.9967 0.9935 0.9968 0.9976
MobileNet 0.9970 0.9940 0.9977 0.9961
SlideSegmente
r
0.9966 0.9932 0.9964 0.9975
Table 2: Gain in performance indices across all images for each dataset and initial segmentation method. Results show the
median difference of results after post-processing and initial segmentation. Bold highlights the best value of each index within
the dataset.
Dataset Method Dice Jaccard Precision Recall
BRCA
GaMRe
d
0.0281 0.0532 0.0121 0.0389
Otsu 0.0322 0.0601 0.0105 0.0476
Peaks 0.0341 0.0632 0.0097 0.0541
EfficientNet-B3 0.0088 0.0171 0.0158 -0.0001
MobileNet 0.0076 0.0148 0.0115 0.0006
SlideSe
g
mente
r
0.0091 0.0171 0.0164 -0.0003
UCEC
GaMRe
d
0.0183 0.0357 0.0022 0.0333
Otsu 0.0206 0.0400 0.0022 0.0386
Peaks 0.0209 0.0402 0.0020 0.0385
EfficientNet-B3 0.0052 0.0102 0.0025 0.0080
MobileNet 0.0059 0.0117 0.0021 0.0095
SlideSe
g
mente
r
0.0061 0.0121 0.0027 0.0083
3.3 Ablation Study
Lastly, we tested the influence of subsequent post-
processing methods on the performance of the
proposed tissue segmentation pipeline. For each
initial segmentation algorithm, we observed similar
patterns of changes in the Dice and Jaccard indices
(Figure 7). The highest increase was obtained after
artifact removal together with region filling (IS+P12;
3% on average), and then a small increase was found
after filtering too small regions (IS+P123) in BRCA,
but not in UCEC, where only DL-based methods
showed a small increase. Artifact removal alone had
the smallest influence on tissue segmentation
performance. For DL-based methods, we even
observed a small decrease in the Dice index mostly in
UCEC. However, we noticed that without this step
region filling and small regions removal steps gave
much worse results.
Post-Processing of Thresholding or Deep Learning Methods for Enhanced Tissue Segmentation of Whole-Slide Histopathological Images
237
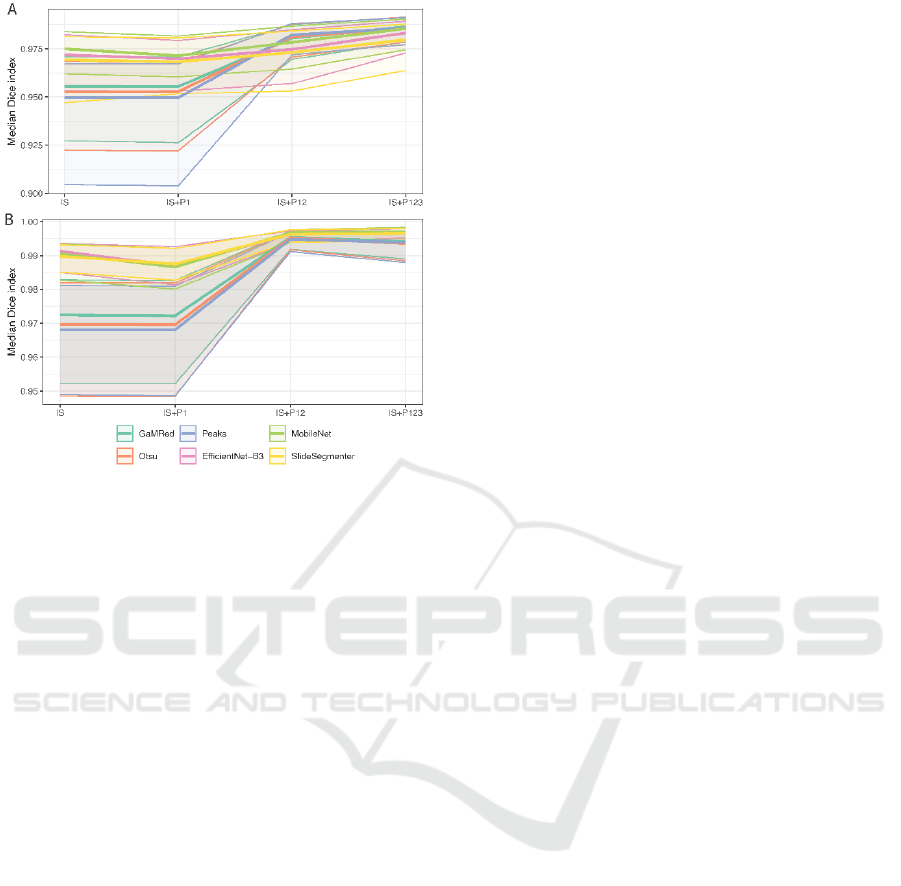
Figure 7: Tissue segmentation results after subsequent steps
of the tissue segmentation in BRCA (A) and UCEC (B). IS
represents the initial segmentation step, while P123 artifacts
removal, region filling, and small regions removal.
4 CONCLUSIONS
Segmentation of tissue regions on whole-slide images
is an important first step in the advanced computational
analysis of stained histopathological slides. We
developed a post-processing algorithm that was
successfully applied to simple image thresholding
methods and more advanced DL-based models. Our
analysis proved that the proposed tissue segmentation
pipeline is robust to noise and different artifacts
observed in the sample, and it can consistently acquire
better results than initial segmentation alone.
Regardless of a small improvement in performance
indices, we visualized some cases to provide visual
proof of post-processing necessity. Lastly, all
parameters of the proposed method were selected on
other, unseen data (but scanned with the same
magnification), and fixed during analysis. Thus, there
is a potential to improve the results even more through
the parameter tuning procedure.
ACKNOWLEDGMENTS
This publication was supported by the Excellence
Initiative - Research University program imple-
mented at the Silesian University of Technology,
grant no. 02/070/SDU/10-21-02 (MM), COMPASS-
NMD Project funded by the European Union Horizon
Europe program under Grant Agreement 101080874
(JP) and Silesian University of Technology grant no.
02/070/BK_24/0052 for maintaining and developing
research potential.
REFERENCES
Cooper, L.A., Demicco, E.G., Saltz, J.H., Powell, R.T., Rao,
A., Lazar, A.J.: PanCancer insights from The Cancer
Genome Atlas: the pathologist's perspective. The Journal
of pathology 244, 512-524 (2018)
Serag, A., Ion-Margineanu, A., Qureshi, H., McMillan, R.,
Saint Martin, M.-J., Diamond, J., O'Reilly, P., Hamilton,
P.: Translational AI and deep learning in diagnostic
pathology. Frontiers in medicine 6, 185 (2019)
Salvi, M., Acharya, U.R., Molinari, F., Meiburger, K.M.: The
impact of pre-and post-image processing techniques on
deep learning frameworks: A comprehensive review for
digital pathology image analysis. Computers in Biology
and Medicine 128, 104129 (2021)
Alomari, R.S., Allen, R., Sabata, B., Chaudhary, V.:
Localization of tissues in high-resolution digital
anatomic pathology images. In: Medical Imaging 2009:
Computer-Aided Diagnosis, pp. 349-358. SPIE
Song, Y., Cisternino, F., Mekke, J.M., de Borst, G.J., de
Kleijn, D.P., Pasterkamp, G., Vink, A., Glastonbury,
C.A., van der Laan, S.W., Miller, C.L.: An automatic
entropy method to efficiently mask histology whole-slide
images. Scientific Reports 13, 4321 (2023)
Riasatian, A., Rasoolijaberi, M., Babaei, M., Tizhoosh, H.R.:
A comparative study of U-net topologies for background
removal in histopathology images. In: 2020 International
Joint Conference on Neural Networks (IJCNN), pp. 1-8.
IEEE
Lucassen, R.T., Blokx, W.A., Veta, M.: Tissue Cross-Section
and Pen Marking Segmentation in Whole Slide Images.
arXiv preprint arXiv:2401.13511 (2024)
Clark, K., Vendt, B., Smith, K., Freymann, J., Kirby, J.,
Koppel, P., Moore, S., Phil-lips, S., Maffitt, D., Pringle,
M., Tarbox, L., Prior, F.: The Cancer Imaging Archive
(TCIA): Maintaining and Operating a Public Information
Repository. Journal of Digital Imaging 26, 1045-1057
(2013)
Marczyk, M., Jaksik, R., Polanski, A., Polanska, J.:
GaMRed—Adaptive Filtering of High-Throughput
Biological Data. IEEE/ACM Transactions on
Computational Biology and Bioinformatics 17, 149-157
(2020)
Otsu, N.: A Threshold Selection Method from Gray-Level
Histograms. IEEE Transactions on Systems, Man, and
Cybernetics 9, 62-66 (1979)
Marczyk, M., Polanska, J., Polanski, A.: Improving peak
detection by Gaussian mixture modeling of mass spectral
signal. In: 2017 3rd International Conference on
Frontiers of Signal Processing (ICFSP), pp. 39-43. IEEE
BIOIMAGING 2025 - 12th International Conference on Bioimaging
238
