
Healful Dataset: Integrating Wearable Data with Self-Reported
Quality of Life Assessments
Pedro Almir M. Oliveira
1,2 a
, Rossana M. C. Andrade
2 b
, Pedro A. Santos Neto
3 c
,
Evilasio Costa Junior
2,5 d
, Ismayle S. Santos
2,4 e
, Victoria T. Oliveira
2 f
,
Wilson Castro
2 g
and Leonan Carneiro
2 h
1
Laboratory of Innovation and Scientific Computing (LICC), Federal Institute of Maranh
˜
ao, Pedreiras, Brazil
2
Group of Computer Networks, Software Engineering, and Systems (GREat), Federal University of Cear
´
a (UFC),
Fortaleza, Brazil
3
Laboratory of Software Optimization and Testing (LOST), Federal University of Piau
´
ı, Teresina, Brazil
4
Cear
´
a State University (UECE), Fortaleza, Brazil
5
Federal University of Cear
´
a (UFC), Sobral, Brazil
{victoria.oliveira, wilson.castro, leonan.carneiro}@great.ufc.br
Keywords:
Quality of Life, Self-Reported Questionnaires, Internet of Health Things, Dataset.
Abstract:
This paper proposes a novel dataset – called Healful Dataset – correlating real data acquired from wearable
health-tracking devices with Self-reported Quality of Life (SRQoL) measures collected using the WHOQOL-
BREF questionnaire. Recently, increasing interest has been shown in using technology for Quality of Life
(QoL) monitoring and improvement, significantly leveraging the Internet of Health Things (IoHT). Although
several tools have been developed to quantify QoL, such as the SF-36 and WHOQOL-BREF, most are based on
static and bothersome questionnaires rather than ubiquitous real-time data collection. Our database addresses
this gap by integrating sensor-generated data with QoL assessment, enhancing the research path focused on
intelligent models for QoL monitoring that use Machine Learning techniques to predict and improve QoL. In
this paper, we describe the methodology used to build this database, the scenarios in which it can be applied,
and discuss its relevance for future IoHT-driven health solutions toward improving people’s QoL through
personalized monitoring and interventions.
1 INTRODUCTION
As a consequence of the increasing phenomenon
of population aging in several countries in recent
decades (Robbins et al., 2018) with the increasing
interest in using technology allied to health (WHO,
2016), we have observed the growth of studies that
propose solutions for monitoring and improving many
aspects of Quality of Life (QoL). According to the
World Health Organization (WHO), Quality of Life is
a
https://orcid.org/0000-0002-3067-3076
b
https://orcid.org/0000-0002-0186-2994
c
https://orcid.org/0000-0002-1554-8445
d
https://orcid.org/0000-0002-0281-2964
e
https://orcid.org/0000-0001-5580-643X
f
https://orcid.org/0000-0002-1400-522X
g
https://orcid.org/0009-0007-4753-9926
h
https://orcid.org/0009-0002-0334-7598
“the individual’s perception of life in the context of the
culture and value systems in which he/she lives and
about his/her goals, expectations, standards, and con-
cerns” (Orley and Kuyken, 1994). Therefore, Qual-
ity of Life is directly related to health, and measuring
its level can provide valuable information for medi-
cal practice (Estrada-Galinanes and Wac, 2018; Mate,
2022).
We have also witnessed a growing interest in com-
putational technologies to develop health applications
and QoL monitoring (Zeadally et al., 2020; Oliveira
et al., 2022a; Oliveira et al., 2022b). In line with
this trend, the use of computational devices capable of
collecting real-time data has gained strength, enabling
the identification of various aspects of a person’s
health (Peimankar et al., 2023; Magno et al., 2018;
Oliveira et al., 2022c). These devices – capable of
collecting data and transferring information through
Oliveira, P. A. M., Andrade, R. M. C., Neto, P. A. S., Costa Junior, E., Santos, I. S., Oliveira, V. T., Castro, W. and Carneiro, L.
Healful Dataset: Integrating Wearable Data with Self-Reported Quality of Life Assessments.
DOI: 10.5220/0013175200003911
Paper published under CC license (CC BY-NC-ND 4.0)
In Proceedings of the 18th International Joint Conference on Biomedical Engineering Systems and Technologies (BIOSTEC 2025) - Volume 2: HEALTHINF, pages 611-622
ISBN: 978-989-758-731-3; ISSN: 2184-4305
Proceedings Copyright © 2025 by SCITEPRESS – Science and Technology Publications, Lda.
611

the Internet – are part of the Internet of Things (Sund-
maeker et al., 2020), which, when applied to health, is
called the Internet of Health Things (Rodrigues et al.,
2018).
To develop Internet of Health Things solutions fo-
cused on monitoring, measuring, and improving peo-
ple’s Quality of Life, it is essential to first understand
how QoL can be assessed. Over the past decades,
many mechanisms to evaluate people’s QoL have
been proposed. For example, SF-36 (Ware Jr, 1999),
KIDSCREEN-52 (Ravens-Sieberer et al., 2005), EQ-
SD (Rabin and Charro, 2001), and many others (Aday
and Cornelius, 2006). However, most of these mech-
anisms are based on questionnaires.
Despite solid medical knowledge on measuring
people’s QoL using them, the continuous application
of this kind of questionnaire is tedious, bothersome
(Sanchez et al., 2015) (Oliveira et al., 2022b), and can
also include a bias as the patient needs to actively pro-
vide data, making it challenging to ensure consistent
patient adherence (Hao et al., 2017).
Recently, some studies have proposed IoHT solu-
tions for measuring QoL, especially using Machine
Learning models (Abdulmalek et al., 2022; Oliveira
et al., 2023a). However, this kind of solution requires
an appropriate database to train these models effec-
tively and analyze QoL indicators. To the best of our
knowledge, there are no public databases focused on
this purpose, containing data produced from wearable
devices and correlated with Self-reported Quality of
Life Questionnaires.
In light of this scenario, we present a novel dataset
that correlates Health Tracking Features with SRQoL
(Sj
¨
ogren’s Related Quality of Life) (Marvel et al.,
2024). This database
1
– called Healful dataset – was
designed to enable the training of intelligent models
for inferring QoL.
In this paper, we introduce the Healful dataset and
present more in Section 4. We also describe how this
database was built (Section 3) and can be used (Sec-
tion 5). Additionally, we discuss related work (Sec-
tion 2) and explore how sensor databases can support
the development of new Internet of Health Things so-
lutions for monitoring and enhancing people’s Qual-
ity of Life (Section 6).
2 RELATED WORK
Many public datasets with IoT data focused on health
applications have been proposed recently. Some of
1
Although the literature presents distinct definitions for
the terms dataset and database, this paper uses these terms
as synonyms to avoid tiresome repetitions of the same term.
them focus on movement data or daily activities (Hen-
riksen et al., 2022; Galdino et al., 2023). Others fo-
cus on cardiac data (Biswas and Ashili, 2023; Sinha,
2023), and some combine different data types, includ-
ing movement, cardiac, and respiratory data (Raghu-
nath, 2024; Dutta and Puthal, 2023).
(Henriksen et al., 2022) presents a dataset con-
taining data from 423 wearable devices collected be-
tween May and July 2017. The goal was to build a
dataset with diverse data for characterizing physical
activities. Twelve attributes were collected: wearable
name, company/brand name, release year, country of
origin, whether the wearable was crowd-funded, form
factor (fitness tracker or smartwatch), and the sen-
sors supported. Their dataset mapped the following
sensors: accelerometer, magnetometer, gyroscope, al-
timeter or barometer, global positioning system, and
optical pulse sensor (i.e., photoplethysmography).
(Galdino et al., 2023) presents a dataset with loca-
tion data generated based on WiFi Channel State In-
formation (CSI) sensors for monitoring physical ac-
tivities. The data were collected through an experi-
ment with 118 participants, 88 men and 30 women,
who performed several routines divided into 17 dif-
ferent activities.
The dataset proposed by (Biswas and Ashili,
2023) contains heart rate data from a 48-year-old vol-
unteer of Asian descent collected over several days
through a smartwatch. Sinha (Sinha, 2023) presents
a dataset of wearable devices containing information
for analyzing heart rate and pulse variation in several
volunteer patients.
(Raghunath, 2024), in turn, presents a dataset with
extensive health-related data gathered from remote
monitoring systems between June 4, 2023, and Octo-
ber 4, 2023. This dataset comprises 10,000 examples
containing data on heart rate (bpm), blood pressure
(systolic/diastolic mmHg), respiratory rate (breaths
per minute), body temperature (°C), blood oxygen
level (SpO2), and glucose level (mg/dL). According
to the author, these parameters are fundamental indi-
cators for understanding individuals’ health and phys-
iological status.
(Dutta and Puthal, 2023) also presents a dataset
created based on experiments with two volunteers
containing 120,000 data instances. Each instance
contains data on the following features: pulse rate,
breathing rate, distance traveled, speed, and oxygen
level. Their dataset goal is to support the training of
intelligent models for IoT solutions.
Table 1 compares our proposed dataset and those
from related works. The latter datasets are gener-
ally not explicitly focused on Quality of Life moni-
toring. Nevertheless, their information can be used to
HEALTHINF 2025 - 18th International Conference on Health Informatics
612
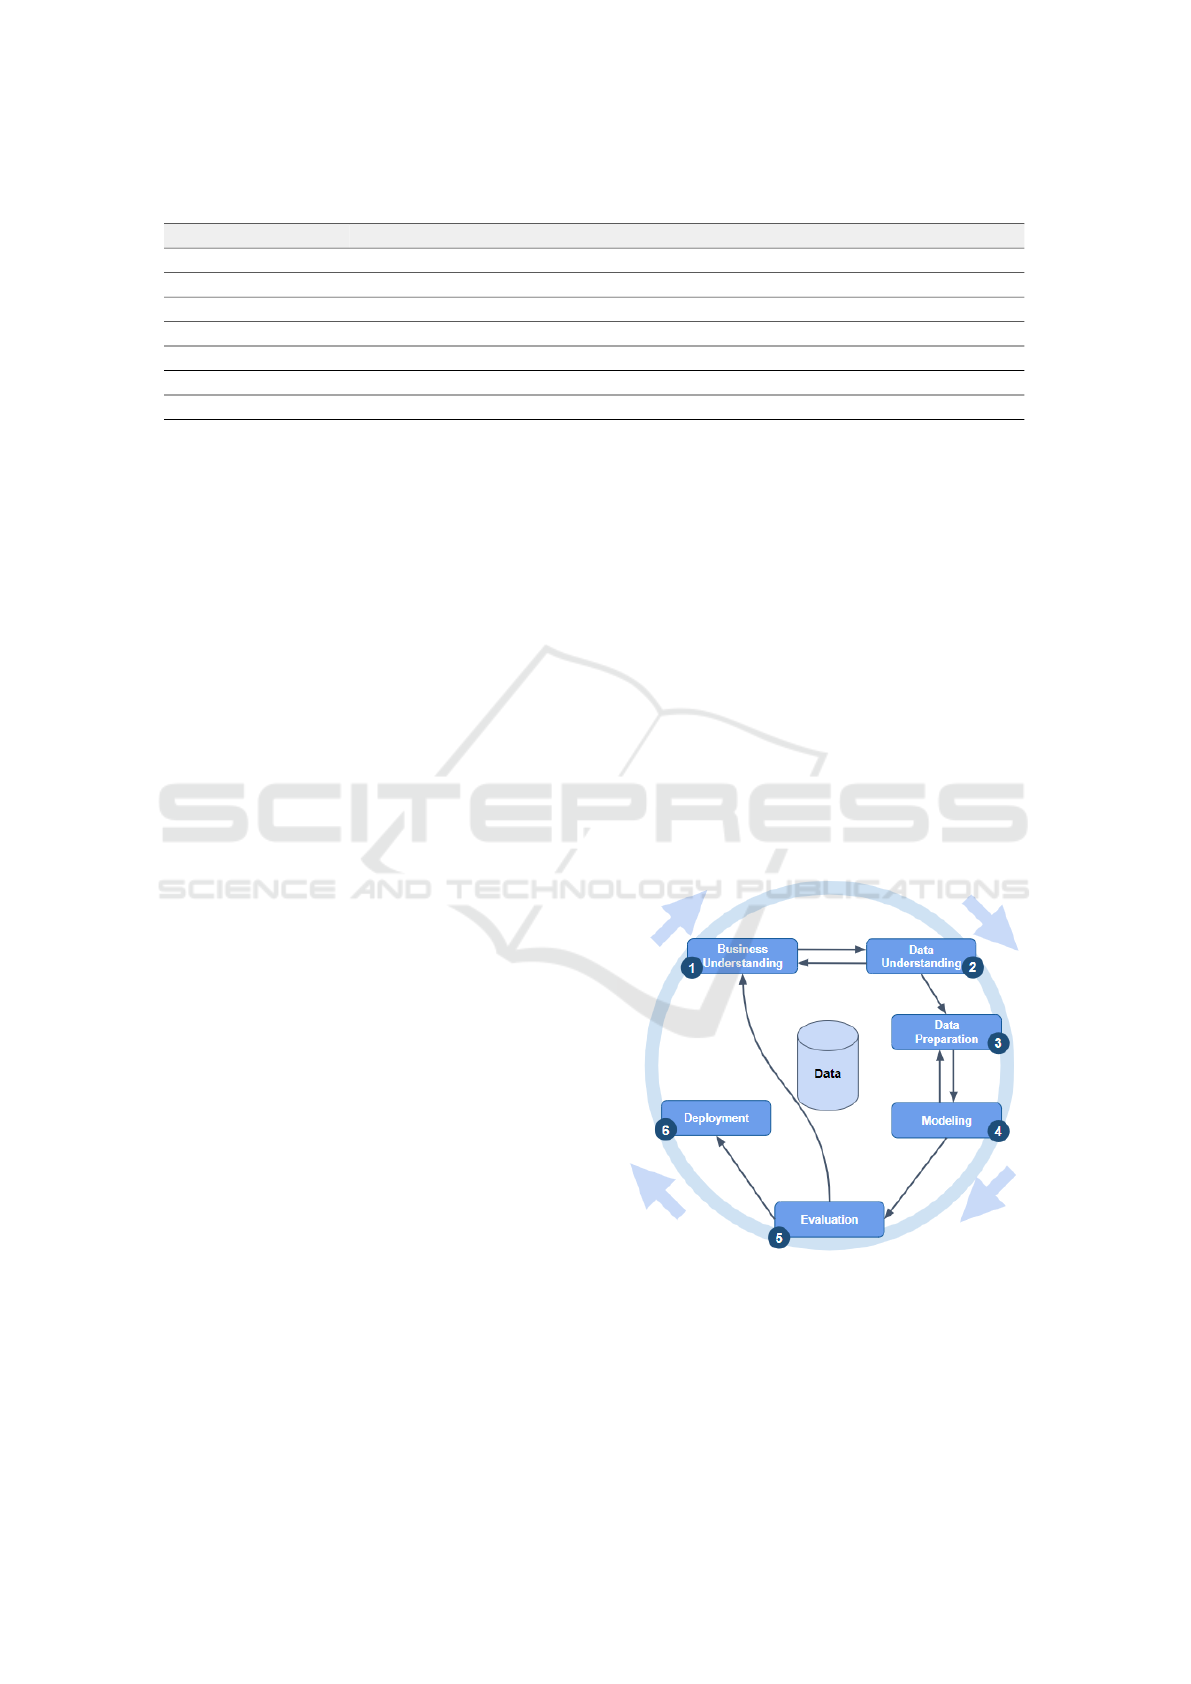
Table 1: Comparison between our proposal and the related works.
Work Number of Participants Technology used to collect data Main Objective
(Henriksen et al., 2022) 423 participants Wearables Characterize Physical Activities
(Galdino et al., 2023) 118 participants WiFi CSI Motion analysis based on Location
(Biswas and Ashili, 2023) 1 participant Wearables Heart Rate Analysis
(Sinha, 2023) Unidentified Wearables Heart Rate Analysis
(Raghunath, 2024) Unidentified Multiple Embedded Sensors Heart Rate Analysis
(Dutta and Puthal, 2023) 2 participants Wearables and Environment Sensors Support ML Models for IoT Apps
Our work 44 participants Smartphone and Wearables QoL Analysis
train and evaluate intelligent models for QoL with the
appropriate adjustments. The key distinction of our
dataset lies in its adaptation for monitoring patients’
QoL, using a WHO questionnaire as a reference. Our
dataset contains information on physical activity data,
as found in (Henriksen et al., 2022) (Galdino et al.,
2023), heart rate data similar to (Biswas and Ashili,
2023; Sinha, 2023), and additional information such
as sleep quality and the frequency of smart mobile
app usage. Furthermore, like the datasets proposed
in (Raghunath, 2024; Dutta and Puthal, 2023) and
(Biswas and Ashili, 2023), our study collected wear-
able device data from subjects over several days. It
is worth noting that we also collected other data from
the volunteers’ smartphones and that all collected data
was anonymized.
3 METHODOLOGY
According to the International Society for Quality of
Life Research (ISOQOL), research into Quality of
Life can make a significant contribution to improving
health programs and helping policymakers allocate
resources more efficiently. For this reason, Quality of
Life has attracted the attention of many researchers.
However, as pointed out in (Banaee et al., 2013) and
(Oliveira et al., 2023a), there is still a need to de-
velop less intrusive methods. Therefore, this study
opted to use commercial wearable devices to collect
users’ health data more discreetly and conveniently,
as well as Self-Reported questionnaires to correlate
health measures with QoL indicators.
Furthermore, the CRoss Industry Standard Pro-
cess for Data Mining (CRISP-DM) (Wirth and Hipp,
2000) was used as a reference methodology to cre-
ate the Healful dataset. This methodology offers a
robust framework for data mining projects, consisting
of well-defined phases that guide the process from un-
derstanding the business objectives to implementing
and evaluating the results.
Additionally, it was developed to support re-
searchers and professionals in carrying out data min-
ing projects. This is because it provides a compre-
hensive, technology-independent process model that
offers structure and flexibility to experienced and less
qualified professionals (Wirth and Hipp, 2000). In
this way, it has become an industry standard, guid-
ing the application of data mining techniques across
various sectors (Nodeh et al., 2020; Schneider et al.,
2023; Durango Vanegas et al., 2023).
In addition to the previously mentioned character-
istics, it was also chosen because of the possibility
of an iterative approach, which allows for continu-
ous process refinement and the generation of artifacts
ready for implementation. As illustrated in Figure 1,
the CRISP-DM methodology is composed of six se-
quential phases: Business Understanding, Data Un-
derstanding, Data Preparation, Modeling, Evaluation,
and Deployment (Wirth and Hipp, 2000; Nodeh et al.,
2020).
Figure 1: CRoss Industry Standard Process for Data Min-
ing.
The CRISP-DM process has six steps. The first
step – Business Understanding – focuses on under-
standing the goals and particularities of the target
project. The second step – Data Understanding – in-
volves the initial search for data to become familiar
Healful Dataset: Integrating Wearable Data with Self-Reported Quality of Life Assessments
613
Federal University of Ceara
Fortaleza, Ceara, Brazil
GREat laboratory
1
Google Fit
Data Sync
User
Daily Activities
Ubiquitous Monitoring
Daily
QoL Monitor
Data Extraction
Data
Anonymizatio
n
Convert data
to JSON
Cipher with
AES-256
Cipher with
RSA
QoL Monitor
Collect User’s Answers
Weekly
User
Questionnaire
Remainder
1 2
3
5
6
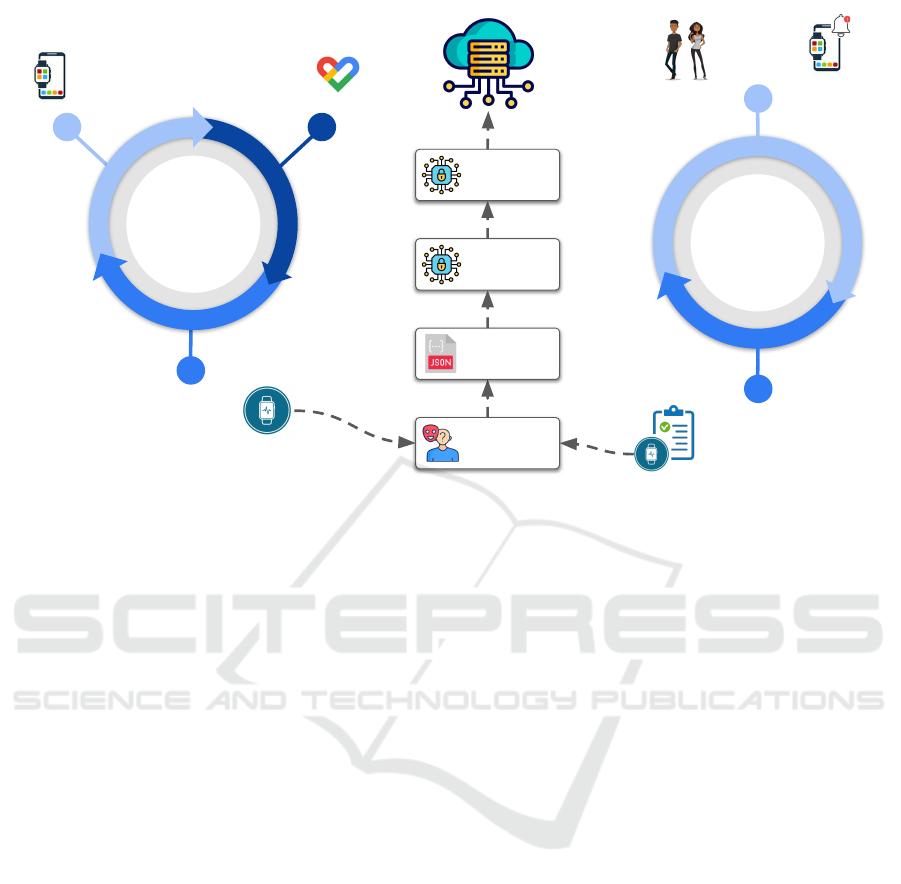
Figure 2: Data flow to collect health measures and self-reported QoL questionnaires.
with it. The first two steps are closely related because
understanding the business requires initial data, and
this initial analysis of data can impact project goals.
The third step – Data Preparation – encloses activities
related to the dataset construction, such as attribute
selection, data cleaning, building new attributes, and
data transformation. In the fourth step – Modeling
– a set of Machine Learning algorithms is selected
to build intelligent models. The fifth step – Evalu-
ation – uses statistical tests to identify the models’
performance. The final phase, deployment, involves
implementing the model in a real-world setting. This
can include deploying the model to production, creat-
ing reports, or developing tools for end-users. It also
involves planning for ongoing maintenance and up-
dates. Below we will detail more about business and
data understanding.
3.1 Business and Data Understanding
As mentioned above, the first stage of CRISP-DM
is to understand the business, which in this case is
the Internet of Things applied to Quality of Life.
This understanding was obtained by investigating the
IoT literature in a previous study, which provides a
broad understanding of the main issues when using
the IoHT applied to QoL (Oliveira et al., 2022b).
For the data understanding, initial studies ex-
plored how to collect health data in real-world settings
(Oliveira et al., 2022a) and reviewed existing datasets
that could support the project (Junior et al., 2022).
These studies identified challenges such as device het-
erogeneity, the lack of native APIs for wearables, and
the absence of public datasets linking health met-
rics with self-assessed QoL questionnaires. To ad-
dress these challenges, a mobile app – QoL Monitor
(Oliveira et al., 2022c) – was developed. The app re-
trieves health data from “Health & Fitness Data Con-
tainers” (with Google Fit chosen for its more straight-
forward data integration) and correlates it with the
Quality of Life questionnaires.
The questionnaire chosen to assess QoL was the
WHOQOL-BREF questionnaire (Skevington et al.,
2004). The WHOQOL-BREF is an abbreviated ver-
sion of the World Health Organization’s Quality of
Life assessment. It is designed to measure an individ-
ual’s perception of their well-being across four key
domains: physical, psychological, social, and envi-
ronmental. It is one of the most widely used instru-
ments for evaluating quality of life due to its reliabil-
ity and cultural adaptability. The WHOQOL-BREF
has been validated in 23 countries and is available
in 19 languages, making it suitable for cross-cultural
research (Skevington et al., 2004). The psychologi-
cal domain relates to body image, negative and pos-
itive feelings, self-esteem, and other mental aspects.
The social domain observes social relationships, and
the environment domain aims to evaluate the environ-
mental facets.
Therefore, the WHOQOL-BREF questionnaire
was selected due to its validity and comprehensive-
ness in assessing various dimensions of well-being.
HEALTHINF 2025 - 18th International Conference on Health Informatics
614

Data collection through the WHOQOL-BREF ques-
tionnaire is essential, as it provides reference val-
ues for QoL variables, allowing supervised machine
learning to be applied. The subjective data provided
by the questionnaires is essential for labeling and
training machine learning models, while objective
data collected by wearable devices complement the
analysis. Combining these data provides a more com-
prehensive approach to assessing participants’ quality
of life and improves the accuracy of predictive mod-
els.
Figure 2 shows the data flow to create the data
set correlating health measures and self-reported QoL
questionnaires. Initially, the user had to connect their
wearables’ native app to synchronize the data with
the Google Fit platform, which was essential to deal
with the heterogeneity of the devices. Once the data
had been recorded in Google Fit, it could be ex-
tracted using Google Fit’s public API. The QoL Mon-
itor application collected this Google Fit data daily,
anonymized it, encrypted it (using the AES-256 and
RSA algorithms), and uploaded it to a cloud service.
In addition, the app asked the user to answer the QoL
questionnaire every week, and these answers were
stored along with the health data.
For data collection, participants were recruited
based on specific criteria: age between 18 and 65
years old, prior knowledge about using smartphones
and/or smartwatches, and availability for continuous
use of wearable devices. Participants were selected
by convenience, prioritizing those who already owned
a smart band or smartwatch, which helped to reduce
the acquisition costs of the devices.
The process was conducted in two phases. In the
first phase, 20 participants were recruited for a three-
month evaluation, which began on March 14, 2022,
and concluded on June 14, 2022. In the second phase,
24 additional participants were included in a three-
month evaluation period from October 10, 2022, to
January 10, 2023. Among these new participants,
eight were undergraduate students from the Federal
University of Cear
´
a (UFC) and 16 from the Federal
University of Piau
´
ı (UFPI). In total, 44 subjects par-
ticipated in the study.
In summary, as shown in Tables 2 and 3, the par-
ticipant profile consisted of 33 men and 11 women,
ranging from 19 to 47 years. Around 77% of par-
ticipants (34) were single, while 23% (10 individu-
als) were married. The majority identified themselves
as university students. Regarding income, 22 partic-
ipants reported earning between 0 and 1 minimum
wage
2
, and only one resided in a rural area. Regard-
2
For this collection, Brazilian minimum wage was con-
sidered to be R$1,100.00 reais.
ing family structure, most participants lived with one
or two other people in their households. Additionally,
there were two significant groups regarding the num-
ber of children: 35 participants had no children, and
9 participants had one or two children.
Table 2: Participants’ profile (part 1).
Category Attribute Percentage (%)
Gender Female 25.00
Male 75.00
Age 18-29 70.45
30-39 25.00
40-49 4.55
Marital Status Single 77.27
Married 22.73
Children None 79.55
1 to 2 20.45
Educational Level Secondary 22.73
Undergraduate 47.73
Graduate 29.54
Profession Part-time worker 11.36
Self-employed 4.55
Student 54.55
Full-time worker 29.54
Concerning wearable devices, thirty-six (36) Xi-
aomi Mi Band devices were acquired by the re-
searchers and distributed to the participants. Then,
the remaining participants (8) joined the study using
their own devices.
Table 3: Participants’ profile (part 2).
Category Attribute Percentage (%)
Income 0 to 1 50.00
2 to 4 31.81
5 to 7 4.56
8 to 10 11.36
More than 10 2.27
Residence Rural 2.27
Urban 97.73
Wearable Mi Band 84.09
AmazFit 9.09
Galaxy Fit 2.27
Galaxy Watch 2.27
P70-Pro 2.27
Family Arrangement Lives alone 6.82
Lives with 1 or 2 40.91
Lives with 3 or 4 36.36
Lives with 5 or more 15.91
Upon accepting the invitation, the study initiation
process followed six steps:
1. Participants were required to read and agree to the
informed consent form;
Healful Dataset: Integrating Wearable Data with Self-Reported Quality of Life Assessments
615
Federal University of Ceara
Fortaleza, Ceara, Brazil
GREat laboratory
7
Data Collection Workflow
Mon Tue Wed Thu Fri Sat Sun
Battery
issue
Sun
Daily
Activities
18:00 - 23:59
Instance 1
Daily
Activities
00:00 - 17:59
Reference
value for QoL
Daily
Activities
18:00 - 23:59
Instance 2
Daily
Activities
00:00 - 17:59
Reference
value for QoL
Daily
Activities
18:00 - 23:59
Network
issue
Instance 5
Daily
Activities
00:00 - 17:59
QoL
Questionnaire
Daily
Activities
18:00 - 23:59
Daily
Activities
00:00 - 17:59
Daily
Activities
18:00 - 23:59
Instance 3
Daily
Activities
00:00 - 17:59
Reference
value for QoL
Daily
Activities
18:00 - 23:59
Instance 4
Daily
Activities
00:00 - 17:59
Reference
value for QoL
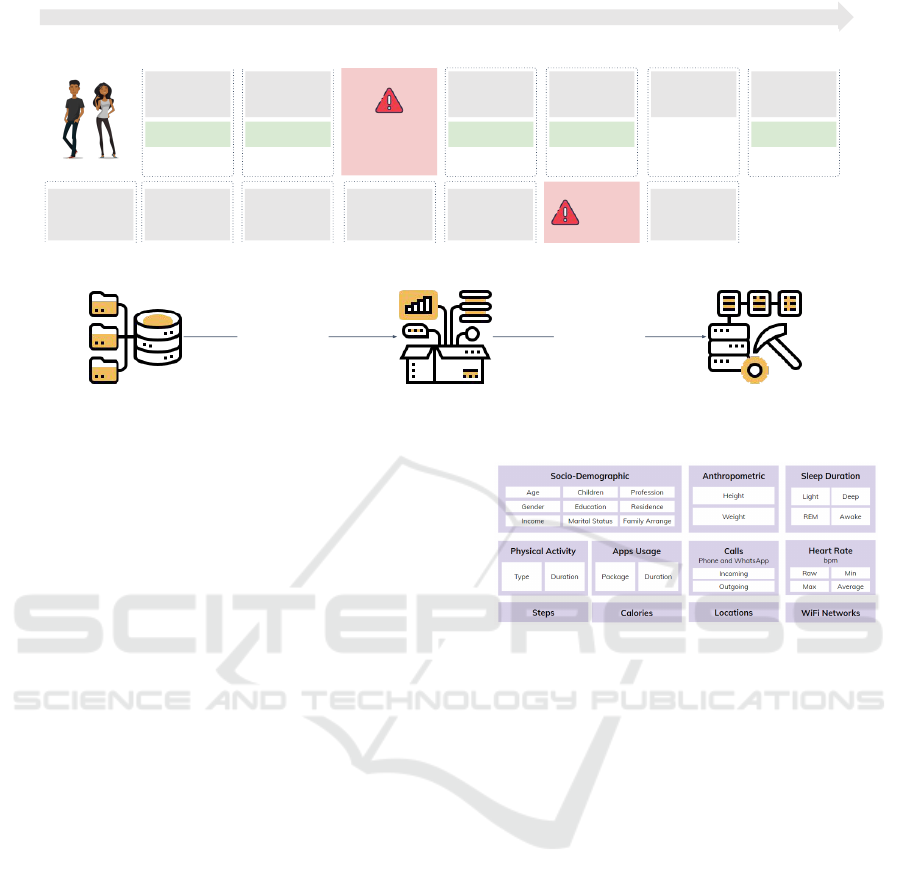
Preprocessing
88 features
Data MiningSelection
1,373
instances
Figure 3: A representation of how the instances are created.
2. They then completed the WHOQOL-BREF ques-
tionnaire in the presence of the responsible re-
searcher, who was available to address any poten-
tial questions or concerns;
3. The smartwatch or smart band was configured to
sync data with Google Fit;
4. Participants installed the QoL Monitor applica-
tion;
5. They granted the necessary permissions for health
data monitoring and
6. The monitoring process officially began.
After completing these steps, participants were in-
structed to continue their daily routines, thus execut-
ing the process described previously in Figure 2.
Figure 4 provides an overview of the data col-
lected. Sociodemographic and anthropometric data
are essential to better understand the characteristics
of the users, while the other data points are di-
rectly tied to the health indicators selected for this
research. Furthermore, it is worth noting that the lo-
cation data stored only includes the number of points
visited throughout the day, i.e., the application does
not record specific locations. The same logic was ap-
plied to identifying WiFi networks. The app records
the number of different WiFi networks connected
throughout the day. This strategy was adopted to en-
sure user privacy.
3.2 Data Preparation
Data preparation involves a series of steps to build the
dataset used in the modeling process. These steps in-
Figure 4: Raw data collected from subjects.
clude defining how the data will be segmented, select-
ing relevant attributes, cleaning it, and transforming it
for analysis (Wirth and Hipp, 2000).
Figure 3 illustrates how instances in the dataset
are created. Each sample includes predictors based
on data collected from 6:00 PM on the previous day
to 5:59 PM on the current day. This time window was
chosen because the quality of sleep from the previ-
ous night often directly impacts the activities of the
following day. The value to be predicted comes from
the user’s response to a weekly questionnaire, typi-
cally completed on Sundays. Since the questionnaire
requires participants to reflect on the past week, the
data collected throughout that week can be used as a
reliable reference. However, network outages or de-
vice battery problems can arise during data collection.
If data is not recorded during these times, no new in-
stances are generated for those intervals.
After obtaining the raw data, preprocessing activ-
ities are performed to prepare the dataset for the mod-
eling stage. These activities included:
- removing inconsistencies (e.g., duplicate entries);
- removing outliers, such as extremely high val-
ues for the daily steps. To remove these outliers,
it was used three standard deviations below and
HEALTHINF 2025 - 18th International Conference on Health Informatics
616
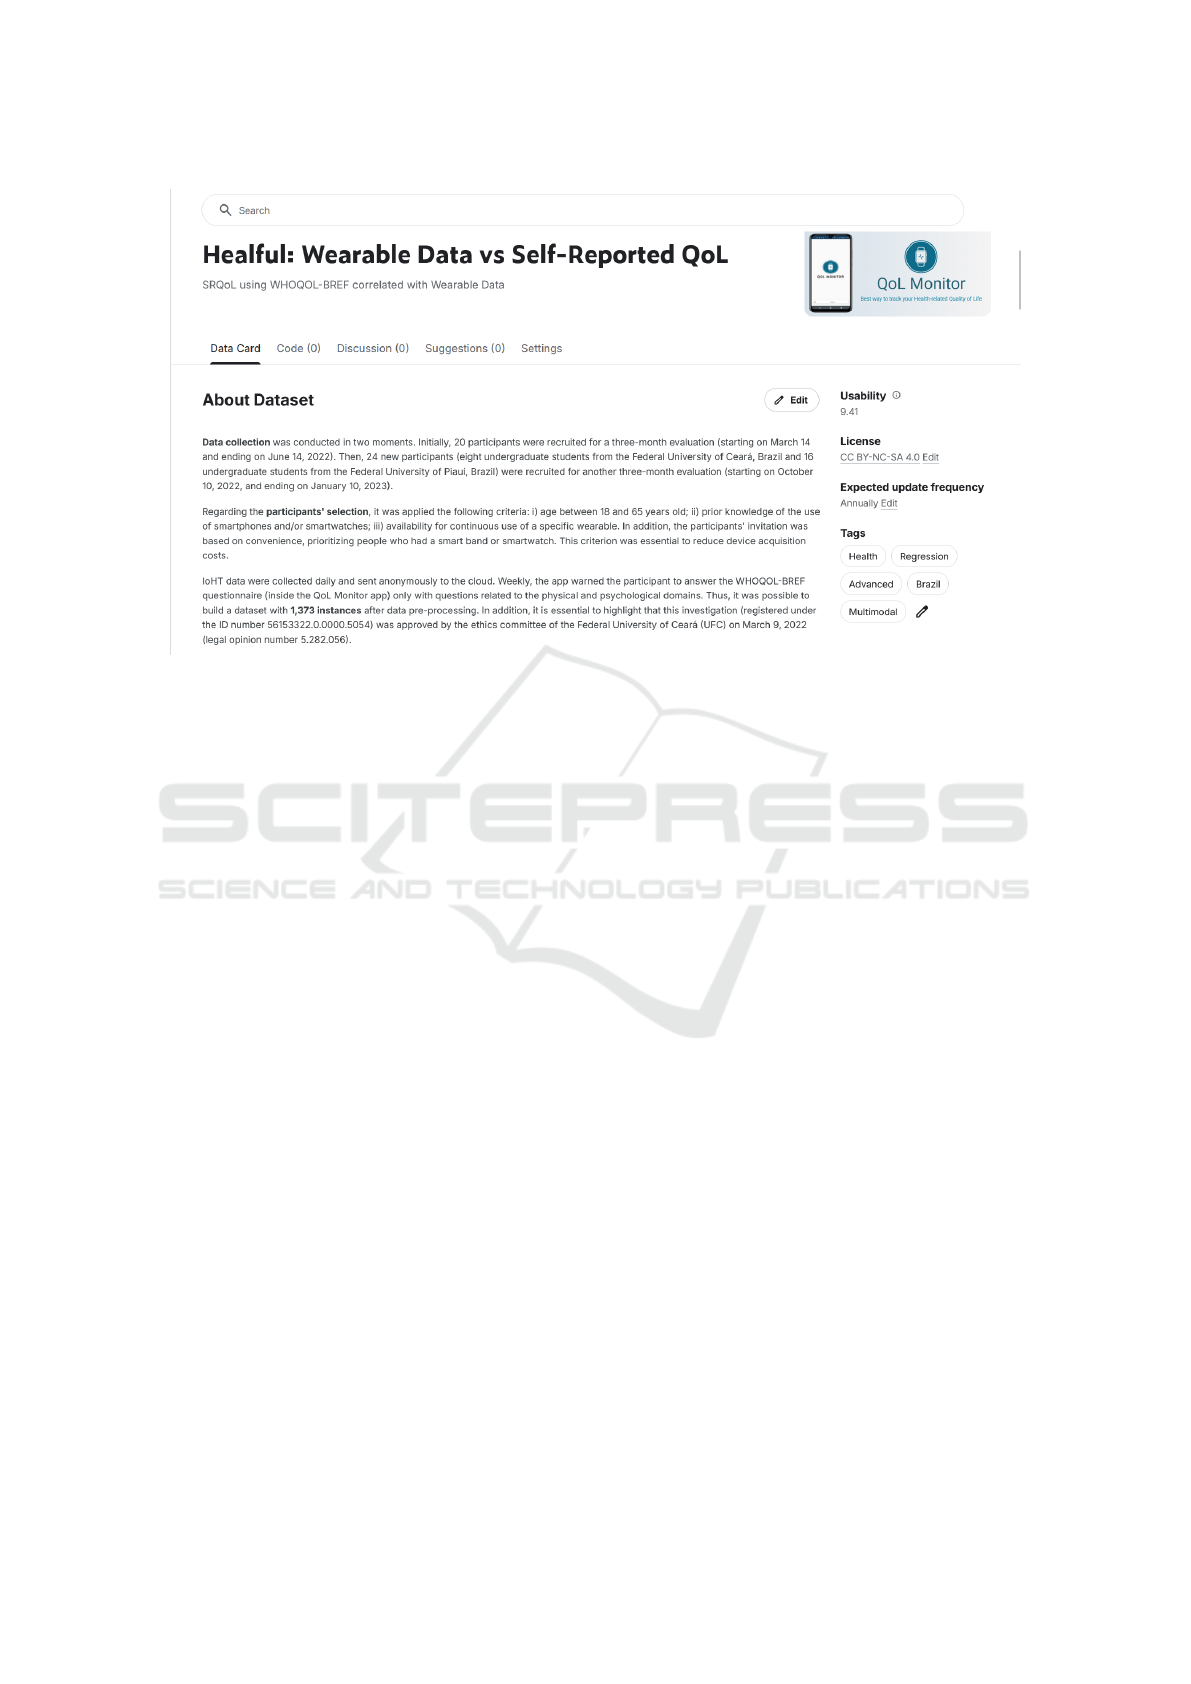
Figure 5: Project dataset interface in Kaggle.
above the mean;
- removing data gaps, for example, days without
sleep or heart rate data;
- categorical variables encoding like socio-
demographic data;
- data sync since users forgot to answer the QoL
questionnaire on Sundays;
- computation of QoL scores based on the question-
naire responses;
- data transformation, such as summarizing time
spent in each application category.
Finally, two datasets are obtained: i) a dataset in
which the last column is the QoL score for the physi-
cal domain; and ii) a dataset in which the last column
has the QoL score for the psychological domain. The
last column changes because it is used as a reference
for the learning process.
Thus, it was possible to build a dataset with 1,373
instances after data pre-processing. In addition, it is
essential to highlight that this investigation (registered
under the ID number 56153322.0.0000.5054) was ap-
proved by the ethics committee of the Federal Univer-
sity of Cear
´
a (UFC) on March 9, 2022 (legal opinion
number 5.282.056).
4 HEALFUL DATASET
As previously mentioned in the methodology, the
dataset was collected during two extraction periods
and includes data from 44 volunteers aged between 18
and 65 years. The dataset comprises information gen-
erated by smart devices from six different companies,
as well as data from Quality of Life questionnaires
collected via the QoL Monitor app.
The chosen platform for storing the dataset was
Kaggle due to its social network features, which fa-
cilitate data sharing and dissemination. Additionally,
its capability to create notebooks for the development
and training of models used for quality-of-life predic-
tion is a distinguishing factor not found with the same
quality in other data storage platforms. The repository
overview can be seen in Figure 5.
After processing the raw data obtained from the
extraction phase, two datasets were generated. The
first dataset includes the QoL Score for the physical
domain in its last column, while the second contains
the QoL Score for the psychological domain. Both
datasets have 88 features used to calculate the respec-
tive QoL Scores for their corresponding domains.
The dataset consists of 11 files, 9 of which are
CSV files containing data generated by wearable de-
vices and responses from the QoL questionnaire. Ad-
ditionally, there are 2 pickle files, each containing a
model built using the data for the respective domain
(physical and psychological).
Each of the 9 CSV files contains several columns
clustered by topic, and the overview of its content is
present in table 4.
Healful Dataset: Integrating Wearable Data with Self-Reported Quality of Life Assessments
617

Table 4: Overview of files, domains, and content.
File Name Domain Content Overview
20230120-data-collector-WHOQOL-BREF.csv Psychological Data from responses to the QoL questionnaire
20230120-data-collector-appsCategory.csv Both Information on apps and their usage categories on users’ devices
20230120-data-collector-appsUsage.csv Both Daily usage time of each app by users and its respective category
20230120-data-collector-dailyRegister.csv Physical Daily health registers collected from smartphones and wearables
20230120-data-collector-dailyStress.csv Psychological Daily feedback from users about their stress levels
20230120-data-collector-participant.csv Both Basic information about the study participants
20230120-data-collector-physicalActivities.csv Physical Data related to users’ physical activities
20230625-processed-physical-qol.csv Physical Physical and psychological health data focused on the physical domain
20230625-processed-psychological-qol.csv Psychological Physical and psychological health data focused on the psychological domain
5 USAGE SCENARIO
As previously discussed, wearable devices have
gained popularity in the last years for health and fit-
ness tracking, providing a bounty of data on users’
daily activities, physiological metrics, and sleep pat-
terns. However, while such data can provide rich in-
sights into one’s physical state, entailing these met-
rics with SRQoL measures can increase understand-
ing of daily behavior and physiological parameters
even more about the overall Quality of Life. This
database fills this gap by integrating wearable data
with the WHOQOL-BREF questionnaire in an in-
depth analysis of the correlations between objective
health data and QoL self-assessments.
In this section, we present three scenarios for us-
ing the Healful dataset. The first scenario is part of the
author’s doctoral thesis (de Oliveira, 2024) and repre-
sents the first practical use of the database. The other
scenarios are illustrative and serve to understand the
potential application of this data source.
The first application of this dataset analyzed QoL
inference in the physical and psychological domains
using data collected from users’ smartphones and
wearables. Based on this goal, we chose RMSE (Root
mean square error) as the main metric to validate the
accuracy of the QoL regressors since most of the re-
gression tasks use it due to the same units for the
result variable (Ian and Eibe, 2005). Even though
the RMSE was the leading metric, the Mean Abso-
lute Error-Mae (MAE) and training time in seconds
were also gathered to measure the precision of the
prediction and time complexity for building each Ma-
chine Learning model. However, since these mod-
els matched values obtained through the WHOQOL-
BREF questionnaire, defining a clear threshold for
comparison became mandatory since a perfect fit is
unfeasible. No thresholds for similar values were
found in the literature (Oliveira et al., 2022b). Thus,
A 10% error margin was chosen for references of
Quality of Life scores ranging between 0, the worst
score, and 100, the best score.
Five regression machine learning algorithms have
been implemented using Scikit-learn (Pedregosa
et al., 2011): Linear Regression, Decision Tree Re-
gressor, Random Forest Regressor, Gradient Boosting
Regressor, and Extra Trees Regressor. The choice of
those models comes from good practices that recom-
mend starting with more straightforward to complex
algorithms. A randomized hyper-parameter search
has been done for this analysis. Moreover, feature se-
lection has been done based on feature importance.
For this evaluation, it was also applied a random-
ized search on hyperparameters and a feature selec-
tion based on their relevance.
Each Machine Learning algorithm was coded in
Python using Jupyter notebooks
3
hosted on the Kag-
gle platform
4
and was run 30 times using 10-fold
cross-validation, resulting in 300 fits. All codes are
available together with the Healful dataset in the Kag-
gle platform.
Table 5 summarizes the preliminary findings of
this first application. It can be seen in both the phys-
ical and psychological datasets that with increased
classifier complexity, the training time generally in-
creases. Simultaneously, the errors – the metric being
minimized – tend to decrease for more advanced re-
gression models. It can be observed from Table 5 that
the best performance in both MAE and RMSE met-
rics was the regressor of Extra Trees. Also, regarding
training time, the Extra Trees regressor was the fastest
3
The Jupyter Notebook is an open-source web-based in-
teractive computing platform. A notebook can be written in
Julia, Python, or R, combining live code, equations, narra-
tive text, and visualizations.
4
Jupyter notebooks hosted on Kaggle run in a remote
computational environment. Each running session has 12
hours of execution time for the CPU and 20 Gigabytes of
auto-saved disk space. CPU Specifications: 4 CPU cores
and 30 Gigabytes of RAM.
HEALTHINF 2025 - 18th International Conference on Health Informatics
618
among the three algorithms, which gave the best per-
formance regarding error.
By applying statistical tests, namely the
Anderson-Darling test for normality and the
Kruskal-Wallis non-parametric hypothesis test, it can
be asserted with 95% confidence that the samples
of RMSE are drawn from distributions that differ
significantly (ρ-value < 0.0001). Applying Dunn’s
test for posthoc analysis, one can observe that
Random Forest and Extra Trees differ significantly
in their means from those obtained by the Linear
Regression, Decision Tree, and GBoost regressors
(ρ-value < 0.0001 for both datasets). However, the
RMSE means of Extra Trees and Random Forest are
not significantly different for both datasets (ρ-value =
0.07017).
The Random Forest was selected for the hyperpa-
rameter tuning effort, as the Extra Trees model some-
times presented over-fitting (Ying, 2019). In optimiz-
ing the Random Forest, the random search method
(Bergstra and Bengio, 2012) was employed, in which
hyperparameters are randomly sampled until a stop-
ping condition - in this case, 30 executions of 10-fold
cross-validation, counting for 300 fits.
After the random search optimization, the RMSE
was improved to 1.19% for the physical dataset and
to 3.01% for the psychological dataset. The RMSE
for the physical dataset had reduced from 8.0745 to
7.9793, while the same had been reduced for the psy-
chological dataset from 7.7493 to 7.5162. Besides,
some feature selection experiments were conducted
to further enhance the performance of Random For-
est in terms of RMSE. The SelectKBest method was
chosen due to its proven effectiveness in practical sce-
narios (Ratmana et al., 2020). It worked best when
applying mutual info regression, whereby it selected
70 out of the 88 features in the physical dataset and
improved RMSE by about 1.47% and selected 50 out
of 88 features in psychological datasets that improved
the RMSE by approximately 0.76%. After that, the
RMSE of a physical dataset was reduced from 7.9793
to 7.8618, while for the psychological one, it was re-
duced from 7.5162 to 7.4591.
Table 5: Initial results regarding MAE, RMSE, and training
time for the physical and psychological datasets.
ML Techniques
Physical Dataset Psychological Dataset
MAE RMSE Time MAE RMSE Time
Linear Regression 9.5658 14.4308 0.7544 10.6868 17.6120 0.8286
Decision Tree 6.9889 10.4243 1.4479 6.8111 10.5715 1.5317
Random Forest 5.6870 8.0745 92.0384 5.4534 7.7493 98.3695
GBoost 6.0078 8.1860 528.8100 5.7768 8.0693 438.2732
Extra Trees 5.3672 7.4918 16.8884 5.1965 7.3320 16.7467
It is worth mentioning that Pearson’s correlation
analysis between the dataset features and the pre-
dicted outcome (QoL score) showed all correlations
below 0.39, indicating weak or negligible relation-
ships (Schober et al., 2018). Consequently, it is not
possible to define a definitive subset of features that
can accurately infer users’ Quality of Life.
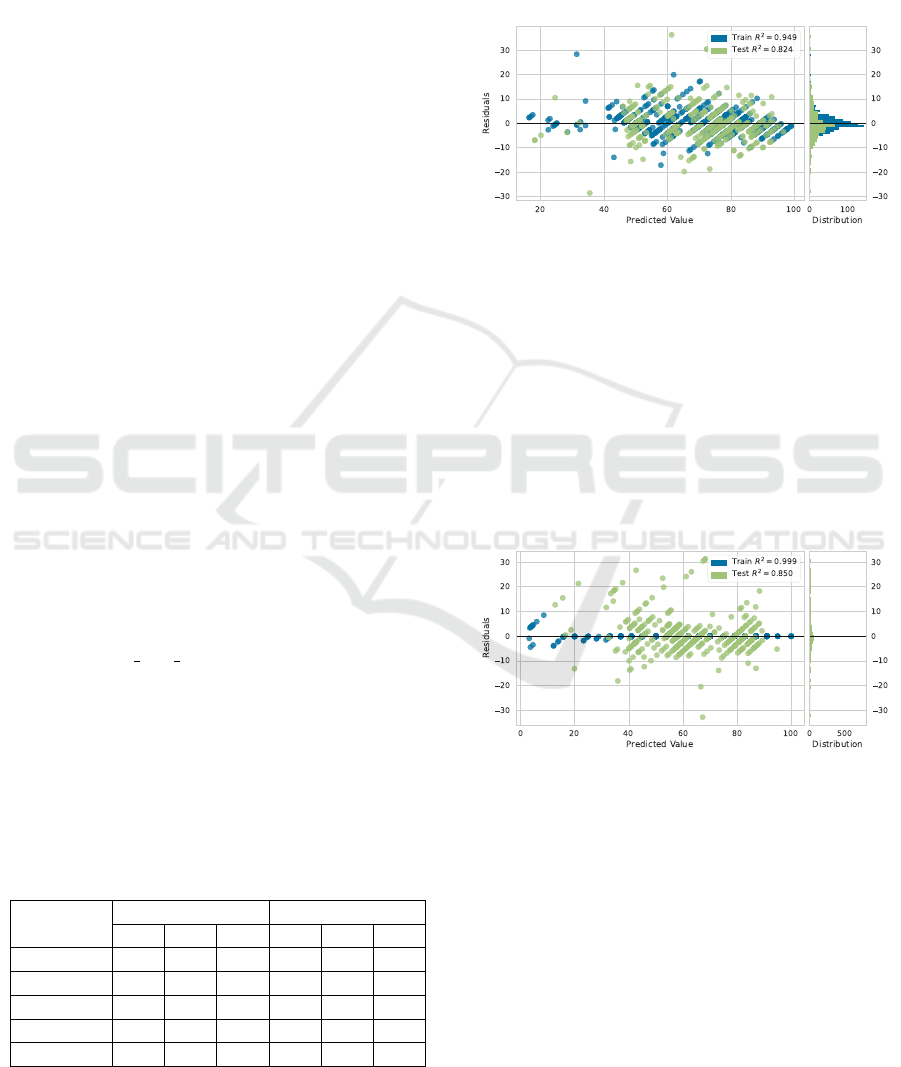
Figure 6: Residual plot for physical dataset.
Figures 6 and 7 present the residual plots for the
Random Forest applied to the physical and psycho-
logical datasets, respectively. It displays the residu-
als as the difference between actual values - result-
ing from the current WHOQOL-BREF questionnaire
- and the predicted ones - regressor output. Residu-
als are mainly in the [−10, +10] range. Some outliers
exist in the test subset, but the error histogram is nor-
mally distributed, centered around zero. In summary,
this result is acceptable for Machine Learning models
predicting users’ Quality of Life.
Figure 7: Residual plot for psychological dataset.
In addition to the scenario presented, which could
easily be expanded by testing new algorithms or new
processing strategies, it is possible to use the presen-
ter data in the Healful dataset to search for correla-
tions between the socioeconomic profile of the partic-
ipants and the Quality of Life score. As previously
presented, the database contains information on age,
gender, income, educational level, and others. This
analysis can be used to compare with previously pub-
lished results (Alwhaibi, 2024).
Another possible application of the Healful
database is identifying features related to the partic-
ipants’ daily perception of stress. Throughout the
Healful Dataset: Integrating Wearable Data with Self-Reported Quality of Life Assessments
619

data collection, the volunteers were asked to report
their stress levels daily, making it possible to study
biomarkers for stress perception (Qi et al., 2020).
Since data was collected on the time spent us-
ing applications on the volunteers’ smartphones, it is
also possible to investigate the use of clustering tech-
niques to find patterns related to the use of apps and
other features related to mobility or mental health.
Similarly, (Pappot et al., 2019) present a study about
HRQoL and the use of smartphones by adolescents.
Finally, the database availability on the Kag-
gle platform will enable its reuse in several studies,
strengthening this line of research and promoting the
development of solutions to improve the population’s
Quality of Life.
6 DISCUSSION
Inferring Quality of Life from data gathered through
wearable devices represents a significant advance-
ment in health monitoring compared to traditional
self-report questionnaires like the WHOQOL-BREF.
While questionnaires about an individual’s well-being
provide valid insights, they have inherent limitations.
The biggest weakness of questionnaires is that they
rely on perception and the cooperation ability of the
particular individual. Additionally, they are difficult
to administer frequently, leading to respondent fa-
tigue, incomplete data, or inconsistent self-reporting,
resulting in potential bias. In contrast, wearables mit-
igate these issues by continuously recording data non-
intrusively.
Wearable sensors continuously monitor, in real-
time, a wide range of health indicators, such as heart
rate, sleep patterns, and physical activity, for ad-
vanced data analytics and intelligent model creation
to predict QoL without requiring active participation
from the subject (Oliveira et al., 2022c). Hence, wear-
able devices can complement traditional QoL ques-
tionnaires by enabling more frequent, objective mea-
surements of health indicators. However, transition-
ing from SRQoL to Smart Quality of Life (Oliveira
et al., 2023b) is challenging.
One significant barrier to the widespread use of
wearable data in QoL assessments is the need for
large, high-quality datasets to develop robust and in-
telligent models. This study addressed this gap, in
part, by proposing the Healful dataset, which includes
both wearables data and responses to the WHOQOL-
BREF questionnaire.
Our dataset provides opportunities for researchers
to explore the relationship between physiological data
and perceived QoL, enabling the development of
more accurate predictive models that can help clarify
how objective health metrics relate to subjective well-
being. While wearable devices undoubtedly hold
great potential for enhancing QoL assessments, fur-
ther research is needed to address significant chal-
lenges, including the current reliance on self-reported
data and the difficulty of integrating wearable data
into intelligent models.
As limitations, it was observed that each volun-
teer has unique characteristics (age, sex, health status,
habits) that can influence the collected data. However,
the profile of the volunteers is quite narrow, as the data
is collected only from healthy individuals, and the to-
tal number of participants is small. Furthermore, the
accuracy of the data relies on the continuous adher-
ence of volunteers to wearing the bracelets. Some par-
ticipants reported discomfort while using them, which
may result in incomplete data.
Regarding the validity of the dataset construction,
the integrity of the data can be compromised by inad-
equate collection practices. This is due to issues such
as some participants stopping using the device or los-
ing it. The identified limitations are being analyzed to
be addressed in future work.
7 FINAL REMARKS
In this paper, we have discussed the development of
the Healful dataset, a health dataset built by integrat-
ing wearable data with Self-reported Quality of Life
measures using the WHOQOL-BREF questionnaire.
This study shows that IoHT data can help enhance
QoL models’ predictive ability. The key contribu-
tion of this work is to provide a complete anonymized
dataset that researchers and practitioners can use to
study new Machine Learning models targeted at QoL
prediction for facilitating development in health mon-
itoring based on IoHT. The Healful dataset signifi-
cantly contributes to health informatics, especially to-
ward a more continuous real-time monitoring method
for QoL indicators.
Future work on the Healful dataset includes in-
creasing the volume of data through a new round
of data collection with 100 volunteers, aiming for
greater diversity across demographic groups. Explor-
ing new features to enhance the predictive model is
another direction for future research. Moreover, ap-
plying and comparing new Machine Learning algo-
rithms can enhance the accuracy and reliability of
the prediction. These steps will help maintain the
dataset’s value and support the development of mod-
els that improve personalized health interventions and
QoL assessments.
HEALTHINF 2025 - 18th International Conference on Health Informatics
620

CODE AND DATA AVAILABILITY
All codes and data are publicly available on
kaggle.com/datasets/ppedroalmir/self-reported-qol.
ACKNOWLEDGMENTS
The authors would like to thank National Council for
Scientific and Technological Development (CNPq)
for the Productivity Scholarship of Rossana Maria de
Castro Andrade DT-2 (N
o
315543 / 2018-3), for the
Productivity Scholarship of Pedro de Alc
ˆ
antara dos
Santos Neto DT-2 (N
o
315198 / 2018-4), and Coordi-
nation for the Improvement of Higher Education Per-
sonnel (CAPES) that provided to the Evilasio C. Ju-
nior a Ph.D. scholarship.
REFERENCES
Abdulmalek, S., Nasir, A., Jabbar, W. A., Almuhaya, M. A.,
Bairagi, A. K., Khan, M. A.-M., and Kee, S.-H.
(2022). Iot-based healthcare-monitoring system to-
wards improving quality of life: A review. In Health-
care, volume 10, page 1993. MDPI.
Aday, L. A. and Cornelius, L. J. (2006). Designing and con-
ducting health surveys: a comprehensive guide. John
Wiley & Sons, San Francisco (CA).
Alwhaibi, M. (2024). Depression, anxiety, and health-
related quality of life in adults with type 2 diabetes.
Journal of Clinical Medicine, 13(20):6028.
Banaee, H., Ahmed, M. U., and Loutfi, A. (2013). Data
mining for wearable sensors in health monitoring sys-
tems: a review of recent trends and challenges. Sen-
sors, 13(12):17472–17500.
Bergstra, J. and Bengio, Y. (2012). Random search for
hyper-parameter optimization. Journal of machine
learning research, 13(2).
Biswas, N. and Ashili, S. (2023). Smartwatch heart rate
data. IEEE Dataport.
de Oliveira, P. A. M. (2024). HEALFUL - Internet of Health
Things Platform to Monitor Quality of Life. PhD the-
sis, Federal University of Cear
´
a (UFC).
Durango Vanegas, C. E., Giraldo Mej
´
ıa, J. C., Var-
gas Agudelo, F. A., and Soto Duran, D. E. (2023).
A representation based on essence for the crisp-dm
methodology. Computaci
´
on y Sistemas, 27(3):675–
689.
Dutta, J. and Puthal, D. (2023). Iomt synthetic cardiac ar-
rest dataset for ehealth with ai-based validation. IEEE
Computer Society Annual Symposium on VLSI.
Estrada-Galinanes, V. and Wac, K. (2018). Visions and
challenges in managing and preserving data to mea-
sure quality of life. In 3rd Int. Work. on Foundations
and Applications of Self Systems, pages 92–99. IEEE.
Galdino, I., Soto, J. C., Caballero, E., Ferreira, V., Ramos,
T. C., Albuquerque, C., and Muchaluat-Saade, D. C.
(2023). ehealth csi: A wi-fi csi dataset of human ac-
tivities. IEEE Access, 11:71003–71012.
Hao, T., Walter, K. N., Ball, M. J., Chang, H.-Y., Sun, S.,
and Zhu, X. (2017). Stresshacker: towards practical
stress monitoring in the wild with smartwatches. In
AMIA Annual Symposium Proceedings, volume 2017,
page 830, United States. American Medical Informat-
ics Association.
Henriksen, A., Woldaregay, A. Z., Muzny, M., Hartvigsen,
G., Hopstock, L. A., and Grimsgaard, S. (2022).
Dataset of fitness trackers and smartwatches to mea-
suring physical activity in research. BMC Research
Notes, 15(1):258.
Ian, H. W. and Eibe, F. (2005). Data mining: practical ma-
chine learning tools and techniques. Morgan Kauf-
mann Publishers, Burlington, MA, 1st ed edition.
Junior, E. C., Andrade, R. M. C., Venceslau, A., Oliveira, P.
A. M., Santos, I., and Oliveira, B. S. (2022). Where
is the internet of health things data? In 24th Interna-
tional Conference on Enterprise Information Systems
(ICEIS). INSTICC.
Magno, N. M., da Rocha, L. C. N., de Ara
´
ujo, A. P. M.,
da Silva, M. C. R., da Silva Pinto, D., Cardoso,
B. A., da Silva Dias, G. A., et al. (2018). Relac¸
˜
ao
da func¸
˜
ao vesical e marcha em indiv
´
ıduos com v
´
ırus
linfotr
´
opico de c
´
elulas t humana tipo 1. Sa
´
ude e
Pesquisa, 11(2):213–221.
Marvel, J., Gargon, E., Howse, C., Chohan, A., Mayhew,
M., Kenney, G., Stone, L., Fisher, B. A., Steenackers,
M., Williamson, N., et al. (2024). The development
and content validation of the sj
¨
ogren’s related quality
of life instrument (srqol). Rheumatology and Therapy,
pages 1–19.
Mate, K. K. (2022). Using new technologies in quality of
life assessment. In Handbook of Quality of Life in
Cancer, pages 123–131. Springer, United Kingdom.
Nodeh, M. J., Calp, M. H., and S¸ahin,
˙
I. (2020). Analyz-
ing and processing of supplier database based on the
cross-industry standard process for data mining (crisp-
dm) algorithm. In Artificial Intelligence and Applied
Mathematics in Engineering Problems: Proceedings
of the International Conference on Artificial Intelli-
gence and Applied Mathematics in Engineering (ICA-
IAME 2019), pages 544–558. Springer.
Oliveira, P., Andrade, R., and Santos Neto, P. d. A. (2023a).
Lessons learned from health monitoring in the wild.
pages 155–166.
Oliveira, P., Costa Junior, E., Andrade, R., Santos, I., and
Neto, P. (2022a). Ten Years of eHealth Discussions
on Stack Overflow:. pages 45–56.
Oliveira, P. A., Andrade, R., and Santos Neto, P. (2023b).
Lessons Learned from mHealth Monitoring in the
Wild:. In Proceedings of the 16th International
Joint Conference on Biomedical Engineering Systems
and Technologies, pages 155–166, Lisbon, Portugal.
SCITEPRESS - Science and Technology Publications.
Oliveira, P. A. M., Andrade, R. M. C., Neto, P. S. N., and
Oliveira, B. S. (2022b). Internet of health things for
Healful Dataset: Integrating Wearable Data with Self-Reported Quality of Life Assessments
621

quality of life: Open challenges based on a system-
atic literature mapping. In Proceedings of the 15th
International Joint Conference on Biomedical Engi-
neering Systems and Technologies, Online Streaming.
INSTICC, SCITEPRESS - Science and Technology
Publications.
Oliveira, P. A. M., Andrade, R. M. C., Neto, P. S. N., and
Oliveira, B. S. (2022c). Towards an ioht platform to
monitor qol indicators. In Proceedings of the 15th
International Joint Conference on Biomedical Engi-
neering Systems and Technologies, pages 438–445,
Online Streaming. INSTICC, SCITEPRESS - Science
and Technology Publications.
Orley, J. and Kuyken, W. (1994). The development of
the world health organization quality of life assess-
ment instrument (the whoqol). In Quality of life as-
sessment: International perspectives, pages 41–57.
Springer Berlin Heidelberg, Berlin, Heidelberg.
Pappot, H., Taarnhøj, G. A., Elsbernd, A., Hjerming, M.,
Hanghøj, S., Jensen, M., Boisen, K. A., et al. (2019).
Health-related quality of life before and after use of a
smartphone app for adolescents and young adults with
cancer: pre-post interventional study. JMIR mHealth
and uHealth, 7(10):e13829.
Pedregosa, F., Varoquaux, G., Gramfort, A., Michel, V.,
Thirion, B., Grisel, O., Blondel, M., Prettenhofer,
P., Weiss, R., Dubourg, V., Vanderplas, J., Passos,
A., Cournapeau, D., Brucher, M., Perrot, M., and
Duchesnay, E. (2011). Scikit-learn: Machine learning
in Python. Journal of Machine Learning Research,
12:2825–2830.
Peimankar, A., Winther, T. S., Ebrahimi, A., and Wiil,
U. K. (2023). A machine learning approach for walk-
ing classification in elderly people with gait disorders.
Sensors, 23(2):679.
Qi, M., Li, P., Moyle, W., Weeks, B., and Jones, C. (2020).
Physical activity, health-related quality of life, and
stress among the chinese adult population during the
covid-19 pandemic. International journal of environ-
mental research and public health, 17(18):6494.
Rabin, R. and Charro, F. d. (2001). Eq-sd: a measure
of health status from the euroqol group. Annals of
medicine, 33(5):337–343.
Raghunath, K. M. K. (2024). Comprehensive patient-health
monitoring dataset. IEEE Dataport.
Ratmana, D. O., Fajar Shidik, G., Fanani, A. Z., Muljono,
and Pramunendar, R. A. (2020). Evaluation of Feature
Selections on Movie Reviews Sentiment. In 2020 In-
ternational Seminar on Application for Technology of
Information and Communication (iSemantic), pages
567–571, Semarang, Indonesia. IEEE.
Ravens-Sieberer, U., Gosch, A., Rajmil, L., Erhart, M.,
Bruil, J., Duer, W., Auquier, P., Power, M., Abel,
T., Czemy, L., et al. (2005). Kidscreen-52 quality-
of-life measure for children and adolescents. Expert
review of pharmacoeconomics & outcomes research,
5(3):353–364.
Robbins, T. D., Keung, S. N. L. C., and Arvanitis, T. N.
(2018). E-health for active ageing; a systematic re-
view. Maturitas, 114:34–40.
Rodrigues, J. J., Segundo, D. B. D. R., Junqueira, H. A.,
Sabino, M. H., Prince, R. M., Al-Muhtadi, J., and
De Albuquerque, V. H. C. (2018). Enabling tech-
nologies for the internet of health things. Ieee Access,
6:13129–13141.
Sanchez, W., Martinez, A., Campos, W., Estrada, H., and
Pelechano, V. (2015). Inferring loneliness levels in
older adults from smartphones. Journal of Ambient
Intelligence and Smart Environments, 7(1):85–98.
Schneider, J., Seidel, S., Basalla, M., and vom Brocke, J.
(2023). Reuse, reduce, support: design principles for
green data mining. Business & Information Systems
Engineering, 65(1):65–83.
Schober, P., Boer, C., and Schwarte, L. A. (2018). Corre-
lation coefficients: appropriate use and interpretation.
Anesthesia & analgesia, 126(5):1763–1768.
Sinha, M. K. (2023). Dataset for heart rate variability and
pulse rate variability analysis. Havard Dataverse.
Skevington, S. M., Lotfy, M., and O’Connell, K. A. (2004).
The world health organization’s whoqol-bref quality
of life assessment: psychometric properties and re-
sults of the international field trial. a report from the
whoqol group. Quality of life Research, 13:299–310.
Sundmaeker, H., GUILLEMIN, P., FRIESS, P., and
WOELFFL
´
E, S. (2020). Vision and challenges for re-
alising the internet of things.
Ware Jr, J. E. (1999). Sf-36 health survey.
WHO (2016). The global strategy and action plan on age-
ing and health 2016–2020: towards a world in which
everyone can live a long and healthy life. Sixty-ninth
World Health Assembly, Geneva, pages 23–28.
Wirth, R. and Hipp, J. (2000). Crisp-dm: Towards a stan-
dard process model for data mining. In Proceedings of
the 4th international conference on the practical ap-
plications of knowledge discovery and data mining,
volume 1, pages 29–39. Manchester.
Ying, X. (2019). An Overview of Overfitting and its
Solutions. Journal of Physics Conference Series,
1168:022022.
Zeadally, S., Siddiqui, F., Baig, Z., and Ibrahim, A. (2020).
Smart healthcare: Challenges and potential solutions
using internet of things (iot) and big data analytics.
PSU research review, 4(2):149–168.
HEALTHINF 2025 - 18th International Conference on Health Informatics
622
