
Comparison of CNN and Transformer Architectures for Robust Cattle
Segmentation in Complex Farm Environments
Alessandra Lumini
a
, Guilherme Botazzo Rozendo
b
, Maichol Dadi
c
and Annalisa Franco
d
Department of Computer Science and Engineering, University of Bologna, Cesena, FC, Italy
Keywords:
Cattle Segmentation, CNN, Transformer, Computer Vision, Deep Learning, Hybrid Models, Semantic
Segmentation, Farm Environments.
Abstract:
In recent years, computer vision and deep learning have become increasingly important in the livestock in-
dustry, offering innovative animal monitoring and farm management solutions. This paper focuses on the
critical task of cattle segmentation, an essential application for weight estimation, body condition scoring, and
behavior analysis. Despite advances in segmentation techniques, accurately identifying and isolating cattle
in complex farm environments remains challenging due to varying lighting conditions and overlapping ob-
jects. This study evaluates state-of-the-art segmentation models based on convolutional neural networks and
transformers, which leverage self-attention mechanisms to capture long-range image dependencies. By testing
these models across multiple publicly available datasets, we assess their performance and generalization capa-
bilities, providing insights into the most effective methods for accurate cattle segmentation in real-world farm
conditions. We also explore ensemble techniques, selecting pairs of segmenters with maximum diversity. The
results are promising, as an ensemble of only two models improves performance over all stand-alone methods.
The findings contribute to improving computer vision-based solutions for livestock management, enhancing
their accuracy and reliability in practical applications.
1 INTRODUCTION
In recent years, computer vision and deep learn-
ing have gained significant importance in the live-
stock industry, offering various innovative solutions
for improving animal monitoring and farm manage-
ment (Borges Oliveira et al., 2021). From automated
health assessment to behavior analysis and disease de-
tection, computer vision techniques, especially those
based on convolutional neural networks (CNNs), are
increasingly being applied to address key challenges
in animal farming (Qiao et al., 2019; Wu et al., 2020;
Bello et al., 2021; Lee et al., 2023; Feng et al.,
2023). Among these, animal segmentation is criti-
cal in applications such as weight estimation, body
condition scoring, behavior analysis, and measure-
ment of various physical traits essential for evaluat-
ing livestock health and productivity (Wu et al., 2020;
Borges Oliveira et al., 2021; Lee et al., 2023). Specif-
a
https://orcid.org/0000-0003-0290-7354
b
https://orcid.org/0000-0002-4123-8264
c
https://orcid.org/0009-0002-7824-1659
d
https://orcid.org/0000-0002-6625-6442
ically, approaches based on the Mask R-CNN model
and DeepLabV3+ have been widely used for animal
segmentation tasks, achieving high accuracy and ro-
bustness in various scenarios (Qiao et al., 2019; Bello
et al., 2021; Lee et al., 2023; Feng et al., 2023).
For instance, in (Qiao et al., 2019) the authors
proposed a segmentation framework that involved se-
lecting keyframes from cattle videos using histogram
analysis and the Mask R-CNN to extract the cattle
contour. The authors in (Bello et al., 2021) also
employed Mask R-CNN in their method, which in-
cluded pre-enhancement of images using Fourier de-
scriptors, optimization of filter sizes in the back-
bone, multiscale semantic feature extraction, and
post-enhancement with Grabcut for refined contour-
ing. The work proposed in (Lee et al., 2023) used
Mask R-CNN as a crucial component in a non-
intrusive method for estimating cattle weight from 2D
images. The authors concluded that Mask R-CNN
led to a lower mean average error than weakly super-
vised approaches. Regarding the strategies based on
DeepLabV3, the method in (Wu et al., 2020) used the
DeepLabv3+ model to perform semantic segmenta-
tion in a framework to detect respiratory rates in cows.
Lumini, A., Rozendo, G. B., Dadi, M. and Franco, A.
Comparison of CNN and Transformer Architectures for Robust Cattle Segmentation in Complex Farm Environments.
DOI: 10.5220/0013176400003905
In Proceedings of the 14th International Conference on Pattern Recognition Applications and Methods (ICPRAM 2025), pages 91-102
ISBN: 978-989-758-730-6; ISSN: 2184-4313
Copyright © 2025 by Paper published under CC license (CC BY-NC-ND 4.0)
91

The authors used a magnification algorithm to am-
plify weak breathing movements and Lucas-Kanade
optical flow to detect breathing direction. The ap-
proach in (Feng et al., 2023) presented an enhanced
version of DeepLabV3+ to overcome challenges in
cattle monitoring within complex farm environments.
The strategy consisted of replacing the backbone with
MobileNetV2, enforcing a layer-by-layer feature fu-
sion strategy, and adding a SENet module to refine
segmentation accuracy.
While previous studies have made valuable contri-
butions, there is a need to explore the potential of hy-
brid models that combine CNNs with transformer ar-
chitectures for cattle segmentation tasks. Transform-
ers are advanced deep-learning models that utilize the
self-attention mechanism to capture long-range de-
pendencies and relationships in data effectively. This
capability makes transformers crucial for segmenta-
tion tasks as they can grasp the global context, which
is essential for accurately segmenting objects in an
image (Zhang et al., 2022; Dong et al., 2023; Liu
et al., 2024). Unlike traditional CNNs that are limited
by local receptive fields, transformers divide images
into patches and treat them as sequences, allowing
them to learn interactions between different parts of
the image. By integrating their attention mechanism
with traditional CNN architectures, transformers can
significantly improve the accuracy and robustness of
segmentation techniques.
The HSNet (Zhang et al., 2022), for example, pre-
sented an encoder-decoder architecture with an en-
coder based on the PVTv2 and a hybrid decoder
that uses self-attention and convolution to learn long-
range dependencies and model local feature details.
The authors in (Dong et al., 2023) introduced a
transformer-based model that also used PVT as an
encoder to gather information from the global con-
text. They used convolutional modules to collect the
objects’ semantic and location information, enhance
low-level representation, and combine the low and
high-level features. The authors in (Liu et al., 2024)
proposed a method in which both encoder and de-
coder were based on transformers to enhance feature
representation and capture rich features. They used
the PVT as an encoder and a cross-attention decoder
module to capture inherent connections between dis-
tinct features.
Considering the advances provided by transformer
models and that they have not been explored in cattle
segmentation, we propose a comparative study using
models based on CNN and transformers. We partic-
ularly focus on analyzing images from cattle farms
with the specific task of cattle segmentation, auto-
matically identifying and isolating the precise bound-
aries of individual cattle within an image or video
frame. This task involves distinguishing the animal
from its background and other objects, enabling accu-
rate extraction of morphological features. Despite its
practical importance, we noticed that the challenge of
accurately segmenting animals in complex environ-
ments—characterized by varying lighting conditions
and overlapping objects- has been relatively underex-
plored in the literature. The lack of sufficient research
in this area presents an opportunity for developing ro-
bust segmentation methods that can significantly en-
hance the accuracy and reliability of computer vision-
based solutions in livestock management.
Therefore, this paper evaluates several state-of-
the-art networks for image segmentation, adapting
them to the specific cattle segmentation task and fo-
cusing on architectures based on CNNs and trans-
formers. We assessed the performance of these mod-
els using multiple publicly available datasets, includ-
ing a cross-dataset testing approach to examine the
generalization capabilities of each method. We per-
formed a comparative analysis to identify the most
effective techniques for accurate cattle segmentation,
which is critical for livestock management applica-
tions such as weight estimation and morphological
analysis. Additionally, we explored the use of en-
semble models, selecting pairs of networks with max-
imum diversity to enhance segmentation accuracy.
The results demonstrate that even small ensembles,
consisting of only two models, can outperform indi-
vidual networks, providing a promising approach for
improving segmentation performance in challenging
farm environments.
The contributions of this work are as follows:
1. We introduce the application of transformer mod-
els to the segmentation of cattle images, a method
that has not yet been explored in specialized liter-
ature.
2. We conduct a comparative study of state-of-the-
art transformer-based architectures and convolu-
tional neural networks (CNNs) for cattle segmen-
tation in complex farm environments.
3. We evaluate the generalization capabilities of
each model through cross-dataset testing, utiliz-
ing multiple publicly available datasets.
4. Lastly, we offer insights into the most effective
methods for accurate cattle segmentation, which
enhances the accuracy and reliability of computer
vision-based solutions in livestock management.
ICPRAM 2025 - 14th International Conference on Pattern Recognition Applications and Methods
92

2 METHODOLOGY
The proposed methodology involves adapting and
evaluating state-of-the-art CNN and transformer-
based architectures for cattle segmentation in com-
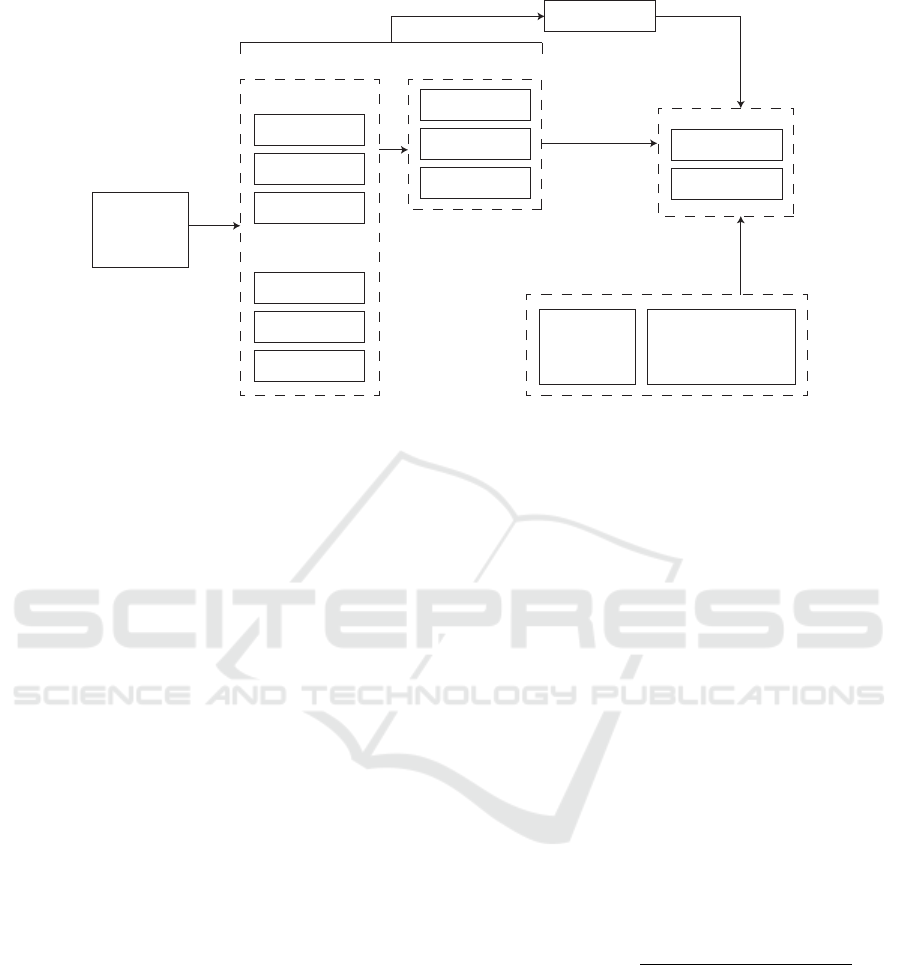
plex farm environments. Figure 1 illustrates the gen-
eral workflow of the proposed approach. We se-
lected six models for comparison. Among the CNN-
based approaches, we included three widely recog-
nized methods:
• U-Net (Ronneberger et al., 2015), a landmark ar-
chitecture known for its excellent performance in
biomedical image segmentation;
• DeepLabV3 (Chen, 2017), which leverages atrous
convolution and multi-scale context;
• HarDNet-MSEG (Huang et al., 2021), a more re-
cent model that combines efficiency and accuracy.
For transformer-based approaches, we focused on
recent advancements that demonstrate state-of-the-art
performance in segmentation tasks:
• HSNet (Zhang et al., 2022), which employs a hi-
erarchical structure to capture long-range depen-
dencies;
• PVT (Dong et al., 2023), a versatile pyramid vi-
sion transformer that balances accuracy and com-
putational cost;
• CAFE-Net (Liu et al., 2024), an innovative frame-
work tailored for segmentation in medical imag-
ing.
We fine-tuned each model using the publicly available
CattleSegment dataset (CattleDetector, 2023) with
three different loss functions: the Dice loss, binary
cross-entropy, and structure loss. Then, we performed
cross-dataset testing with the also publicly available
Cattle 1000 (Roldan, 2024) and CattleWeightDetec-
tion (Acme AI Ltd. et al., 2024) datasets to evaluate
the generalization capabilities of each model. We as-
sessed the performance of the models using standard
metrics such as the Dice similarity coefficient and in-
tersection over union. Finally, we employed an en-
semble strategy to combine the predictions of pairs
of models, enhancing the overall accuracy of the seg-
mentation task.
2.1 Network Topology
2.1.1 U-Net
U-Net (Ronneberger et al., 2015) is a well-known ar-
chitecture designed in a U-shaped structure, with an
encoder that downsamples the input image to extract
high-level features and a decoder that upsamples the
data to recover spatial resolution and create precise
segmentations. One of the key features of the U-
Net is the skip connections, which link correspond-
ing layers between the encoder and decoder, allow-
ing the network to retain fine-grained details by com-
bining lower-resolution abstract features with higher-
resolution spatial information. This feature makes the
U-Net highly effective for tasks that require pixel-
level accuracy. We used the ResNet34 as the back-
bone.
2.1.2 DeepLabV3
The DeepLabV3 (Chen, 2017) is a semantic segmen-
tation model that uses atrous (or dilated) convolution
to capture multi-scale contextual information without
reducing the spatial resolution of feature maps. It con-
sists of an encoder-decoder architecture, where the
encoder is a ResNet-based architecture with atrous
convolution. The decoder uses a series of upsam-
pling and convolutional layers to restore spatial res-
olution and produce the final segmentation mask. A
key feature of DeepLabv3 is the Atrous Spatial Pyra-
mid Pooling module, which employs multiple parallel
convolutions with different dilation rates to help the
network capture features at various scales. We used
the ResNet50 as the encoder.
2.1.3 HarDNet-MSEG
The HarDNet-MSEG (Huang et al., 2021) is a model
inspired by U-Net and consists of a backbone and
a decoder. The backbone, HarDNet68, is a low-
memory traffic CNN designed for feature extraction.
It aims to reduce computational complexity while re-
taining the advantages of densely connected convo-
lutional networks (DenseNet) using harmonic dense
connections, which are more computationally effi-
cient. The decoder is inspired by the cascaded par-
tial decoder, enabling fast and accurate salient object
detection. It comprises multi-branch receptive field
blocks to enhance the deep features learned from the
lightweight CNN backbone. The outputs from the
blocks are then combined via dense aggregation to
produce the final segmentation mask.
2.1.4 HSNet
The HSNet (Zhang et al., 2022) is a hybrid model
that combines CNN and Transformer. It features an
encoder-decoder architecture with the PVTv2 as the
encoder for extracting hierarchical low-level features
such as texture, color, and edge information. The
decoder consists of Hybrid semantic complementary
modules that operate in two branches. One branch
Comparison of CNN and Transformer Architectures for Robust Cattle Segmentation in Complex Farm Environments
93
Train set
CattleSegment
Dataset
(CS_v7)
HarDNet-MSEG
U-Net
DeepLabV3
HSNet
PVT
CAFE-Net
CNNs
Transformers
Test sets
Cattle_1000
Dataset
(C1000_v6)
Pre-trained models
Structure
Dice
BCE
Loss functions
CattleWeightDetection
Dataset
(BMGS_B3)
DSC
IoU
Evaluation
Fine tuning
Ensemble
Fusion
Figure 1: Schematic illustration of the proposed methodology for cattle segmentation in complex farm environments.
uses an improved self-attention module to learn long-
range dependencies; the other uses a convolutional
bottleneck architecture to model local feature details.
The HSNet also includes a cross-semantic attention
module, which acts as an intermediate transition mod-
ule, filtering noise and injecting low-level features
into the high-level semantics of the decoder to bridge
the semantic gap. Finally, the HSNet has a multi-scale
prediction module with learnable weights, integrating
the prediction results of different stages to retain se-
mantic information of different scales.
2.1.5 PVT
PVT (Dong et al., 2023) is a transformer-based model
comprising four essential modules: a PVT encoder,
cascaded fusion (CFM), camouflage identification
(CIM), and similarity aggregation (SAM) modules.
The PVT encoder captures multi-scale long-range de-
pendencies features to gather information from the
global context. The CFM aggregates high-level fea-
tures to collect semantic and location information of
the objects. The CIM enhances low-level represen-
tation information by removing noise and improving
texture, color, and edges. Lastly, the SAM combines
the low and high-level features from the CIM and
CFM to generate the final segmentation mask.
2.1.6 CAFE-Net
CAFE-Net (Liu et al., 2024) is a cross-attention and
feature exploration network that includes a PVT en-
coder and a cross-attention decoder. The PVT is re-
sponsible for extracting spatial and channel features,
while the decoder uses self-attention to establish long-
range dependencies of features and capture the in-
herent connection between them. The method also
employs feature supplement and exploration modules
made of convolutional layers to capture local context
information and bridge the semantic gap between the
encoder and decoder.
2.2 Loss Functions
2.2.1 Binary Cross Entropy (BCE)
BCE is a commonly used loss function for binary seg-
mentation tasks. In binary segmentation, the goal is
to classify each pixel of an image as either belong-
ing to an object or the background. The model pre-
dicts a probability map in which each pixel’s value
represents the likelihood of belonging to a class (e.g.,
class 1 for the object and class 0 for the background).
The target label for each pixel is either 0 or 1, and
the prediction is a continuous value between 0 and 1.
The BCE loss measures the error between each pixel’s
predicted probability and the actual binary label:
BCE(y, ˆy) = −
∑
[y·log( ˆy)+(1−y)·log(1−ˆy)]
N
(1)
where N is the total number of pixels in the image, y
is is the ground truth label and ˆy is the predicted prob-
ability, obtained as ˆy = σ(P), P represents the logits
and σ is the sigmoid function.
2.2.2 Dice Loss
Dice is also a widely used loss function in segmenta-
tion tasks. It calculates the overlap between the pre-
dicted segmentation and the ground truth by comput-
ing their similarity. It is derived from the Dice coef-
ICPRAM 2025 - 14th International Conference on Pattern Recognition Applications and Methods
94

ficient and aims to minimize the error between pre-
dicted and actual pixels:
Dice(y, ˆy) = 1 −
2 ·
∑
(y · ˆy)
∑
y +
∑
ˆy
, (2)
2.2.3 Structure Loss
The structure loss function (Nanni et al., 2022) com-
bines the weighted Intersection over Union (wIoU)
and weighted Binary Cross-Entropy (wBCE) losses
to optimize semantic segmentation. This combination
balances pixel-wise accuracy with structural align-
ment, enhancing segmentation performance, espe-
cially in challenging regions. It is defined as:
STR(y, ˆy) = wIoU(y, ˆy) + wBCE(y, ˆy) (3)
A weighting factor w is computed to emphasize
regions of higher complexity or uncertainty in the seg-
mentation:
w = 1 + 5 ×
|
AvgPool(y) − y
|
(4)
Then, the weighted binary cross-entropy (wBCE)
loss is formulated as:
wBCE(y, ˆy) = −
∑
[w·(y·log( ˆy)+(1−y)·log(1−ˆy))]
∑
w
(5)
This term measures pixel-wise discrepancy be-
tween the ground truth y and the predicted probability
ˆy, while assigning higher importance to challenging
regions based on the weighting factor w.
The weighted Intersection over Union (wIoU) loss
is defined as:
wIoU(y, ˆy) = 1 −
∑
[w · y · ˆy] + 1
∑
[w · (y + ˆy)] −
∑
[w · y · ˆy] + 1
(6)
This term evaluates the overlap between the pre-
dicted mask and the ground truth mask, penalizing
both false positives and false negatives, weighted by
w.
2.3 Performance Metrics
The performance of the proposed model was eval-
uated using commonly applied metrics for seman-
tic segmentation, including the Dice similarity coef-
ficient and intersection over union.
2.3.1 Dice Similarity Coefficient (DSC)
DSC is a commonly used metric for evaluating image
segmentation, especially when dealing with varying
sizes of shapes and areas of interest. It is calculated
as follows:
DSC =
2 × |A ∩ B|
|A| + |B|
, (7)
where A is the set of pixels belonging to the pre-
dicted mask, and B is the set of pixels belonging to
the ground truth mask. The intersection |A ∩ B| rep-
resents the common pixels between the predicted and
ground truth masks, and |A| + |B| is the total number
of pixels in both masks. The DSC ranges from 0 to
1, with 1 indicating perfect overlap between the pre-
dicted and ground truth masks.
2.3.2 Intersection over Union (IoU)
IoU measures the overlap between the predicted mask
and the ground truth. It is calculated as follows:
IoU =
|A ∩ B|
|A ∪ B|
, (8)
where |A ∩ B| refers to the common pixels shared by
the predicted and ground truth masks, while |A ∪ B| is
the total area covered by both masks. An IoU equal to
1 indicates that the predicted and ground truth masks
perfectly overlap, which signifies perfect segmenta-
tion.
2.4 Datasets
Our tests used three publicly available datasets: the
CattleSegment (CattleDetector, 2023), Cattle 1000
(Roldan, 2024), and CattleWeightDetection (Acme
AI Ltd. et al., 2024) dataset. Some examples of sam-
ples from these datasets are shown in Figure 2.
We provide the details of the datasets below:
• CattleSegment Dataset: We used the version v7
of this dataset (CS v7), which contains 1770 train-
ing images, 165 validation images, and 98 test im-
ages.
• Cattle 1000 Dataset: We used the version v6 of
this dataset (C1000 v6), which includes 1000 im-
ages, all of which were used exclusively as a test
set in the experiments.
• CattleWeightDetection Dataset: We used the
version B3 (BMGS B3), consisting of 2061 im-
ages, which was also employed exclusively as a
test set.
We used the CS v7 as a training set as it is the
most diverse dataset. We applied no additional data
augmentation, as the training set already included
images that had transformed. These augmentations
comprised horizontal flips, rotations ranging from -
25° to +25°, saturation adjustments between -25%
and +25%, and exposure adjustments within the same
range. Additionally, a portion of the dataset included
images acquired via infrared technology.
However, it is worth noting that only 1770 im-
ages make up the dataset, including those from the
Comparison of CNN and Transformer Architectures for Robust Cattle Segmentation in Complex Farm Environments
95
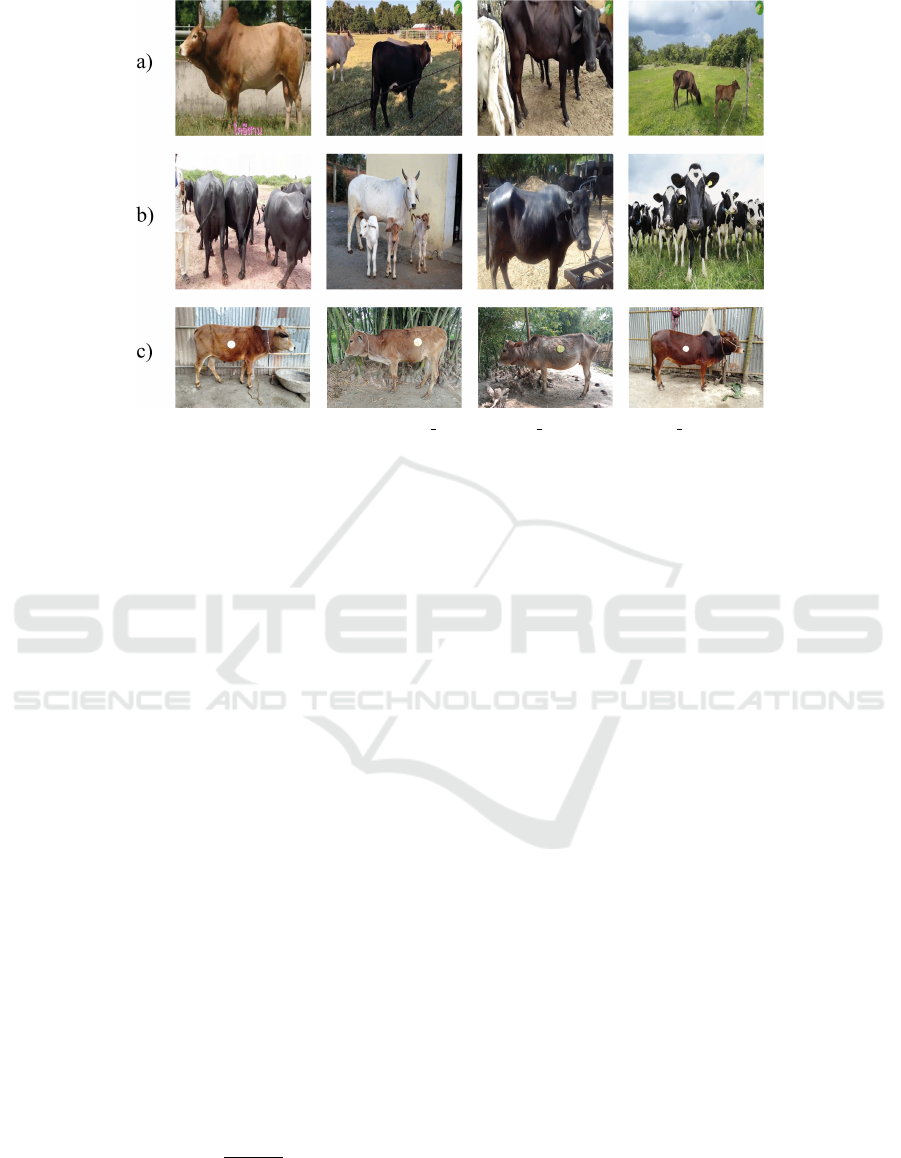
Figure 2: Examples of samples from the CS v7 (a), C1000 v6 (b), and BMGS B3 (c) dataset.
artificial augmentation. This fact represents a critical
challenge since it can cause the overfitting problem,
where the model memorizes the training data rather
than learning generalizable patterns. To mitigate this
issue, we used pre-trained models on the large Im-
ageNet dataset and fine-tuned them, enhancing their
capacity to distinguish cattle animals.
2.5 Ensemble Strategy
Ensembles have a long history in machine learn-
ing, and their advantage over single models is well-
documented, with evidence showing that ensembles
generally outperform individual classifiers (Kuncheva
and Whitaker, 2003). The key to their success lies in
combining diverse and accurate models with low cor-
relation, balancing diversity and accuracy. Deep en-
sembles benefit from underspecification, where func-
tionally different solutions of the same model can
serve as diverse ensemble components (Fort et al.,
2019).
To further improve the segmentation performance,
we employed an ensemble strategy that fused the pre-
dictions of pairs of models to enhance the overall ac-
curacy. We combined the methods’ predictions to
create the final segmentation mask. We selected the
best ensemble pairs based on the dissimilarity met-
ric, which measures the difference between the pre-
dictions of two models. It is calculated as follows:
Dis = 1 −
|A ∩ A
′
|
|A|
, (9)
where |A ∩ A
′
| refers to the number of pixels that are
predicted as belonging to the same class by both clas-
sifiers, while |A| = |A
′
| is the total number of pixels
in each mask. A Dis equal to 0 indicates that the pre-
dicted masks perfectly overlap.
2.6 Evaluation Protocol
We fine-tuned all the models over 100 epochs using a
constant learning rate of 0.0001, with a batch size of
15 and an input image size of 352 × 352 pixels. We
employed the AdamW optimizer to update the mod-
els’ parameters, ensuring effective weight decay reg-
ularization during training. We used the loss function
described in Section 2.2 for training. All models were
initialized with an encoder pre-trained on ImageNet
to ensure a fair comparison. Finally, consistent pa-
rameters were maintained across all models instead
of performing a grid search for hyperparameter opti-
mization. We implemented the proposed method us-
ing Python 3.9.16 and the PyTorch 1.13.1 API. All
experiments were conducted on a computer with a
12th Generation Intel® Core™ i7-12700 (2.10GHz),
an NVIDIA® GeForce RTX™ 3090 GPU, 64 GB of
RAM, and a 64-bit Windows operating system.
3 RESULTS
We conducted the experimental tests to compare the
different network architectures (Section 2.1) using the
performance indicators outlined in Section 2.3. We
investigated the noteworthy aspect of cross-dataset
performance, which involves testing the generaliza-
tion ability of the architectures by applying them to
different datasets and new kinds of data. This ap-
proach allows us to determine how well a model per-
ICPRAM 2025 - 14th International Conference on Pattern Recognition Applications and Methods
96

forms when tested on a separate, unseen dataset, high-
lighting its robustness and adaptability.
Tables 1, 2, and 3 present the DSC and IoU scores
of the network architectures on the test sets (CS v7,
C1000 v6, and BMGS B3) using BCE, Dice, and
STR loss functions, respectively. The tables also
show each architecture’s average (AVG) performance
across the three datasets. The best result for each test
is bolded and the second best is underlined. The first
noteworthy observation is the consistently high per-
formance achieved by all the tested methods in all
datasets, with only minor differences between them.
This performance indicates that all segmentation net-
works presented a relevant cross-dataset performance,
showing robustness against overfitting.
When using the BCE loss function (Table 1), the
CAFE-Net model consistently outperformed the other
architectures, achieving the highest DSC and IoU
scores across all datasets. It achieved an average DSC
of 0.9483 and an average IoU of 0.9151. The HSNet
model also produced competitive results, with an av-
erage DSC of 0.9459 and an average IoU of 0.9108.
The PVT model matched the HSNet’s average DSC
of 0.9459. A similar trend was observed when test-
ing with the STR loss function (Table 3). CAFE-Net
and PVT emerged as the best models in terms of DSC
and IoU scores, achieving average values of 0.9491
DSC, 0.9168 IoU for CAFE-Net, and 0.9457 DSC
and 0.9106 IoU for PVT.
Considering the Dice loss function (Table 2), the
best results were mixed between the architectures U-
Net, DeepLabV3, and CAFE-Net. The U-Net model
achieved the highest scores on the BMGS B3 dataset,
with a DSC of 0.9678 and an IoU of 0.9385. The
DeepLabV3 model achieved a DSC of 0.9327 and
an IoU of 0.9022 on the CS v7 dataset. The CAFE-
Net model achieved a DSC of 0.9369 and an IoU of
0.8906 on the C1000 v6 dataset. Despite the indi-
vidual best performance of these methods, the PVT
model achieved the highest average DSC and IoU
scores across all datasets, with an average DSC of
0.9450 and an average IoU of 0.8868. The CAFE-
Net achieved strong results, with an average DSC
of 0.9436 and an average IoU of 0.9066 across all
datasets. This model ranked second in both average
DSC and IoU scores.
Taking into account all models and loss functions,
it is possible to note that the highest performance
was provided by the CAFE-Net model with STR loss
function, with an average DSC of 0.9491 and an av-
erage IoU of 0.9168, followed by CAFE-Net with
BCE loss function, with an average DSC of 0.9483
and an average IoU of 0.9151. The PVT model with
Dice loss function was the third-best model, with
an average DSC of 0.9450 and an average IoU of
0.8868. The results demonstrate the effectiveness of
the transformer-based model in capturing long-range
dependencies and enhancing the segmentation accu-
racy of cattle in complex farm environments.
Table 4 shows the tested networks’ complexity
(number of parameters) and inference time. It is
important to note that the transformer-based models
have a similar number of parameters to the CNN-
based models, although they have a slightly higher
inference time. An interesting fact that can be high-
lighted is that HSNet and PVT have fewer parameters
than HarDNet-MSEG, with PVT having even less in-
ference time while achieving better results.
3.1 Ensemble Results
We selected all models trained with BCE, and for the
other losses, we only selected HSNet and CAFE-Net
(the top 2 performers based on BCE), and evaluated
the diversity among the models by calculating the dis-
similarity metric (Equation 9) for each pair of classi-
fiers on the validation set of CS v7. The results are
shown in Figure 3. The results show interestingly
high values of diversity for several model pairs, sug-
gesting that their combination might improve the ro-
bustness of model ensembles.
In Figure 4, we report the average DSC and IoU
scores for each pair of classifiers across three test
sets, with standalone results (single models) provided
along the diagonal. The best ensemble was obtained
by combining CAFE-Net (trained with STR loss), the
best standalone model, with PVT (trained with BCE).
Interestingly, PVT is not the second-best standalone
model but exhibits a high degree of diversity com-
pared to CAFE-Net. This two-model ensemble out-
performs all standalone methods.
4 DISCUSSION
The experimental results demonstrate the proposed
models’ effectiveness in segmenting cattle in com-
plex farm environments. The models achieved high
performance across all datasets, with the CAFE-Net
model consistently outperforming the other architec-
tures. The transformer-based models, particularly
CAFE-Net and PVT, demonstrated superior perfor-
mance to the CNN-based models, achieving the high-
est average DSC and IoU scores across all datasets.
The results indicate that the transformer-based models
are well-suited for capturing long-range dependencies
and enhancing the segmentation accuracy of cattle in
complex farm environments.
Comparison of CNN and Transformer Architectures for Robust Cattle Segmentation in Complex Farm Environments
97
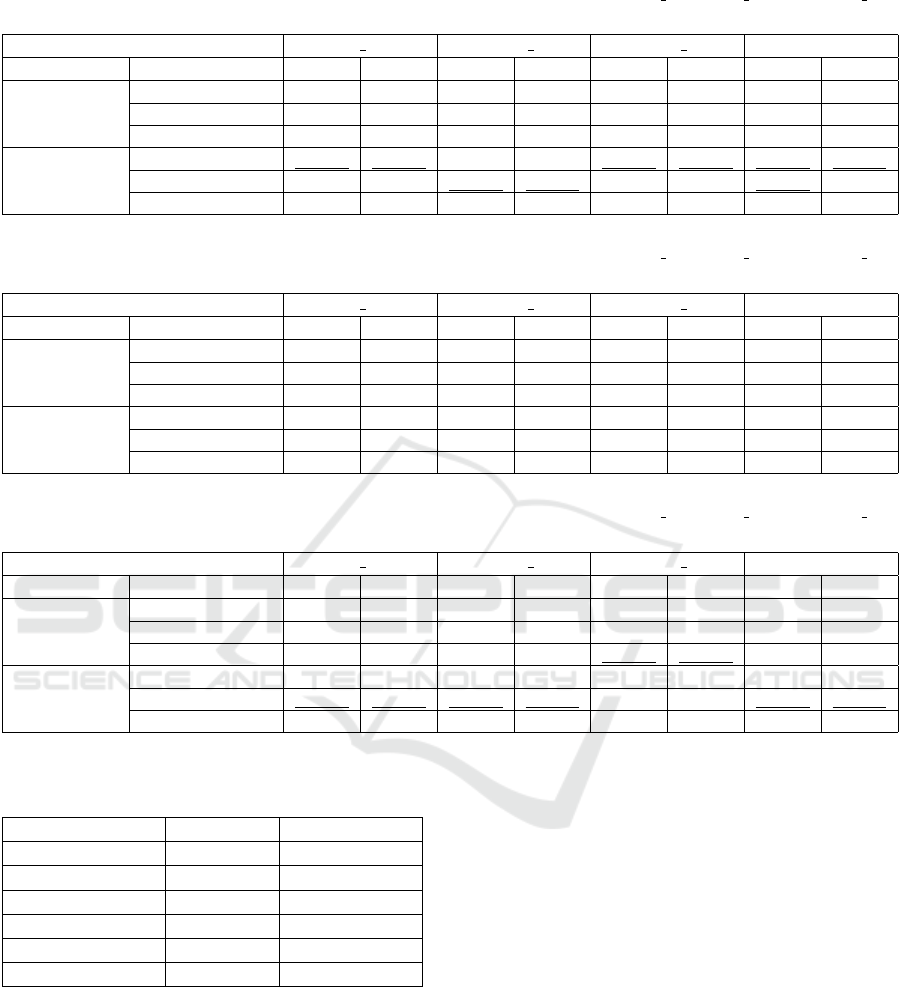
Table 1: DSC and IoU scores of different network architectures on different test sets (CS v7, C1000 v6, and BMGS B3),
along with the average, using the BCE loss function. The best result for each test is bolded, the second best is underlined.
BCE loss CS v7 C1000 v6 BMGS B3 AVG
Type Model DSC IOU DSC IOU DSC IOU DSC IOU
CNNs
U-Net 0.9335 0.9034 0.9238 0.8690 0.9626 0.9289 0.9400 0.9004
DeepLabV3 0.9329 0.9026 0.9248 0.8704 0.9620 0.9279 0.9399 0.9003
HarDNet-MSEG 0.9306 0.8985 0.9276 0.8748 0.9605 0.9252 0.9396 0.8995
Transformers
HSNet 0.9343 0.9050 0.9340 0.8858 0.9696 0.9416 0.9459 0.9108
PVT 0.9335 0.9034 0.9350 0.8868 0.9691 0.9408 0.9459 0.9103
CAFE-Net 0.9369 0.9099 0.9369 0.8906 0.9711 0.9447 0.9483 0.9151
Table 2: DSC and IoU scores of different network architectures on different test sets (CS v7, C1000 v6, and BMGS B3),
along with the average, using the Dice loss function. The best result for each test is bolded, the second best is underlined.
Dice loss CS v7 C1000 v6 BMGS B3 AVG
Type Model DSC IOU DSC IOU DSC IOU DSC IOU
CNNs
U-Net 0.9321 0.9011 0.9221 0.8667 0.9678 0.9385 0.9407 0.9021
DeepLabV3 0.9327 0.9022 0.9238 0.8691 0.9623 0.9284 0.9396 0.8999
HarDNet-MSEG 0.9308 0.8989 0.9262 0.8733 0.9628 0.9291 0.9399 0.9004
Transformers
HSNet 0.9302 0.8975 0.9312 0.8816 0.9664 0.9357 0.9426 0.9049
PVT 0.9318 0.9004 0.9327 0.8838 0.9666 0.9361 0.9437 0.9068
CAFE-Net 0.9311 0.8991 0.9330 0.8843 0.9668 0.9365 0.9436 0.9066
Table 3: DSC and IoU scores of different network architectures on different test sets (CS v7, C1000 v6, and BMGS B3),
along with the average, using the Structure loss function. The best result for each test is bolded, the second best is underlined.
STR loss CS v7 C1000 v6 BMGS B3 AVG
Type Model DSC IOU DSC IOU DSC IOU DSC IOU
CNNs
U-Net 0.9330 0.9027 0.9250 0.8704 0.9619 0.9277 0.9400 0.9003
DeepLabV3 0.9336 0.9037 0.9230 0.8683 0.9656 0.9343 0.9407 0.9021
HarDNet-MSEG 0.9350 0.9066 0.9270 0.8737 0.9712 0.9447 0.9444 0.9083
Transformers
HSNet 0.9299 0.8975 0.9316 0.8830 0.9612 0.9263 0.9409 0.9023
PVT 0.9337 0.9038 0.9331 0.8845 0.9705 0.9434 0.9457 0.9106
CAFE-Net 0.9375 0.9109 0.9361 0.8898 0.9738 0.9497 0.9491 0.9168
Table 4: Complexity (number of parameters), and inference
time (in seconds) of the tested networks.
Parameters Inference time
U-Net 24M .0127
DeepLabV3 27M .0137
HarDNet-MSEG 33M .0228
HSNet 30M .026
PVT 25M .0209
CAFE-Net 36M .0304
The ensemble strategy further improved the seg-
mentation performance, with the best ensemble pair
outperforming all standalone models. The results sug-
gest that combining diverse and accurate models with
low correlation can enhance the overall accuracy of
the segmentation task. The ensemble strategy effec-
tively leveraged the diversity among the models, re-
sulting in a more robust and accurate segmentation.
Some visual examples of the segmentation results
obtained in our experiments are reported in Figure 5,
along with the effects of network fusion. Each row of
the figure reports an example image of the test set, the
segmentation obtained by CAFE-Net (Structure) and
PVT (BCE), and the results of their fusion. While
network fusion does not always improve the perfor-
mance of individual methods, it is generally capable
of correcting the errors made by the individual clas-
sifiers. The images highlight how the combination of
outputs, guided by the diversity principle, can lead to
more robust segmentation results in many cases.
Additionally, a visual analysis of the leading
causes of errors revealed that the segmentation ground
truth associated with some test images is incorrect, as
shown in Figure 6. In particular, some elements were
not properly labeled. However, despite the variable
scale, the proposed solutions could correctly identify
most of the cattle. Similarly, other cases of incorrect
ground truth have been visually identified in the test
set. The performance would, therefore, be undoubt-
edly higher if evaluated on a dataset free of errors.
ICPRAM 2025 - 14th International Conference on Pattern Recognition Applications and Methods
98
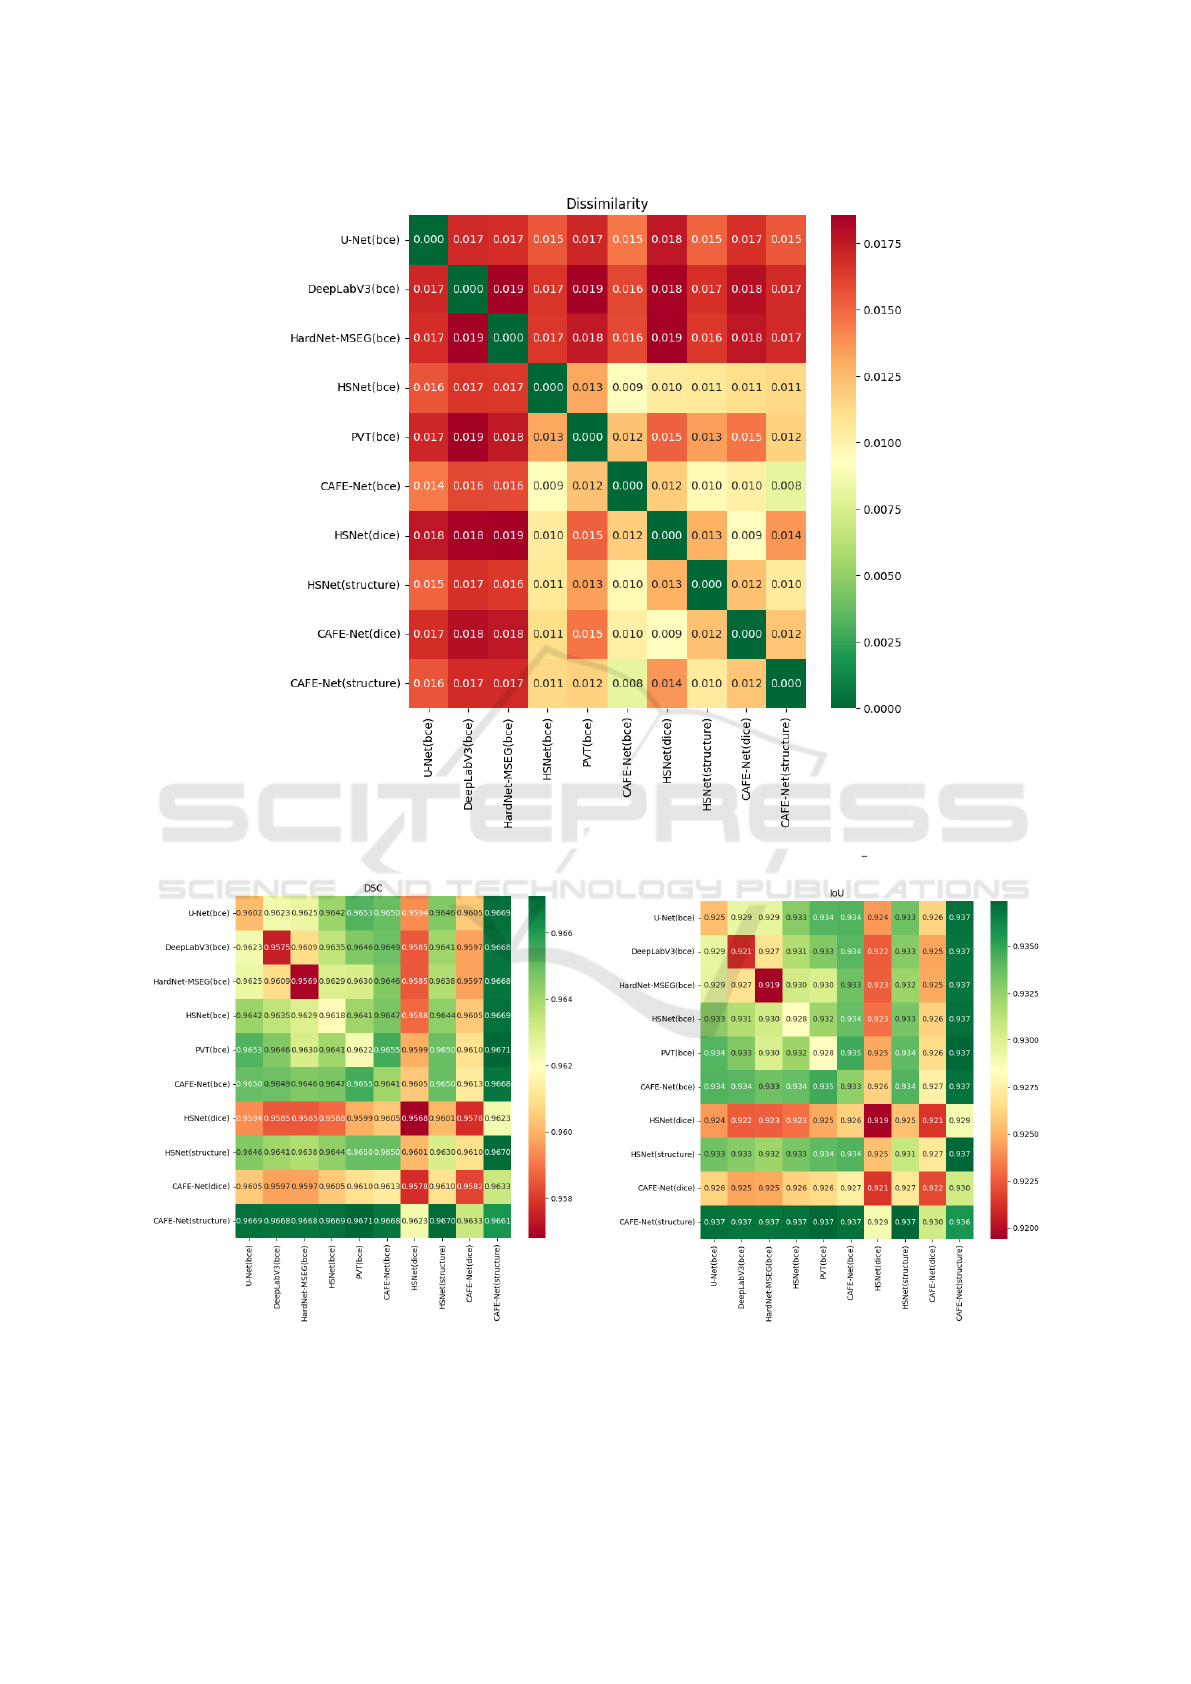
Figure 3: Dissimilarity among couple of classifiers on the validation set of CS v7.
(a) DSC. (b) IoU.
Figure 4: DSC and IoU of ensembles (AVG on the 3 test sets).
Comparison of CNN and Transformer Architectures for Robust Cattle Segmentation in Complex Farm Environments
99

Original Image
CAFE-Net
PVT
Fusion
Figure 5: Segmentation results on the CS v7 dataset; each line contains original images, result from CAFE-Net (structure
loss), PVT (BCE loss) and their fusion. False-positive pixels are in red, while the false negatives are in blue.
Another possible cause of errors is related to the
fact that the segmentation masks may miss some
small cattle. However, the best networks are very pre-
cise for foreground subjects. It is worth noting that
for applications such as animal weight estimation, the
test case of interest is a single animal that is usually
well-framed to allow for precise measurements, such
as the images in BMGS B3, where the proposed ar-
chitectures perform very well.
5 CONCLUSIONS
This paper evaluated several state-of-the-art
deep learning architectures, including CNN and
transformer-based models, for cattle segmentation
in complex farm environments. Through extensive
experiments across multiple datasets, we demon-
strated that the transformer models consistently
outperform the CNN-based models, showing robust
performance across different test sets. These models
ICPRAM 2025 - 14th International Conference on Pattern Recognition Applications and Methods
100
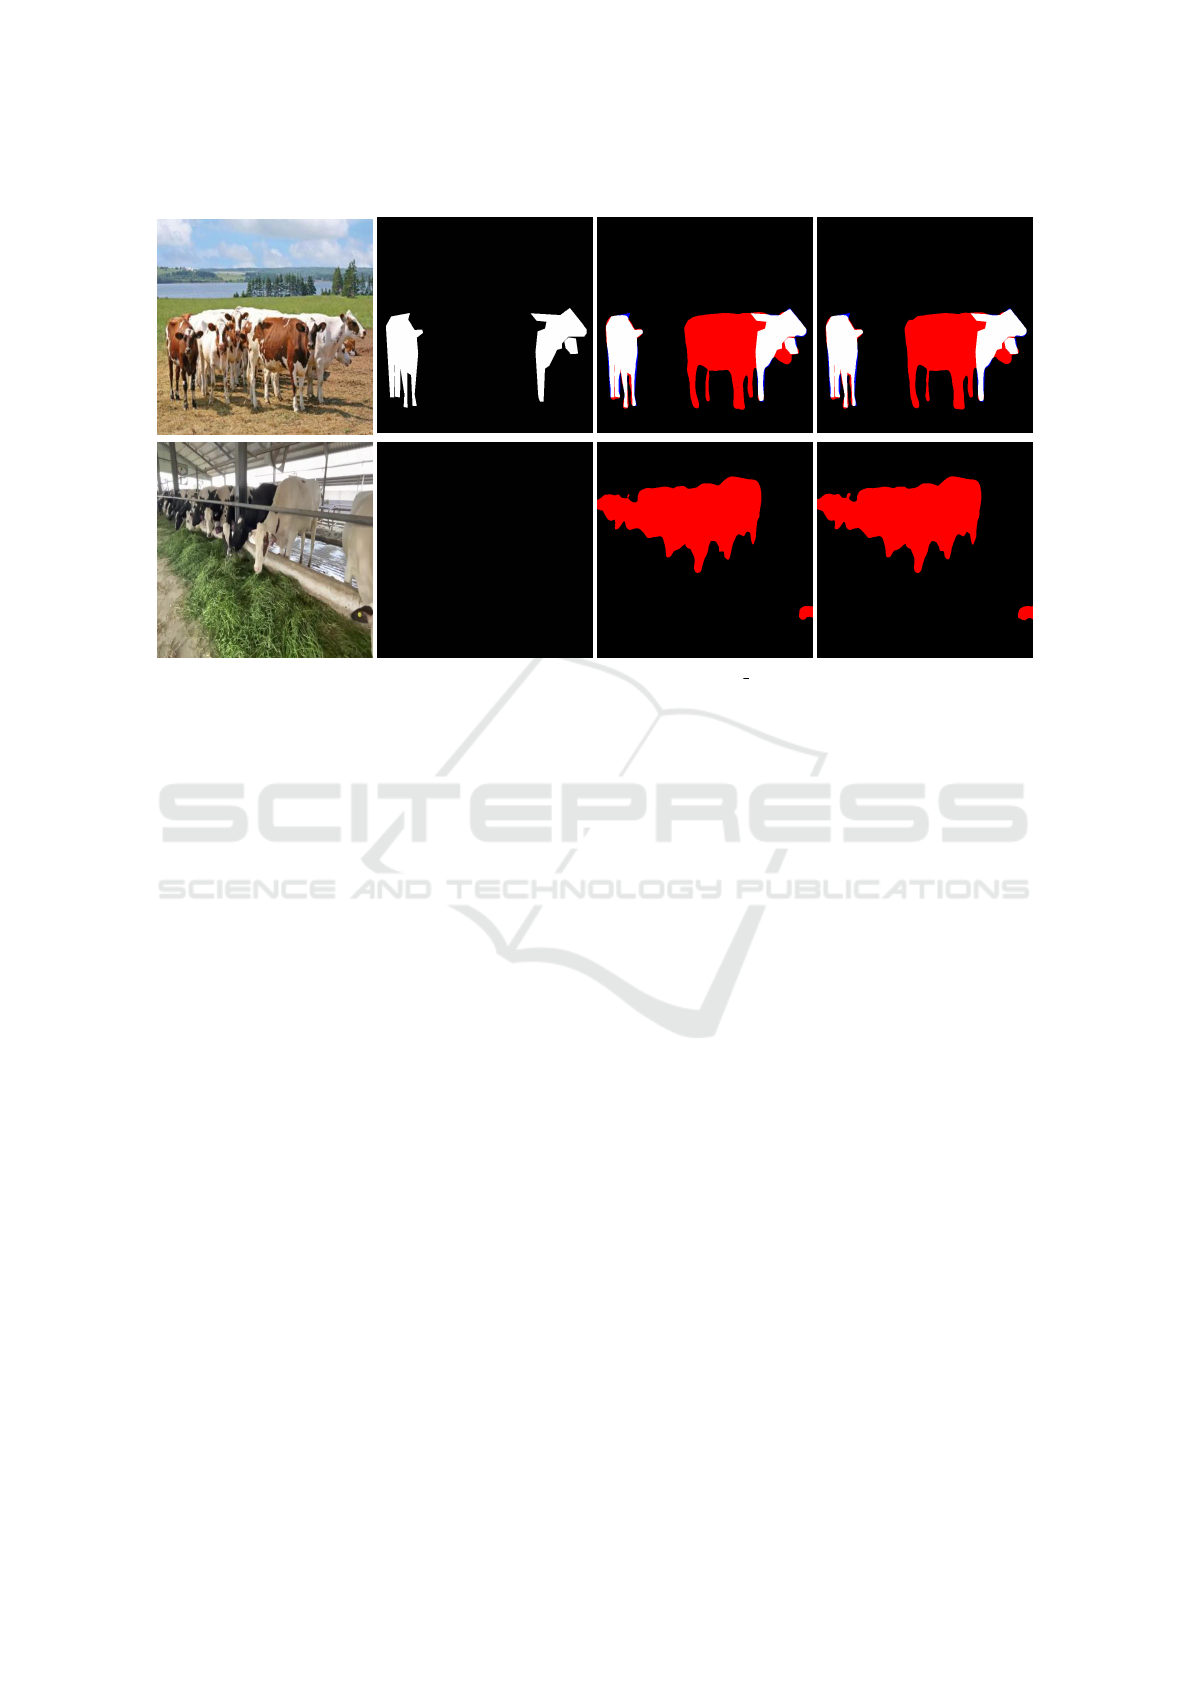
Original Image
Ground Truth
Result from CAFE-Net
Fusion results
Figure 6: Errors in dataset labelling (images from CS v7 test set).
maintain high segmentation accuracy, even in cross-
dataset evaluations, highlighting their generalization
capabilities.
Further analysis of different loss functions re-
vealed that BCE and Structure loss functions deliver
slightly better results than Dice loss, although the
overall segmentation task is relatively straightforward
due to the simplicity of the cattle’s body shape and
outline.
In addition, we explored the use of ensemble mod-
els, selecting pairs of networks with maximum di-
versity. The results are particularly promising, as an
ensemble of only two models significantly improves
segmentation performance over all stand-alone net-
works, demonstrating the potential of this approach
for enhancing accuracy in challenging farm environ-
ments.
The robustness of these models makes them well-
suited for practical applications such as livestock
monitoring, weight estimation, and behavior analy-
sis in real-world farm conditions. Our future research
will focus on applying our segmentation networks for
such complex tasks.
ACKNOWLEDGEMENTS
This study was carried out within the Agritech
National Research Center and received funding
from the European Union Next-GenerationEU (PI-
ANO NAZIONALE DI RIPRESA E RESILIENZA
(PNRR)—MISSIONE 4 COMPONENTE 2, IN-
VESTIMENTO 1.4—D.D. 1032 17/06/2022,
CN00000022). This manuscript reflects only the
authors’ views and opinions, neither the Euro-
pean Union nor the European Commission can be
considered responsible for them.
REFERENCES
Acme AI Ltd., Roomy, S., Nayem, A. B. S., Ton-
moy, A. M., Islam, S. M. S., and Islam, M. M.
(2024). Cattle weight detection model + dataset
(12k˜). https://www.kaggle.com/dsv/8858637.
Bello, R.-W., Mohamed, A. S. A., and Talib, A. Z. (2021).
Contour extraction of individual cattle from an im-
age using enhanced mask r-cnn instance segmentation
method. IEEE Access, 9:56984–57000.
Borges Oliveira, D. A., Ribeiro Pereira, L. G., Bresolin,
T., Pontes Ferreira, R. E., and Reboucas Dorea, J. R.
(2021). A review of deep learning algorithms for com-
puter vision systems in livestock. Livestock Science,
253:104700.
CattleDetector (2023). Cattlesegment dataset.
universe.roboflow.com/cattledetector/cattlesegment-
60nea. visited on 2024-09-30.
Chen, L.-C. (2017). Rethinking atrous convolution
for semantic image segmentation. arXiv preprint
arXiv:1706.05587.
Dong, B., Wang, W., Fan, D.-P., Li, J., Fu, H., and Shao,
L. (2023). Polyp-pvt: Polyp segmentation with pyra-
mid vision transformers. CAAI Artificial Intelligence
Research, 2:9150015.
Feng, T., Guo, Y., Huang, X., and Qiao, Y. (2023). Cat-
Comparison of CNN and Transformer Architectures for Robust Cattle Segmentation in Complex Farm Environments
101

tle target segmentation method in multi-scenes using
improved deeplabv3+ method. Animals, 13(15).
Fort, S., Hu, H., and Lakshminarayanan, B. (2019). Deep
ensembles: A loss landscape perspective. arXiv
preprint arXiv:1912.02757.
Huang, C.-H., Wu, H.-Y., and Lin, Y.-L. (2021). HarDNet-
MSEG: A simple encoder-decoder polyp segmenta-
tion neural network that achieves over 0.9 mean Dice
and 86 FPS.
Kuncheva, L. I. and Whitaker, C. J. (2003). Measures of
diversity in classifier ensembles and their relationship
with the ensemble accuracy. Machine Learning.
Lee, C.-b., Lee, H.-s., and Cho, H.-c. (2023). Cattle weight
estimation using fully and weakly supervised segmen-
tation from 2d images. Applied Sciences, 13(5).
Liu, G., Yao, S., Liu, D., Chang, B., Chen, Z., Wang, J., and
Wei, J. (2024). Cafe-net: Cross-attention and feature
exploration network for polyp segmentation. Expert
Systems with Applications, 238:121754.
Nanni, L., Lumini, A., Loreggia, A., Formaggio, A., and
Cuza, D. (2022). An empirical study on ensemble of
segmentation approaches. Signals, 3(2):341–358.
Qiao, Y., Truman, M., and Sukkarieh, S. (2019). Cattle
segmentation and contour extraction based on mask r-
cnn for precision livestock farming. Computers and
Electronics in Agriculture, 165:104958.
Roldan, D. (2024). Cattle 1000 dataset. visited on 2024-
09-30.
Ronneberger, O., Fischer, P., and Brox, T. (2015). U-
net: Convolutional networks for biomedical image
segmentation. In Medical image computing and
computer-assisted intervention–MICCAI 2015: 18th
international conference, Munich, Germany, October
5-9, 2015, proceedings, part III 18, pages 234–241.
Springer.
Wu, D., Yin, X., Jiang, B., Jiang, M., Li, Z., and Song,
H. (2020). Detection of the respiratory rate of stand-
ing cows by combining the deeplab v3+ semantic seg-
mentation model with the phase-based video magni-
fication algorithm. Biosystems Engineering, 192:72–
89.
Zhang, W., Fu, C., Zheng, Y., Zhang, F., Zhao, Y., and
Sham, C.-W. (2022). Hsnet: A hybrid semantic net-
work for polyp segmentation. Computers in Biology
and Medicine, 150:106173.
ICPRAM 2025 - 14th International Conference on Pattern Recognition Applications and Methods
102
