
Identifying Inflammatory Bowel Disease-Associated Gene Ontology
Groups Using Biological Knowledge-Based Machine Learning
Nur Sebnem Ersoz
1a
, Burcu Bakir-Gungor
2,3 b
and Malik Yousef
4,5 c
1
Department of Bioengineering, Graduate School of Engineering and Science, Abdullah Gul University, Kayseri, Turkey
2
Department of Computer Engineering, Faculty of Engineering, Abdullah Gul University, Kayseri, 38080, Turkey
3
Department of Bioengineering, Faculty of Life and Natural Sciences, Abdullah Gul University, Kayseri, Turkey
4
Department of Information Systems, Zefat Academic College, Zefat, Israel
5
Galilee Digital Health Research Center (GDH), Zefat Academic College, Zefat, Israel
Keywords: Inflammatory Bowel Disease, Transcriptomic Data Analysis, Machine Learning, Grouping Based Feature
Selection.
Abstract: Inflammatory bowel disease (IBD) is a chronic inflammatory disease. Complex pathogenesis behind disease
formation and progression necessitated the development of new approaches to identify disease related genes
and affected gene ontology (GO) terms. In this study, via exploiting GeNetOntology method, we have
reanalysed a gene expression data including Crohn’s Disease (CD) and Ulcerative colitis (UC) patients and
controls. In order to identify IBD related genes and affected GO terms, GeNetOntology uses GO hierarchy as
the biological domain knowledge while performing gene expression data analysis based on machine learning
(ML). In the training part of GeNetOntology, genes annotated with selected ontology terms have been utilized
to perform a two-class classification task which generates an important set of ontologies as an output. IBD
data samples were obtained from peripheral blood and colon tissue. In order to investigate the effect of
different collection sites, IBD data have been analysed under different scenarios; i.e., all samples, only tissue
samples and only blood samples. Experimental findings indicate that GeNetOntology can successfully
determine significant disease-related ontology terms. Performance of the model slightly differs according to
the sample source. Via analysing the differences/commonalities between affected gene ontologies under
different scenarios, we attempt to enlighten IBD development mechanisms.
1 INTRODUCTION
Inflammatory bowel disease (IBD) is characterized
by chronic relapsing intestinal inflammation and it
encompasses Ulcerative Colitis (UC) and Crohn’s
Disease (CD). Its increasing incidence resulted in a
worldwide health-care problem. IBD has serious
effects and cannot be suppressed easily unlike other
inflammatory diseases. When the immune system is
stimulated, and some part of the intestine is
destroyed, it results in fever, diarrhea and pain. The
symptoms of UC and CD are similar. Since the small
intestine is responsible for the absorption of nutrients,
a damage in the small intestine by the CD results in
malnutrition in several cases (Seyedian et al., 2019).
a
https://orcid.org/0000-0003-3343-9936
b
https://orcid.org/0000-0002-2272-6270
c
https://orcid.org/0000-0001-8780-6303
An abnormal and sustained immune response to gut
microbiome also causes IBD. The main reason for
IBD remains unclear, however it is known that IBD
is caused by complex interaction of immune
responses to genetic and environmental factors such
as geographical location, inappropriate diet.
Environmental and microbial factors might interact,
regulate genetic factors and finally lead to IBD
pathogenesis (Zhang & Li, 2014). Although it is
known that adaptive immune response has a major
role in IBD pathogenesis, innate immune response
also has an effect on inducing gut inflammation with
the genetic and environmental factors. It is predicted
that IBD will become one of the major health
problems all around the world (Seyedian et al., 2019).
586
Ersoz, N. S., Bakir-Gungor, B. and Yousef, M.
Identifying Inflammatory Bowel Disease-Associated Gene Ontology Groups Using Biological Knowledge-Based Machine Learning.
DOI: 10.5220/0013178400003911
Paper published under CC license (CC BY-NC-ND 4.0)
In Proceedings of the 18th International Joint Conference on Biomedical Engineering Systems and Technologies (BIOSTEC 2025) - Volume 1, pages 586-593
ISBN: 978-989-758-731-3; ISSN: 2184-4305
Proceedings Copyright © 2025 by SCITEPRESS – Science and Technology Publications, Lda.

Therefore, it is vital to investigate IBD biomarkers for
early diagnosis, development of new treatment
strategies and eliminate medical implications for IBD
patients.
In the literature, many studies have been
performed using different traditional feature selection
(TFS) methods (Albattah et al., 2022). TFS methods
mainly rely on statistical analysis and ranking each
feature individually, then it either eliminates lower
ranked features or retains highly ranked features.
During the selection process, TFS neglects biological
domain knowledge about the features. On the other
hand, elimination and retention of features on an
individual basis ignores dependence and correlation
among features (Kuzudisli et al., 2023). Therefore,
the result might include redundant and irrelevant
features due to not efficiently detected correlations
between features. Therefore, integrative gene
selection approaches have been developed lately.
During gene expression data analysis, these
approaches incorporate biological domain knowledge
from external resources (Kuzudisli et al., 2023;
Yousef, Kumar, et al., 2021). The integrative gene
selection process creates a list of ranked groups of
genes based on both biological background
information (gene ontology, interactions, pathways
etc.) and statistical metrics (Perscheid, 2021).
Biological knowledge can be obtained from
different repositories, databases and resources such as
The Cancer Genome Atlas (TCGA) (Tomczak et al.,
2015), Kyoto Encyclopedia of Genes and Genomes
(KEGG) (Kanehisa & Goto, 2000), miRTarbase
(Chou et al., 2018), DisGeNET and Gene Ontology
(GO) (Ashburner et al., 2000). They provide
information about pathway knowledge, oncogenic
expression profile, miRNA–target interactions, and
organized aspects on the genes and diseases and gene
functions and products. GO is created by the GO
Consortium to present a well-categorized, organized
terminology in order to define the gene functions and
products. All information found in the GO are
presented with their standardized codes,
computational analysis evidence codes. GO covers
three main aspects of genes; biological process (BP)
which provides information about molecular-level
process of the gene product; cellular component (CC)
represents the cellular localization of the gene
product; and lastly molecular function (MF)
represents molecular level activity of a gene product.
Recently, the Grouping–Scoring–Modeling (G-
S-M) approach has been proposed to integrate
biological domain knowledge into the machine
learning (ML) model (Yousef et al., 2024). The G-S-
M ML approach selects groups of features where
different groups can be generated via 1) using pre-
existing biological knowledge stored in a database, or
2) fully data-driven approach using statistical
measures. The G-S-M approach has been utilized in
the development of different computational tools
such as CogNet (Yousef, Ülgen, et al., 2021), maTE
(Yousef et al., 2019), PriPath (Yousef, Ozdemir, et
al., 2022), miRModuleNet (Yousef, Goy, et al.,
2022), miRcorrNet (Yousef, Goy, et al., 2021),
TextNetTopics (Yousef & Voskergian, 2022),
GediNet (Qumsiyeh et al., 2022), miRGediNet
(Qumsiyeh et al., 2023), mirDisNet (Jabeer et al.,
2023), microBiomeGSM, miRcorrNetPro (Yazici et
al., 2023), GeNetOntology (Ersoz et al., 2023). These
G-S-M tools use external biological information from
different sources; KEGG pathways, GO terms and
DisGeNet. Among those, GeNetOntology utilizes
GO as external biological information to improve its
classification performance during the most relevant
gene selection from gene expression datasets.
In this study, we incorporated GO external
biological knowledge into the GeNetOntology
selection process to detect IBD signatures and novel
GO groups.
2 MATERIALS AND METHODS
2.1 Gene Expression Dataset
In this study, a publicly available IBD-associated
gene expression dataset (GSE126124) was obtained
from Gene Expression Omnibus (GEO). This dataset
includes transcriptome-wide mRNA profiling of IBD
and non-IBD (control) samples, which are obtained
from colon biopsies and pairedwhole blood samples
of ninety-eight children aged between 8-18 (Palmer
et al., 2019). Peripheral blood samples were obtained
from 98 patients and colon biopsy samples were
obtained from 78 of these patients (Table 1). 39
patients diagnosed with CD, 18 patients diagnosed
with UC and 2 patients were IBD unclassified
(IBDU).
2.2 Gene Ontology Data
The GO database maintains the biological domain
knowledge. In this study the information stored in GO
database was used for the grouping component of the
ML model. The GO data was downloaded from
Molecular Signature Database (GSEA | MSigDB |
Browse Human Gene Setsgui). GO BP (7.646 terms),
GO CC (1.101 terms) and GO MF (1.789 terms) were
included in this study.
Identifying Inflammatory Bowel Disease-Associated Gene Ontology Groups Using Biological Knowledge-Based Machine Learning
587
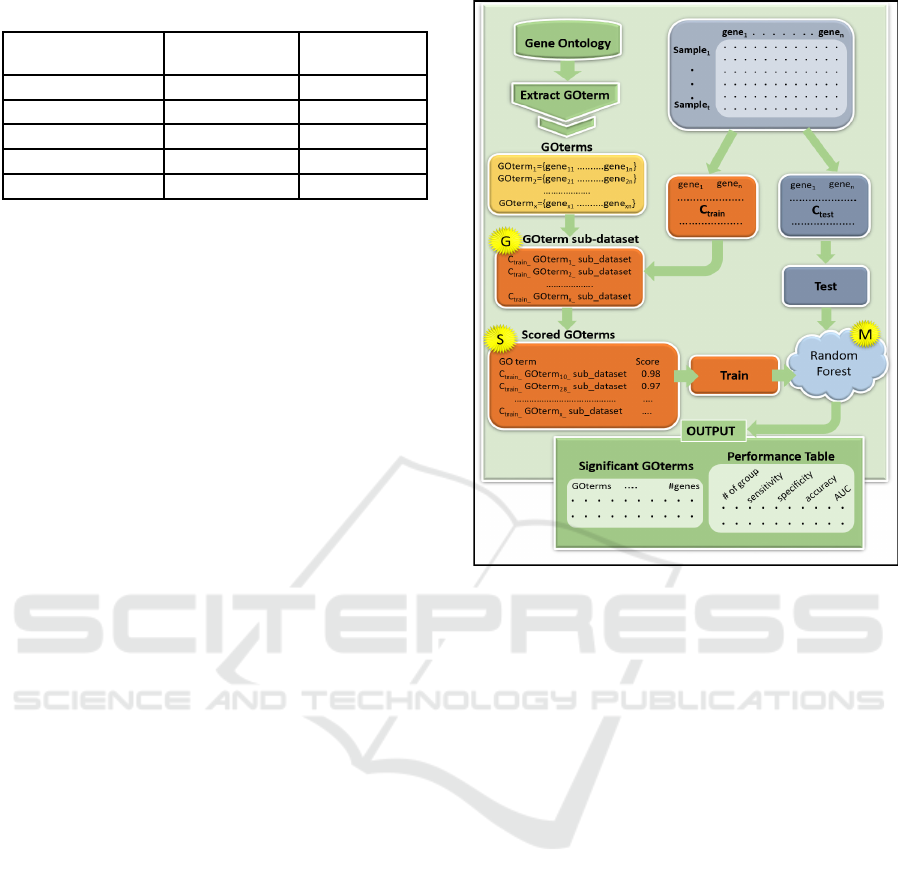
Table 1: Detailed description of GSE126124 IBD dataset.
# of Peripheral
Blood Sam
p
le
# of Colon
Tissue Sam
p
le
CD (pos) 39 37
UC (pos) 18 18
IBDU (pos) 2 2
control (neg) 39 21
total 98 78
2.3 GeNetOntology Approach
G-S-M approach performs the scoring process for a
group of features, instead of scoring and evaluating
features individually. Biological information is used
to create feature groups, where each group contains
different features. To this end, GeNetOntology (Ersoz
et al., 2023) has been developed based on the G-S-M
approach utilizing GO terms to identify disease
related ontology groups. GeNetOntology has three
main components; G, S and M (Figure 1).
The component G extracts related sub-datasets for
each GO term group from the original data with its
related sample labels (positive and negative).
Component S scores GO terms and component M
trains the classifier such as Random Forest in order to
build the model. After that, GeNetOntology detects
the significant GO terms which were scored in the
component S to be used for training the classifier in
the component M. We have evaluated the
performance of the GeNetOntology via using
different statistical measures; i.e., accuracy,
sensitivity, specificity. Following formulations were
used to calculate performance metrics: Accuracy =
(TP + TN)/#All examples, Sensitivity = TP/(TP +
FN), and Specificity = TN/(TN + FP) (True Positive
(TP), True Negative (TN), False Negative (FN) and
False Positive (FP)). The utilization of the area under
the receiver operating characteristic (ROC) curve
(AUC) is aimed at estimating the likelihood of a
classifier to score on randomly chosen positive
samples compared to randomly chosen negative
samples. Performance measures show average of 10-
fold MCCV (Table 2). We performed an under-
sampling approach to reduce the bias and control the
imbalanced class distribution problem.
3 RESULTS AND DISCUSSION
3.1 Model Performance Evaluation of
GeNetOntology on IBD Dataset
In order to analyse the IBD gene expression dataset,
Figure. 1: GeNetOntology workflow.
GeNetOntology approach is used. The characteristics
of the IBD dataset are shown in Table 1. For the
present analysis, we have tested GeNetOntology
using terms in 1) BP; 2) CC; and 3) MF categories via
including all samples from IBD gene expression
dataset, only blood samples and only tissue samples.
We have analyzed all IBD dataset including 176
samples (116 pos (IBD) and 60 neg (non-IBD) by
GeNetOntology approach. To see the differences in
performance metrics and identified IBD associated
gene ontology groups according to sample source, we
have analyzed the 98 blood samples (including 59 pos
(IBD), 39 neg (non-IBD)) and 78 tissue samples
(including 57 pos (IBD) and 21 neg (non-IBD))
separately using GeNetOntology and three different
GO categories, i.e., BP, CC, MF. Figure 2
summarizes the performance metrics obtained from
all samples, blood samples and tissue samples using
only the top two scoring GO terms. AUC, accuracy,
and sensitivity and specificity values differ according
to the sample categories in the IBD dataset on three
different GO categories; BP, CC, MF. As it is seen
from Figure 2, in general, blood samples have the
lowest performance metrics on BP, while it has the
highest performance metrics in MF. Unlike, tissue
samples have highest performance metrics on CC and
similar performance metrics on BP.
BIOINFORMATICS 2025 - 16th International Conference on Bioinformatics Models, Methods and Algorithms
588

Table 2: Model performance of GeNetOntology for the top
10 scoring GO BP terms obtained from IBD transcriptomic
dataset which includes both blood and tissue samples.
# of
Grou
p
s
# of
Genes
Accura
c
y
Sensitivi
t
y
Specifi
cit
y
AUC
10 391.4 0.82 0.88 0.70 0.91
9 370.5 0.82 0.87 0.73 0.91
8 353.5 0.81 0.87 0.68 0.90
7 316.3 0.83 0.91 0.68 0.92
6 293.1 0.82 0.89 0.68 0.92
5 241.4 0.81 0.88 0.67 0.90
4 218.6 0.81 0.89 0.65 0.90
3 154.5 0.84 0.90 0.72 0.91
2 122.5 0.84 0.89 0.73 0.91
1 62.3 0.8 0.85 0.7 0.88
For different numbers of feature sets, the AUC,
accuracy, sensitivity and specificity values have been
calculated as the mean of the performance metrics
when GeNetOntology is applied on the IBD dataset
using 10-fold MCCV. Table 2 presents performance
metrics of GeNetOntology applied on the IBD gene
expression dataset which includes both blood and
tissue samples. The top 10 scoring GO BP terms are
included in the analysis. GeNetOntology reports the
number of features; number of genes included in the
GO term for each feature set. In the second column of
Table 2, the average number of genes over 10
iterations has been shown. For example, as shown in
Table 2, there are 62.3 genes on average as shown in
the # of Genes column of the last row, and 122.5
genes on average as shown in the # of Genes column
of the 2nd last row. In other words, the model that is
generated using the gene expression values of 62.3
genes are able to predict IBD with 0.88 AUC score.
3.2 Comparative Performance
Evaluation of GeNetOntology with
PriPath on IBD Dataset
Pripath (Yousef, Ozdemir, et al., 2022) is another G-
S-M-based tool that incorporates KEGG pathways as
the biological domain knowledge to detect
dysregulated pathways. PriPath uses KEGG
pathways as the grouping information and selects the
most significant KEGG pathways in transcriptomic
Figure 2: GeNetOntology performance evaluation metrics
obtained from different sample sources; i.e., all samples,
peripheral blood samples and colon tissue samples.
data by inserting KEGG pathway information into the
ML algorithm. PriPath is tested on the same IBD gene
expression dataset. For the IBD dataset, for different
numbers of feature sets, the AUC, accuracy,
specificity and sensitivity values have been calculated
as the mean of the performance metrics obtained in
10 iterations of the cross-validation procedure. The
performance metrics of PriPath for the top 10 scoring
KEGG pathway terms are obtained from all IBD
dataset, only tissue samples and only blood samples.
PriPath reports the number of features (i.e., number
of genes) included in the set (i.e., KEGG pathway) for
each feature set. Figure 3(A) summarizes the
performance metrics obtained from all IBD dataset,
only blood samples and only tissue samples using top
two scoring KEGG pathways. In general, blood
samples have the lowest performance results while
tissue samples have the highest performance metrics
in PriPath. On the other hand, GeNetOntology
performs prediction using a high amount of genes
while PriPath is able to perform prediction using
lesser number of genes (Figure 3B). These findings
emphasize the complementary strengths of PriPath
and GeNetOntology. While GeNetOntology
effectively utilizes GO genes to enhance predictive
accuracy, PriPath uses KEGG pathways. Each
biological domain knowledge has a different set of
groups and terms. Therefore, number of samples in
output of each group shows differences in terms of
Identifying Inflammatory Bowel Disease-Associated Gene Ontology Groups Using Biological Knowledge-Based Machine Learning
589
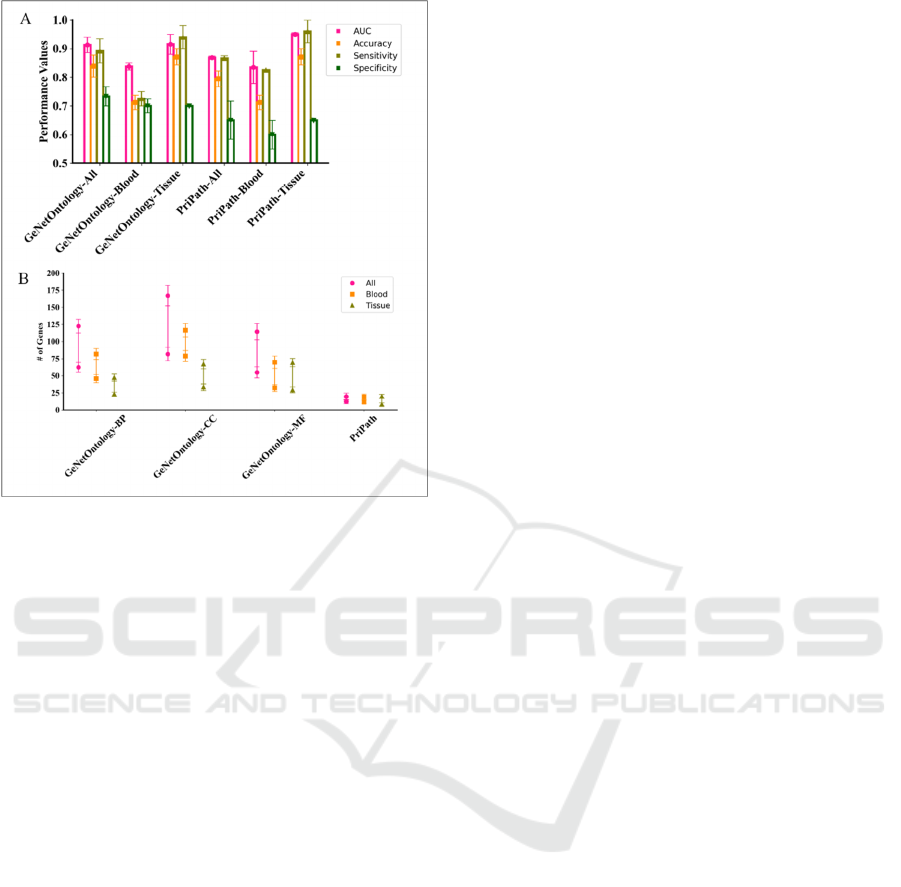
Figure 3: Comparative performance evaluations of
GeNetOntology and PriPath using 10-fold MCCV. (A)
Performance metrics of GeNetOntology is obtained on all
IBD dataset using GO BP category. Performance evaluation
of PriPath on IBD dataset all, blood and tissue samples for
the top two scoring groups. (B) Average number of genes
are plotted for GeNetOntology, and PriPath applied on IBD
gene expression datasets including all samples, blood
samples and tissue samples for top two scoring groups.
grouping function. However, minimizing number of
features were crucial to reduce computational
complexity or enhance interpretability. Overall, the
comparison between PriPath and GeNetOntology on
the IBD dataset shows the importance of considering
different types of biological knowledge into machine
learning models. These tools can provide insights into
disease mechanisms and improve predictive
modeling by leveraging pathway information and
gene ontology terms. Understanding the distinct
advantages of each approach can guide the selection
of appropriate methods for specific research.
3.3 Comparatively Performance
Evaluation of GeNetOntology with
Traditional Feature Selection
Methods
We also performed comparative analysis of TFS
methods; XGB, SKB, IG, FCBF, MRMR, CMIM
with different classifiers; Random Forest (RF),
XGBoost, DT, LogitBoost, SVM_opt, Adaboost,
Stack_LogitBoost_Kmeans, Stack_SVM_Kmeans
(Figure 4). To perform a comparative performance
evaluation with GeNetOntology (Table 2), 62
features have been selected for TFS methods using
the IBD dataset. For each TFS methods, different
classifiers were performed with 10-fold MCCV. In
our previously studies, we showed that RF performs
higher than other classifiers. Therefore, we have
generated GSM based tools using RF classifier. As it
is demonstrated in Figure 4, different classifiers have
different performance results on different TFS
methods. RF results of the IBD dataset for 62 features
are 0.82, 0.90, 0.89, 0.56, 0.52 and 0.80 for XGB,
SKB, IG, MRMR, FCBF and CMIM respectively
while GeNetOntoloy has 0.88 AUC value. According
to performance results, XGB, SKB, and IG are the top
highest AUC scored TFS methods. This comparative
analysis highlights the efficacy of GeNetOntology in
identifying significant features with high predictive
accuracy, comparable to traditional TFS methods.
3.4 Biological Interpretation on Top
Scoring Gene Ontology Groups
GeNetOntology generates an output which includes a
ranked list of GO terms for IBD gene expression
datasets. The robust rank aggregation step within
GeNetOntology provides information about
significant GO terms that differentiates IBD cases
from non-IBD cases. In the final step, GO terms are
ranked according to the p-values that are calculated
during the robust rank aggregation step. The top 10
scoring GO terms was shown for IBD data including
all samples (Figure 5). The p-values are converted to
-log 10 scale, shown in the x-axis and related GO
terms are represented in the y-axis. Figures 6A–C
plots the identified GO terms for BP, CC, and MF
categories, respectively. For the IBD dataset, the top
ranked GO BP term is homeostasis of the number of
cells (Figure 5A). Positive regulation of endothelial
cell migration is the second top ranked GO BP term.
Negative regulation of protein metabolic process;
striated muscle cell differentiation GO BP terms have
-log10 p-values higher than 10 (Figure 5A). Late
endosome and spindle GO CC terms have -log 10 p-
values higher than 8 (Figure 5B). On the other hand,
salt transmembrane transporter activity is the top
ranked GO MF term and metal ion transmembrane
transporter activity GO MF term have the highest -log
10 p-value (Figure 5C). IBD development involves
disruption of normal immune balance in intestines,
especially in genetically susceptible individuals.
Maintaining a balance in gut microenvironment relies
on interaction between intestinal epithelial cells and
microbes. An unknown gastrointestinal complication
BIOINFORMATICS 2025 - 16th International Conference on Bioinformatics Models, Methods and Algorithms
590
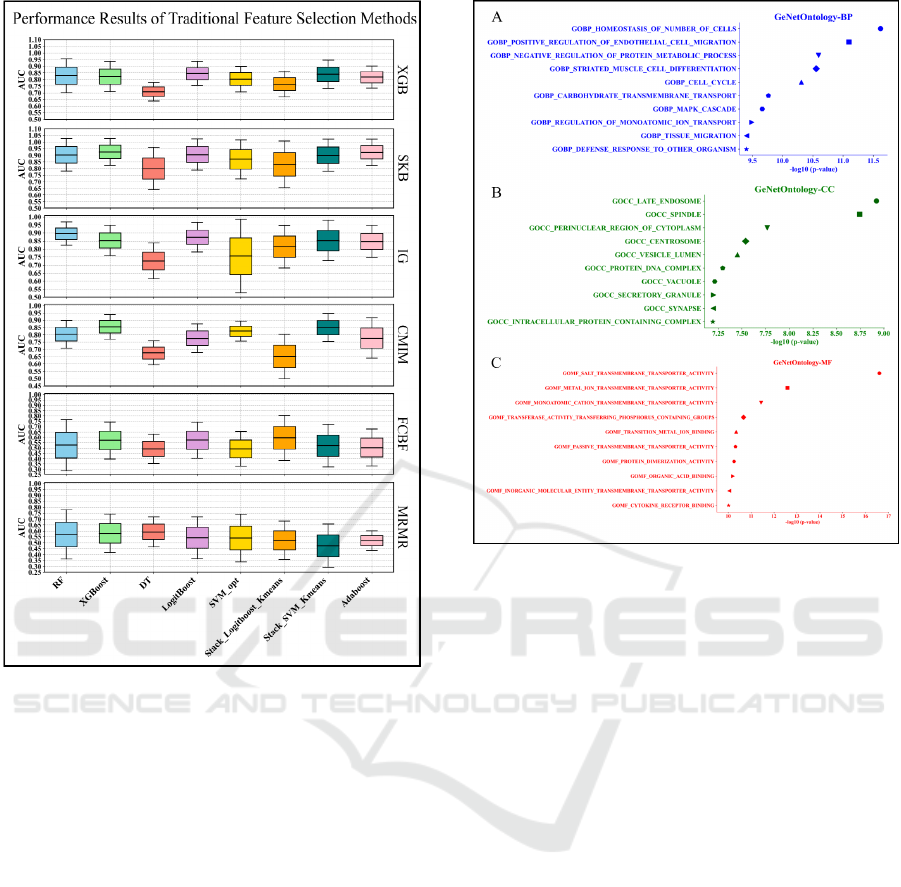
Figure 4. AUC performance results of TFS methods; XGB,
SKB, IG, FCBF, MRMR, CMIM with different classifiers;
RF, XGBoost, DT, SVM_opt, Stack_LogitBoost_Kmeans,
LogitBoost, Stack_SVM_Kmeans and Adaboost with 10-
fold MCCV on IBD dataset for 62 features.
triggers abnormal stress responses in epithelial and
myeloid cells, with endoplasmic reticulum and
mitochondria manages processes like oxidative
stress, resulting in chronic inflammation. (Ranjan,
2020). Regulation of endothelial cell migration and
angiogenesis are key to IBD pathogenesis, with
chronic inflammation relying on immune-regulated
angiogenesis. However, targeting angiogenic
molecules poses risks of severe side effects. (Alkim
et al., 2015). It has been found that IBD has a
significant relationship with late endosomes which is
a membrane-bound vesicles within cells that serve as
a sorting and trafficking hub for intracellular
molecules such as proteins and lipids (Figure 5B).
Late endosomes are crucial for processes like
signalling, receptor recycling, and antigen
presentation. Its dysfunction contributes to IBD by
immune dysregulation, microbial interactions, and
pathogenesis and aberrant activation of inflammatory
Figure. 5: GeNetOntology identified top 10 important GO
terms (A) GO BP, (B) GO CC, and (C) GO MF categories
for IBD dataset. -log 10 p-values are represented on x-axis
and IBD-related GO terms are represented on y-axis.
signalling pathways in intestinal cells. Major
histocompatibility complex class I (MHC I) and II are
cell surface proteins that play an important role in the
immune system especially in antigen presentation. A
link between IBD and MHC I and II proteins in
antigen presentation, identified in vacuolar late
endosomes of intestinal epithelial cells (Bär et al.,
2013). Studies have shown that alterations in the ionic
balance within the intestines play an important role in
triggering gut inflammation and colitis. For instance,
immune cells in the gut is activated by a high intake
of dietary salt and result in impacting the onset and
progression of IBD. Elevated salt levels
accompanying changes in microbiome, could worsen
the pathogenesis resulting from impaired sodium
transport in the intestinal environment (Prasad &
Visweswariah, 2021).
3.5 Biological Interpretation on Top
Scored KEGG Pathways
PriPath also provides an output which includes a
ranked list of KEGG pathways for gene expression
datasets of the IBD. The robust rank aggregation
result provides information about the significant
Identifying Inflammatory Bowel Disease-Associated Gene Ontology Groups Using Biological Knowledge-Based Machine Learning
591
KEGG pathways in differentiating the cases from
IBD for the non-IBD is calculated by PriPath
according to p-value for each KEGG pathway.
According to these p-values, KEGG pathways are
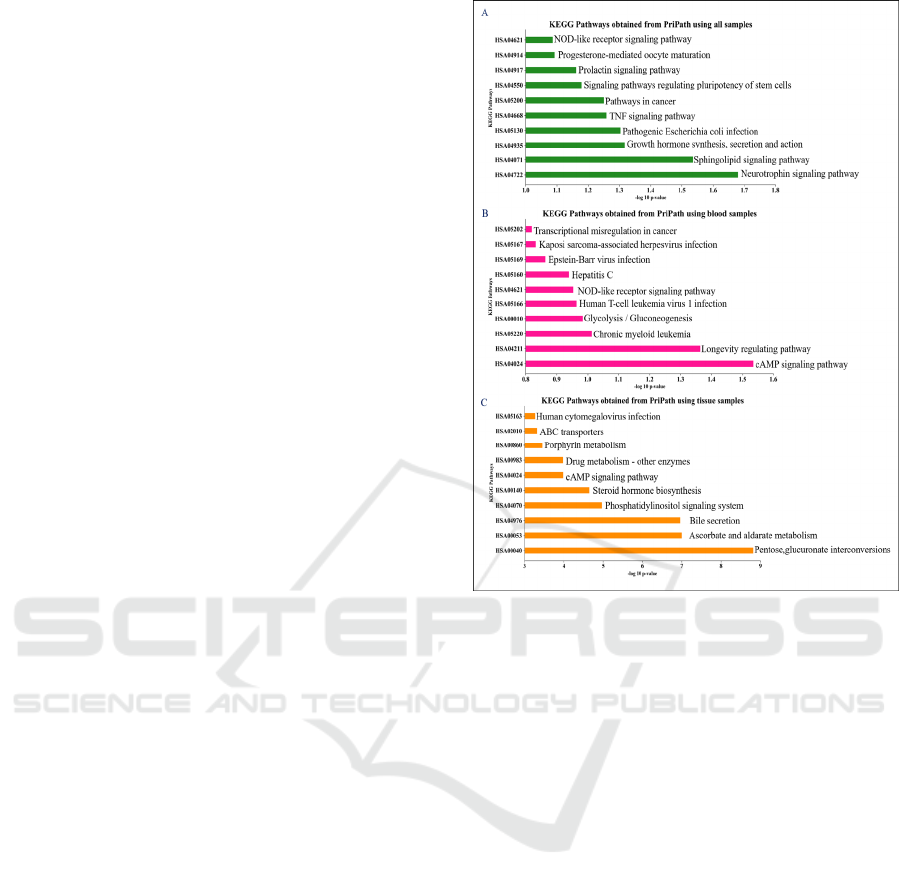
ranked. The top 10 important KEGG pathways have
been shown for the IBD dataset of all samples, blood
samples and tissue samples in Figure 6A–C,
respectively. Robust rank aggregation p-values are
converted to -log 10 scale and ranked in the x-axis
and KEGG pathway are represented in the y-axis.
Neutrophil signalling pathway and sphingolipid
signalling pathway are the top two scored pathways
when all samples are analysed (Figure 6A). cAMP
signalling pathway is the top scored KEGG pathway
when only blood samples are analysed (Figure 6B).
Pentose, glucuronate interconversions is the top
scored KEGG pathway when only tissue samples are
analysed (Figure 6C). Host and microbial cross-talk
plays a crucial role in maintenance of intestinal
homeostasis. However, it is not clear how microbiota-
derived metabolites regulate pathogenesis of IBD. In
the literature, it has been shown that butyrate, a
microbiota-derived metabolite, plays a crucial role in
regulating neutrophil functions, potentially serving as
a novel therapeutic agent for treating inflammatory
bowel disease (IBD) (Li et al., 2021). The importance
of sphingolipid metabolism has been shown in
different cancers including AML (Ersöz & Adan,
2022a, 2022b) and how it regulates intestinal
homeostasis (An et al., 2014). A study reveals that the
periodontal pathogen Porphyromonas gingivalis
alters the gut microbiome composition and function,
affecting specific fungal species and pentose and
glucuronate interconversions, metabolic pathways,
and two-component system pathways, and
highlighting interactions between fungi, bacteria, and
metabolites (Chen et al., 2022).
4 CONCLUSIONS
The recent advancements in next-generation
sequencing and high-throughput technologies have
made it increasingly affordable to obtain gene
expression profiles from different sources of samples.
For the IBD-associated key gene set identification
problem, our findings show that GeNetOntology, a
ML-based method outperforms some TFS methods
such as MRMR and FCBF and competes with XGB,
SKB and IG based on AUC metric. GeNetOntology
provides valuable insights into IBD pathology by
identifying significant GO terms and aiding
biomarker discovery and therapeutic targets.
Figure 6: Pripath identified top 10 important KEGG
pathways for the IBD dataset. -log 10 p-values are
represented on the x-axis and IBD-related KEGG pathways
are represented on the y-axis.
ACKNOWLEDGEMENTS
NSE has been supported by TUBITAK 2211A
program, BBG has been supported by Abdullah Gul
University Support Foundation (AGUV) and MY has
been supported by Zefat Academic College.
Conflict of Interest: none declared.
REFERENCES
Albattah, W., et al., (2022). Feature Selection Techniques
for Big Data Analytics. Electronics, 11(19), Article 19.
Alkim, C., et al., (2015). Angiogenesis in Inflammatory
Bowel Disease. International Journal of Inflammation,
An, D., et al., (2014). Sphingolipids from a Symbiotic
Microbe Regulate Homeostasis of Host Intestinal
Natural Killer T Cells. Cell, 156(1), 123–133.
Ashburner, M., et al., (2000). Gene Ontology: Tool for the
unification of biology. Nature Genetics, 25(1), 25–29.
Bakir-Gungor, B., et al., (2023). microBiomeGSM: The
identification of taxonomic biomarkers from
metagenomic data using grouping, scoring and
BIOINFORMATICS 2025 - 16th International Conference on Bioinformatics Models, Methods and Algorithms
592

modeling (G-S-M) approach. Frontiers in
Microbiology, 14, 1264941.
Bär, F., et al., (2013). Inflammatory bowel diseases
influence major histocompatibility complex class I
(MHC I) and II compartments in intestinal epithelial
cells. Clinical and Experimental Immunology, 172(2)
Carbon, S., et al., (2019). The Gene Ontology Resource: 20
years and still GOing strong. Nucleic Acids Research,
47(D1), D330–D338.
Chen, S., et al.,(2022). Multi-omics insights reveal the
remodeling of gut mycobiome with P. gingivalis.
Frontiers in Cellular and Infection Microbiology, 12
Chou, C et al., miRTarBase update 2018: A resource for
experimentally validated microRNA-target
interactions. Nucleic Acids Research, 46, D296–D302.
Ersöz, N. Ş., & Adan, A. (2022a). Differential in vitro anti-
leukemic activity of resveratrol combined with serine
palmitoyltransferase inhibitor myriocin in FMS-like
tyrosine kinase 3-internal tandem duplication (FLT3-
ITD) carrying AML cells. Cytotechnology, 74(2), 271
Ersöz, N. Ş., & Adan, A. (2022b). Resveratrol triggers anti-
proliferative and apoptotic effects in FLT3-ITD-
positive acute myeloid leukemia cells via inhibiting
ceramide catabolism enzymes. Medical Oncology,
39(3), 35.
Ersoz, N. S., Bakir-Gungor, B., & Yousef, M. (2023).
GeNetOntology: Identifying affected gene ontology
terms via grouping, scoring, and modeling of gene
expression data utilizing biological knowledge-based
machine learning. Frontiers in Genetics, 14.
Gene Ontology Consortium: Going forward. (2015).
Nucleic Acids Research, 43(Database issue), D1049
Jabeer, A., et al., miRdisNET: Discovering microRNA
biomarkers that are associated with diseases utilizing
biological knowledge-based machine learning.
Frontiers in Genetics, 13.
Kanehisa, M., & Goto, S. (2000). KEGG: Kyoto
Encyclopedia of Genes and Genomes. Nucleic Acids
Research, 28(1), 27–30.
Kuzudisli, C., et al., (2023). Review of feature selection
approaches based on grouping of features. PeerJ, 11,
Li, G., et al., (2021). Microbiota metabolite butyrate
constrains neutrophil functions and ameliorates
mucosal inflammation in inflammatory bowel disease.
Gut Microbes, 13(1), 1968257.
Palmer, N. P., et al., (2019). Concordance between gene
expression in peripheral whole blood and colonic tissue
in children with inflammatory bowel disease. PLOS
ONE, 14(10), e0222952.
Perscheid, C. (2021). Integrative biomarker detection on
high-dimensional gene expression data sets: A survey
on prior knowledge approaches. Briefings in
Bioinformatics, 22(3), bbaa151.
Perscheid, C., et al., (2019). Integrative Gene Selection on
Gene Expression Data: Providing Biological Context
to Traditional Approaches. Journal of Integrative
Bioinformatics
Prasad, H., et al., (2021). Impaired Intestinal Sodium
Transport in Inflammatory Bowel Disease: From the
Passenger to the Driver’s Seat. Cellular and Molecular
Gastroenterology and Hepatology, 12(1), 277–292.
Qumsiyeh, E., Salah, Z., & Yousef, M. (2023).
miRGediNET: A comprehensive examination of
common genes in miRNA-Target interactions and
disease associations: Insights from a grouping-scoring-
modeling approach. Heliyon, 9(12), e22666.
Qumsiyeh, E., Showe, L., & Yousef, M. (2022). GediNET
for discovering gene associations across diseases using
knowledge based machine learning approach.
Scientific Reports, 12(1), Article 1.
Ranjan, K. (2020). Intestinal Immune Homeostasis and
Inflammatory Bowel Disease: A Perspective on
Intracellular Response Mechanisms. Gastrointestinal
Disorders, 2(3), Article 3.
Seyedian, S. S., et al., (2019). A review of the diagnosis,
prevention, and treatment methods of inflammatory
bowel disease. Journal of Medicine and Life, 12(2),
113–122.
Tomczak, K., et al., (2015). Review The Cancer Genome
Atlas (TCGA): An immeasurable source of knowledge.
Współczesna Onkologia, 1A, 68–77.
Unlu Yazici, M., et al., (2023). Invention of 3Mint for
feature grouping and scoring in multi-omics. Frontiers
in Genetics, 14.
Yazici, M. U., et al., (2023). miRcorrNetPro: Unraveling
Algorithmic Insights through Cross-Validation in
Multi-Omics Integration for Comprehensive Data
Analysis. 2023 IEEE International Conference on
Bioinformatics and Biomedicine (BIBM), 3234–3240.
Yousef, M., et al., (2019). maTE: Discovering expressed
interactions between microRNAs and their targets.
Bioinformatics, 35(20), 4020–4028.
Yousef, M., Goy, G., & Bakir-Gungor, B. (2022).
miRModuleNet: Detecting miRNA-mRNA Regulatory
Modules. Frontiers in Genetics, 13.
Yousef, M., Goy, et al., (2021). miRcorrNet: Machine
learning-based integration of miRNA and mRNA
expression profiles, combined with feature grouping
and ranking. PeerJ, 9, e11458.
Yousef, M., et al., (2024). G-S-M: A Comprehensive
Framework for Integrative Feature Selection in Omics
Data Analysis and Beyond. bioRxiv.
Yousef, M., Kumar, A., & Bakir-Gungor, B. (2021).
Application of Biological Domain Knowledge Based
Feature Selection on Gene Expression Data. Entropy,
Yousef, M., et al., (2022). PriPath: Identifying
Dysregulated Pathways from Differential Gene
Expression via Grouping, Scoring and Modeling with
an Embedded Machine Learning Approach.
Yousef, M., Ülgen, E., & Uğur Sezerman, O. (2021).
CogNet: Classification of gene expression data based
on ranked active-subnetwork-oriented KEGG pathway
enrichment analysis. PeerJ Computer Science, 7, e336.
Yousef, M., & Voskergian, D. (2022). TextNetTopics: Text
Classification Based Word Grouping as Topics and
Topics’ Scoring. Frontiers in Genetics, 13,
Zhang, Y.-Z., & Li, Y.-Y. (2014). Inflammatory bowel
disease: Pathogenesis. World Journal of
Gastroenterology : WJG, 20(1), 91–99.
Identifying Inflammatory Bowel Disease-Associated Gene Ontology Groups Using Biological Knowledge-Based Machine Learning
593
