
Lunar Technosignatures: A Deep Learning Approach to Detecting
Apollo Landing Sites on the Lunar Surface
Tom Sander
a
and Christian W
¨
ohler
Image Analysis Group, TU Dortmund University, Otto-Hahn-Straße 4, 44227 Dortmund, Germany
{tom.sander, christian.woehler}@tu-dortmund.de
Keywords:
Anomaly Detection, Machine Learning, Moon, Lunar Surface.
Abstract:
Uncovering anomalies on the lunar surface is crucial for understanding the Moon’s geological and astronom-
ical history. By identifying and studying these anomalies, new theories about the changes that have occurred
on the Moon can be developed or refined. This study seeks to enhance anomaly detection on the Moon and
replace the time-consuming manual data search process by testing an anomaly detection method using the
Apollo landing sites. The landing sites are advantageous as they are both anomalous and can be located,
enabling an assessment of the procedure. Our study compares the performance of various state-of-the-art
machine learning algorithms in detecting anomalies in the Narrow-Angle Camera data from the Lunar Recon-
naissance Orbiter spacecraft. The results demonstrate that our approach outperforms previous publications in
accurately predicting landing site artifacts and technosignatures at the Apollo 15 and 17 landing sites. While
our method achieves promising results, there is still room for improvement. Future refinements could focus
on detecting more subtle anomalies, such as the rover tracks left by the Apollo missions.
1 INTRODUCTION
The Moon, Earth’s closest celestial companion, is a
fascinating and complex world shaped by many pro-
cesses over billions of years. At first glance, its sur-
face appears to be a simple dichotomy of dark Mare
and bright Highland regions. However, upon closer
inspection, the Moon reveals a rich tapestry of anoma-
lies that offer a window into its composition, forma-
tion, and evolution. These anomalies can manifest as
unusual cratering patterns, volcanic activity, or unex-
pected materials such as hydroxyl (Li and Milliken,
2017; W
¨
ohler et al., 2017; Bandfield et al., 2018),
water ice (Feldman et al., 1998; Li et al., 2018),
or helium (Kim et al., 2019) in the lunar regolith.
Moreover, localized magnetic fields (Hood and Schu-
bert, 1980; Tsunakawa et al., 2015), mass concen-
trations, and photometric anomalies (Kaydash et al.,
2009; Kaydash et al., 2011; Hess et al., 2023), as
well as compositional anomalies such as pyroclastic
deposits (Heiken et al., 1974; Gaddis et al., 2003) and
spinel-rich regions (Pieters et al., 2014) contribute to
the Moon’s intricate and enigmatic character.
Traditionally, experienced domain experts inspect
high-resolution images to find data points that do not
a
https://orcid.org/0009-0008-3051-5976
fit the norm. However, this process is slow, biased,
and inefficient. Fortunately, lunar orbiters provide
high-resolution images and many observations, mak-
ing their data particularly well-suited for machine-
learning methods. These methods can aid the domain
experts in finding regions of interest and avoid the te-
dious search and mapping by hand, ensuring a more
efficient and productive lunar research process.
One of the primary challenges in evaluating
anomaly detection accuracy on planetary bodies is
the scarcity of ground truth data. Only a handful
of locations have such data, leading to subjective
assessments and diverse interpretations among sci-
entists. To address this, our paper focuses on the
landing sites of the Apollo 15 and Apollo 17 mis-
sions, which provide detailed information about an
exemplary anomaly. These technosignatures, which
are clearly anomalous features on the lunar surface,
can be identified using data from the Lunar Re-
connaissance Orbiter (LRO) Narrow Angle Camera
(NAC) (Robinson et al., 2010).
2 RELATED WORKS
This section will review existing research to under-
stand anomalies on the Moon. It is divided into two
Sander, T. and Wöhler, C.
Lunar Technosignatures: A Deep Learning Approach to Detecting Apollo Landing Sites on the Lunar Surface.
DOI: 10.5220/0013179000003912
Paper published under CC license (CC BY-NC-ND 4.0)
In Proceedings of the 20th International Joint Conference on Computer Vision, Imaging and Computer Graphics Theory and Applications (VISIGRAPP 2025) - Volume 3: VISAPP, pages
491-499
ISBN: 978-989-758-728-3; ISSN: 2184-4321
Proceedings Copyright © 2025 by SCITEPRESS – Science and Technology Publications, Lda.
491

parts. First, we will examine photometric anomalies
on the Moon, including notable features such as lu-
nar swirls. Next, we will focus on state-of-the-art
anomaly detection methods, particularly their appli-
cation to lunar landing sites.
2.1 Photometric Anomalies
2.1.1 Lunar Swirls
Lunar swirls are photometric anomalies that appear
brighter than the surrounding surface and are almost
all co-located with magnetic anomalies (Hood and
Schubert, 1980; Tsunakawa et al., 2015; Hess et al.,
2020). The swirls form complex patterns, but their
origin is still not fully understood. The local mag-
netic fields lead to reduced space weathering (Kramer
et al., 2011; Glotch et al., 2015), but also the physical
properties of the regolith might be different due to an
external event possibly responsible for the creation,
like the interaction between the surface material and
a comet (Pinet et al., 2000; Syal and Schultz, 2015;
Hess et al., 2020; Hess et al., 2023). Further detec-
tions of locations on the Moon with similarly abnor-
mal photometric properties would help advance our
understanding of these mysterious features.
Moreover, using high-resolution image data, boul-
ders can be observed, revealing that some are covered
with dust. For example, R
¨
usch et al. (R
¨
usch et al.,
2024) used a database of fractured boulders (R
¨
usch
and Bickel, 2023) based on LRO NAC data to find
boulders with unusual reflectance properties. Us-
ing photometric inversion by Bayesian inference sam-
pling, this effect could be related to a reduced oppo-
sition effect indicating anomalously low soil poros-
ity. Interestingly, such boulders could only be found
around the crater Reiner K near the Reiner Gamma
swirl, a photometric and magnetic anomaly.
2.1.2 Landing Sites
Landing sites can also be identified as photometric
anomalies (Kaydash et al., 2011; Hess et al., 2023;
Lesnikowski et al., 2020), as the landing rocket’s jet
disrupts the porous structure of the lunar regolith,
making it appear brighter. Comparing the photomet-
ric properties of the Reiner Gamma Swirl with the
Chang’e 5 landing site, Hess et al. (Hess et al., 2023)
found both areas to have a higher albedo and weaker
opposition effect than the surrounding mare surface,
attributing this to compaction caused by the landing
rocket jet and a passing comet’s gaseous hull for the
landing site and the swirl, respectively.
Landing sites are ideal for anomaly detection
since ground truth validation is only possible in these
locations. Lesnikowski et al. (Lesnikowski et al.,
2020) used a Variational Autoencoder (VAE) to un-
supervisedly learn the distribution of lunar surface in
LRO image data and later applied it to detect tech-
nosignatures at the Apollo 17 landing site. Moseley et
al. (Moseley et al., 2020) used a similar methodology
to detect thermal anomalies on the Moon, identify-
ing individual areas with anomalous thermal behavior
using a trained model. Loveland and Sime (Loveland
and Sime, 2024) created a CNN-based autoencoder to
find technosignatures on the Moon, trying to find the
Ranger 6 and Apollo 13 crashing sites and the Apollo
12 and Apollo 17 landing sites.
2.2 Anomaly Methods
Anomalies are characterized by deviating from the
norm. Therefore, many anomaly detection methods
are based on the idea of first learning a representa-
tion of normality from which deviations can then be
detected. In this way, it is sufficient to train a model
unsupervised to find anomalies.
Such representations can be learned, e.g., using
autoencoders (Sakurada and Yairi, 2014) or varia-
tional autoencoders (An and Cho, 2015). To detect
an anomaly, the deviation of the autoencoder output
or the image representation in the latent space can be
utilized. Conventional autoencoders often learn a dic-
tionary of “good” data using k-means or k-Nearest-
Neighbors (k-NN) for anomaly detection. The dis-
tance between the representation of the anomaly im-
age and the dictionary points is measured, and anoma-
lies are identified by their larger distance. Another
approach is to learn this representation using a gener-
ative network, such as a GAN (Schlegl et al., 2017).
Newer distance-based methods, such as
PaDiM (Defard et al., 2021) or PatchCore (Roth
et al., 2022), utilize pre-trained Convolutional Neu-
tral Network (CNN) (such as ResNet (He et al.,
2015)) features to construct a dictionary. PaDiM
extracts a feature vector from the first few layers of
the CNN for each patch, which is extracted along
the depth of the respective layer. These vectors are
concatenated to provide the feature vectors, which
are then modeled using a multivariate Gaussian
distribution. Deviations from this distribution then
represent anomalies.
The PatchCore method follows a similar process
to the PaDiM method by extracting feature vectors
from the CNNs, but the anomaly detection approach
differs. PatchCore creates a memory bank of all good
data and subsamples it, as the original memory bank
would be too large. Anomalies then differ in distance
from this reduced memory bank.
VISAPP 2025 - 20th International Conference on Computer Vision Theory and Applications
492

Table 1: Details of the images used in this paper. The images were acquired by the LRO NAC instrument and can be
downloaded through the NASA Planetary Data System (PDS).
Landing site Image ID Incidence angle [deg] Phase angle [deg] Nominal resolution [m]
Apollo 15 M175252641LR 49.39 49.64 0.406
Apollo 17 M113758461R 55.72 70.19 0.515
Another way to detect anomalies is to use student-
teacher networks, as in (Bergmann et al., 2020;
Batzner et al., 2024). The concept involves training a
teacher and multiple students, each initialized differ-
ently, on the same dataset. Anomalies can then be de-
tected by identifying deviations between the student
networks and the teacher. In (Batzner et al., 2024), an
autoencoder is added to the teacher-student training
to detect anomalies more globally.
We can also use the normalized flow approach
(Dinh et al., 2016; Rudolph et al., 2021) as a method
for spotting anomalies. The basic idea is to figure out
a way to convert input data into a simple output dis-
tribution, like a normal distribution. Anomalies typ-
ically need a more complicated transformation than
regular data, so they stand out from the learned flow,
giving them a higher anomaly score. This approach
has the added advantage of providing insights into
why something is considered an outlier.
3 DATA
As the data set, we use images from the Lunar Re-
connaissance Orbiter (LRO) (Robinson et al., 2010)
spacecraft launched in 2009. The LRO orbiter has a
nominal orbit of 50 km around the Moon and can take
images with two different instruments, the Narrow
Angle Camera (NAC) (Humm et al., 2015) and the
Wide Angle Camera (WAC) (Speyerer et al., 2012).
This paper will only use the TIFF versions of the NAC
images. Since the published PTIFF files contain pyra-
mid images, we will use the top pyramid image with
the highest resolution of about 0.5 mpx
−1
. Table 1
provides the details of the NAC data used in this pa-
per.
The high-resolution NAC images are cut into
patches of 224 × 224 pixels with a stride of 28, ig-
noring the landing site from the center of the descent
stage by 408 pixels. This results in 492070 training
images for the Apollo 15 NAC and 518200 images
for the Apollo 17 NAC. The left-out landing sites are
then processed with the same stride of 8, resulting in
approximately 5476 test images per site.
4 METHODOLOGY
This chapter briefly overviews the state-of-the-art
(SOTA) methods used in this paper. First, we go over
the EfficientAD Method, then the Cut&Paste Method,
and lastly, we will go over the AnoViT method.
4.1 EfficientAD
EfficientAD (Batzner et al., 2024) is a state-of-the-art
approach to detecting anomalies in images. It uses
a student-teacher framework along with an Autoen-
coder to identify anomalies at both local and global
scales (see figure 1). This method involves a pre-
trained, fixed teacher model and a trainable student
model. Both models extract features from input im-
ages, but the student is trained to mimic the teacher’s
outputs for normal, non-anomalous data.
During inference, the student model processes the
image, and its output is compared to what the teacher
model would have produced. Significant differences
between the student and teacher outputs are consid-
ered as indications of anomalies.
Input image x
teacher
student
autoencoder
Local map
Global map
Figure 1: Overview of the EfficientAD method (Batzner
et al., 2024). Three networks are compared against each
other to create a local and global map of the anomalies.
4.2 Cut&Paste
The cut-and-paste method from (Li et al., 2021)
converts the unsupervised problem into an artifi-
cially constructed supervised problem, thus creat-
ing a self-supervised algorithm (see figure 3 for an
overview). The algorithm uses two steps to achieve
self-supervision: first, a cut step, where a sub-image
is cut out at a random position of the image, and then a
paste step, where the previously cut image is pasted at
Lunar Technosignatures: A Deep Learning Approach to Detecting Apollo Landing Sites on the Lunar Surface
493
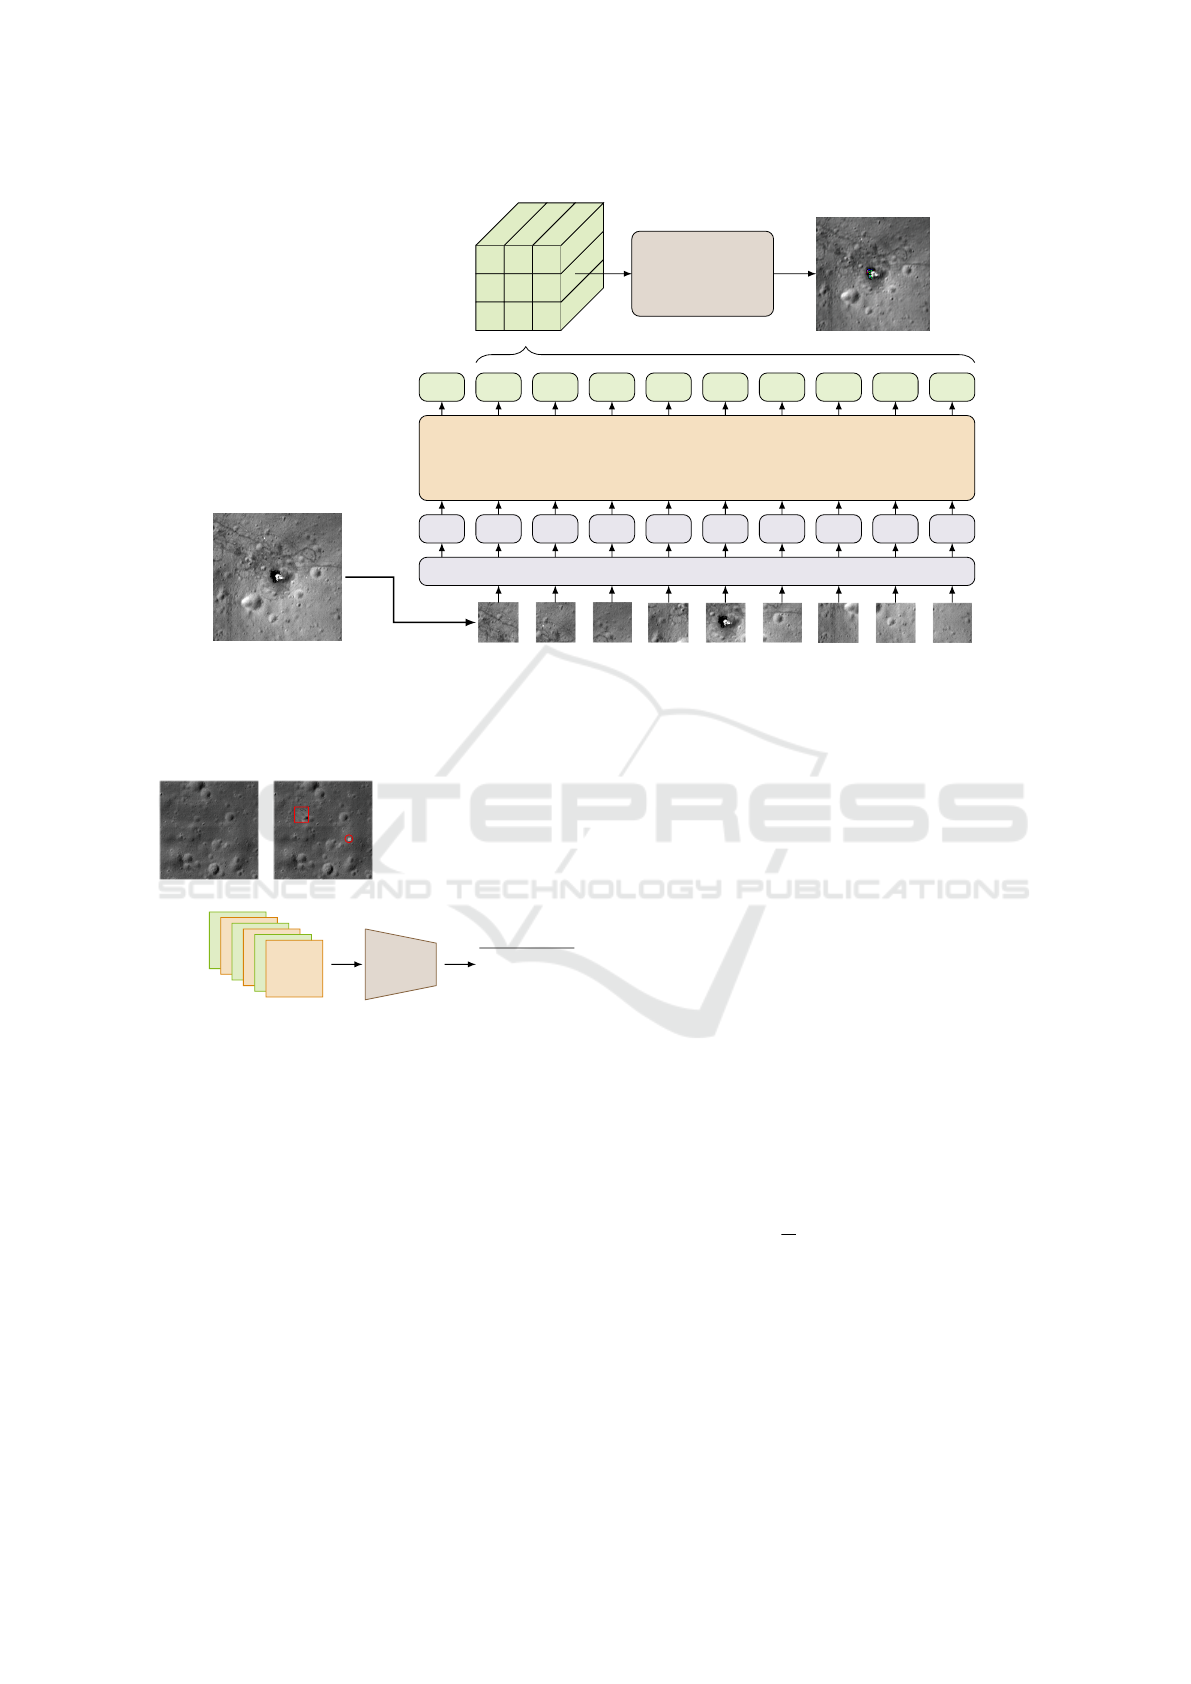
Input image x
Transformer
Encoder
Linear Projection & Pos. Encoding
E
cls
E
1
E
2
E
3
E
4
E
5
E
6
E
7
E
8
E
9
E
∗
cls
E
∗
1
E
∗
2
E
∗
3
E
∗
4
E
∗
5
E
∗
6
E
∗
7
E
∗
8
E
∗
9
E
∗
1
E
∗
2
E
∗
3
E
∗
4
E
∗
5
E
∗
6
E
∗
7
E
∗
8
E
∗
9
Decoder
Reconstruced
ˆ
x
Figure 2: This figure shows the AnoViT (Lee and Kang, 2022) method evaluated at the center of the Apollo 15 landing site.
AnoViT divides the input image into patches and propagates them through a transformer network. Afterward, the image is
reconstructed using a convolutional neural network (CNN)—the error between the input and reconstructed images results in
an Anomaly map.
Input image x
Modified
˜
x
CNN
Predictions:
0
1
0
1
0
1
Figure 3: Overview of the Cut-and-Paste Method (Li et al.,
2021). This figure only shows the training part of the Cut-
and-Paste method. For each input image x in the batch, a
corresponding anomalous image
˜
x is created. Each anomaly
is thereby created by a cut-and-paste operation using the
same input image x (see red marked areas). The batch is
then trained to detect these anomalous images from the reg-
ular inputs.
a random position and rotation. In this way, an image
tuple is created, from which one image is the orig-
inal and the second an artificially made anomalous
image. On these image pairs, a convolutional neu-
ral network is trained to predict if the image has an
anomaly. The loss can then be formulated with CE as
Cross-entropy, g(. . . ) as the Network and CP(. . . ) as
cut-and-paste operation as follows:
L
cp
= E
x∈X
{CE(g(x), 0) + CE(g(CP(x)), 1)} (1)
The algorithm can be extended further by chang-
ing the cut-and-paste transformations. For example,
the image can be lightened or darkened in certain ar-
eas. To visualize where the anomaly is located, the
gradient from the prediction to the input can be back-
traced using algorithms like GradCAM (Selvaraju
et al., 2016) and integrated Gradients (Sundararajan
et al., 2017).
4.3 AnoViT
The AnoViT (Lee and Kang, 2022) method uses an
Autoencoder approach to detect anomalies. As the
name suggests, this method uses a Vision Transformer
as an Encoder E , and the features of this encoder are
used to reconstruct the image using a Convolutional
neural network (CNN) D. While training, this model
is trained to minimize the error between the input im-
age x and the reconstructed image
ˆ
x as follows:
L
AnoViT
=
1
N
N
∑
i
||x
i
− E (D(x
i
))||
2
(2)
To detect anomalies, the autoencoder is used in evalu-
ation mode to compare the reconstruction with the in-
put image, resulting in an anomaly map. An overview
of this method can be seen in figure 2.
VISAPP 2025 - 20th International Conference on Computer Vision Theory and Applications
494

5 EXPERIMENTAL RESULTS
The experimental results section is divided into three
sub-sections. First, the training and test details are
presented, followed by the results. Finally, a distinc-
tion is made between a global and a local perspective.
5.1 Implementation Details
For the implementation of the EfficientAD (Batzner
et al., 2024) Method, we used an image size of 256
pixels instead of 224 because the algorithm requires
an image size that is a power of 2. Furthermore, we
used an embedding dimension of 384 for all networks,
such as teacher and student
1
.
The Cut&Paste (Li et al., 2021) algorithm was
trained using a Resnet 18 (He et al., 2015), in which
the head is replaced by five linear layers followed by
a ReLU function, except for the output, which has a
softmax layer. The algorithm was trained with five
different transformations:
1. A simple Cut&Paste operation, where a single
patch is randomly placed within the image.
2. A Mean Patch operation, where a patch inside the
image is filled with the mean of the image.
3. A white blob transform, where a small circular
area is lightened.
4. The opposite of the previous transform, where a
small circular area is darkened.
5. A Darken transform, which involves creating a
randomly constructed path and darkening the area
of the image within it.
These transformations can be viewed visually in fig-
ure 4.
We implemented the AnoViT (Lee and Kang,
2022) method using PyTorch’s vision transformer
(Paszke et al., 2019) implementation. For this pur-
pose, we created a vision transformer (Dosovitskiy
et al., 2020) with four heads and four layers, an em-
bedding dimension of 128, and a patch size 16. Af-
terward, the model is trained on each training dataset
with a batch size of 64 for 30 Epochs.
5.2 Results
We compute various metrics regarding the ground
truth to evaluate the effectiveness of each classifier.
The ground truth (see Figure 5b for Apollo 15 ground
1
Further details about the parameters and imple-
mentation can be found in the Appendix (section 6)
and the following GitHub repository: https://github.com/
TechnicToms/lunar-technosignatures
(a) Original
image
(b) Cut&Paste
Transform
(c) Cut Mean
Transform
(d) Darken blob
Transform
(e) Whiten blob
Transform
(f) Darken path
Transform
Figure 4: Different cut and paste transformations that are
used in this paper.
truth) marks the descent stage of each Apollo mission
pixel-wise. An anomaly score and an anomaly map
are computed for each image in the Test dataset. The
anomaly scores are then compared against the ground
truth label of the corresponding image. Computing
a Receiver Operating Characteristic (ROC) (Fawcett,
2006) curve reveals an optimal threshold to use by
choosing the threshold where the curve is near the top
right corner. By thresholding these anomalies, a bi-
nary score is computed from which common metrics
like accuracy, precision, and recall can be computed.
Additionally, the area under the curve (AUC), aver-
age precision (AP), and the precision at the model’s
threshold, where the model returns all positive sam-
ples (PaTR), are computed. The results for each land-
ing site are displayed in table 2. We included the
PaTR Metric to compare our results to those of previ-
ous works.
5.2.1 Apollo 15
An examination of the column for the Apollo 15
results in table 2 reveals that the AnoViT method
consistently produces better results, except for the
PaTR value. Additionally, a visual assessment of the
anomaly maps in Figure 5 around the center of the
Apollo landing site demonstrates the high accuracy in
detecting the Descent stage of the Apollo 15 mission.
5.2.2 Apollo 17
Upon examination of the second section of table 2
(the results of the Apollo 17 landing site), it becomes
evident that the AnoViT method demonstrates opti-
mal performance. However, as previously mentioned
by the Apollo 15 landing site, the EfficientAD method
exhibits better results regarding the PaTR value.
Comparing table 2’s results with those of previous
Lunar Technosignatures: A Deep Learning Approach to Detecting Apollo Landing Sites on the Lunar Surface
495

Table 2: This table shows the numerical results of the classification. The accuracy, precision, recall, area under curve (AUC),
precision at the model’s threshold, where the model returns all positive samples (PaTR), and average precision (AP) are used
here to evaluate the effectiveness of the used algorithms. Bold means this value is the highest score for the corresponding
metric in the current dataset.
Metrics:
Method: Accuracy: Precision: Recall: AUC: PaTR: AP:
Apollo 15
AnoViT 0.9821 0.9226 0.9675 0.9874 0.3396 0.8978
Cut&Paste 0.8093 0.4360 0.7149 0.8400 0.1575 0.3566
EfficientAD 0.9125 0.7395 0.8765 0.9461 0.4736 0.6855
Apollo 17
AnoViT 0.9091 0.6241 0.9666 0.9329 0.3020 0.6082
Cut&Paste 0.8615 0.5669 0.2670 0.8489 0.1694 0.2596
EfficientAD 0.8922 0.6818 0.9067 0.9035 0.4399 0.6226
publications, such as (Lesnikowski et al., 2020), re-
veals that the state-of-the-art methods performed bet-
ter than in the previous papers. (Lesnikowski et al.,
2020) achieved an average precision (AP) of 0.49 and
a PaTR of 0.055 for the Apollo 17 landing site. Our
best results with the EfficientAD method achieved
an average precision (AP) of 0.6226 and a PaTR of
0.4399.
While (Loveland and Sime, 2024) appear to ad-
dress a related research question, their evaluation
methodology on the ’First Occurrence Efficiency’
metric incorporates human judgment, rendering direct
comparison with our work challenging. As a result,
we cannot meaningfully compare our findings with
theirs.
Overall, the AnoViT method demonstrates supe-
rior performance compared to the other two methods.
This improvement is mainly due to the structural dif-
ferences between EfficientAD and Cut&Paste. Both
of these methods utilize a CNN, while AnoViT em-
ploys a transformer-based approach that incorporates
a Vision Transformer. This allows it to leverage hi-
erarchical feature representations and the attention
mechanism, enabling AnoViT to detect anomalies
at multiple scales. Additionally, AnoViT’s use of
the attention mechanism focuses the transformer’s re-
sources on the most relevant regions of the image.
5.3 Global vs. Local Scale
One important factor to consider in the classification
accuracy is the number of anomalies detected around
the landing sites (false positives). To make these false
positive examples visible, we also provide a global
anomaly map in figure 6 showing the whole testing
area in one image, instead of only a single patch out
of the whole test dataset, which is shown in figure 5.
In figure 5, the local anomaly maps are clear and easy
to understand. However, the complexity increases
when looking at a global scale (Figure 6). It is worth
noting that the descent stage is surrounded by more
noise, especially in the EfficientAD and Cut&Paste
models. On the other hand, the AnoViT model pro-
vides the most precise global anomaly map, showing
a sharp and comprehensive representation of the lunar
surface. This suggests that AnoViT might be a more
effective tool for identifying technosignatures on the
Moon as it creates a sharper reconstruction of the in-
put image.
6 CONCLUSIONS
Detecting anomalies on the lunar surface can enhance
our understanding of the Moon’s origin, formation,
and evolution. However, ground truth is needed to
test anomaly detection techniques for their effective-
ness, which is why the Apollo landing sites were used
as anomalies in this paper. The high-resolution NAC
images make it challenging for experts to locate these
technosignatures, so an automated search is benefi-
cial.
In order to achieve our goal, we implemented and
evaluated three algorithms: EfficientAD, Cut&Paste,
and AnoViT. We computed various metrics to assess
the effectiveness of each classifier and displayed the
results for each landing site. The AnoViT method
consistently produced better results overall, except for
the PaTR value compared to the EfficientAD method.
Comparing our results with previous publications, we
found that state-of-the-art methods performed bet-
ter. Furthermore, our global vs. local scale analy-
sis showed that the AnoViT model provided the most
precise global anomaly map, indicating its effective-
ness in identifying technosignatures on the Moon.
In conclusion, image-based detection of small
technosignatures on the Moon is possible, but further
work is needed to improve the detection performance.
VISAPP 2025 - 20th International Conference on Computer Vision Theory and Applications
496
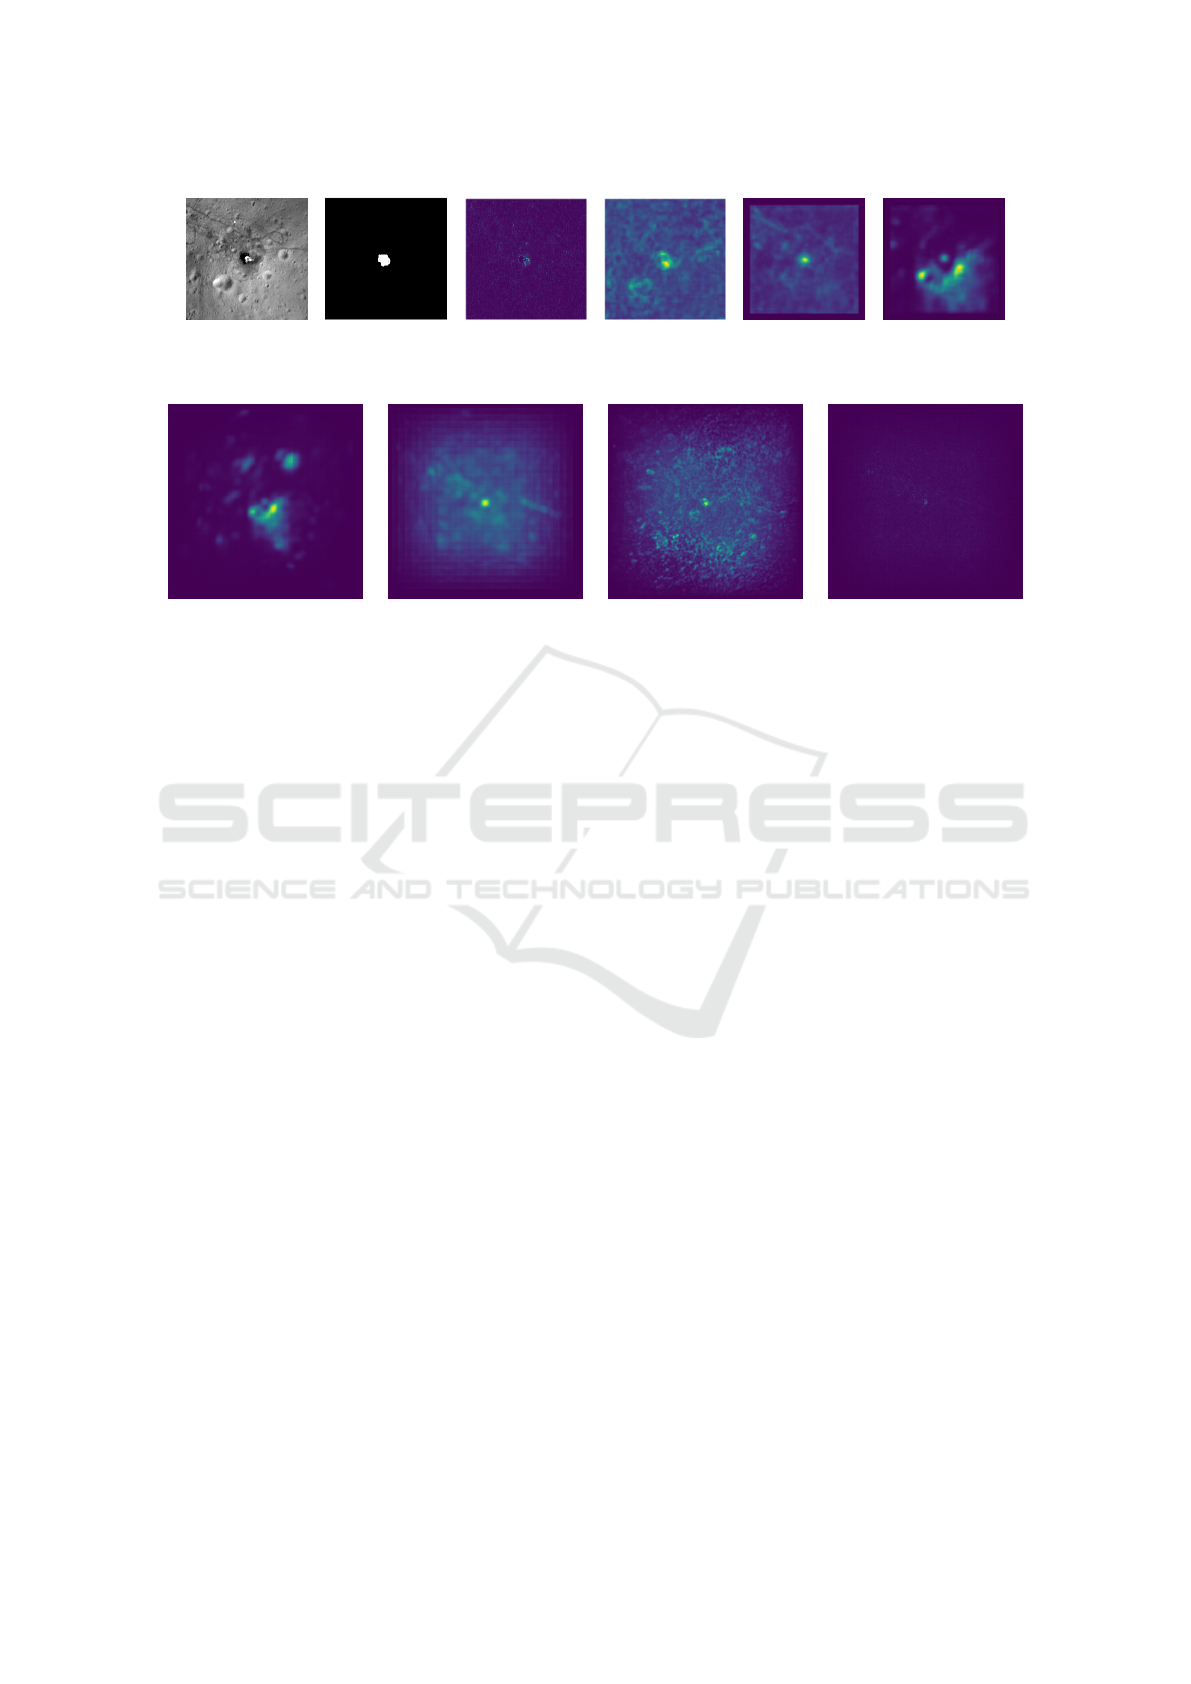
(a) Original (b) Ground truth (c) AnoViT (d) Cut&Paste (e) EffAD Local (f) EffAD Global
Figure 5: Local anomaly maps from the descending stage of the apollo 15 mission.
(a) EfficientAD Global (b) EfficientAD Local (c) Cut&Paste (d) AnoViT
Figure 6: Global anomaly maps covering the complete test dataset of the Apollo 15 landing site.
For example, further work could detect even the astro-
nauts’ rover tracks.
REFERENCES
An, J. and Cho, S. (2015). Variational autoencoder based
anomaly detection using reconstruction probability.
Special lecture on IE, 2(1):1–18.
Bandfield, J. L., Poston, M., Klima, R. L., and Christopher,
E. (2018). Widespread distribution of OH/H
2
O on the
lunar surface inferred from spectral data. Nature Geo-
science, 11.
Batzner, K., Heckler, L., and K
¨
onig, R. (2024). Efficientad:
Accurate visual anomaly detection at millisecond-
level latencies. In Proceedings of the IEEE/CVF Win-
ter Conference on Applications of Computer Vision
(WACV), pages 128–138.
Bergmann, P., Fauser, M., Sattlegger, D., and Steger,
C. (2020). Uninformed students: Student-teacher
anomaly detection with discriminative latent embed-
dings. In 2020 IEEE/CVF Conference on Computer
Vision and Pattern Recognition (CVPR). IEEE.
Defard, T., Setkov, A., Loesch, A., and Audigier, R. (2021).
PaDiM: A Patch Distribution Modeling Framework
for Anomaly Detection and Localization, pages 475–
489. Springer International Publishing.
Dinh, L., Sohl-Dickstein, J. N., and Bengio, S. (2016). Den-
sity estimation using real nvp. ArXiv, abs/1605.08803.
Dosovitskiy, A., Beyer, L., Kolesnikov, A., Weissenborn,
D., Zhai, X., Unterthiner, T., Dehghani, M., Minderer,
M., Heigold, G., Gelly, S., Uszkoreit, J., and Houlsby,
N. (2020). An image is worth 16x16 words: Trans-
formers for image recognition at scale.
Fawcett, T. (2006). An introduction to roc analysis. Pattern
Recognition Letters, 27(8):861–874.
Feldman, W. C., Maurice, S., Binder, A., Barraclough,
B., Elphic, R., and Lawrence, D. (1998). Fluxes of
fast and epithermal neutrons from lunar prospector:
Evidence for water ice at the lunar poles. Science,
281(5382):1496–1500.
Gaddis, L. R., Staid, M. I., Tyburczy, J. A., Hawke, B. R.,
and Petro, N. E. (2003). Compositional analyses of
lunar pyroclastic deposits. Icarus, 161(2):262–280.
Glotch, T. D., Bandfield, J. L., Lucey, P. G., Hayne, P. O.,
Greenhagen, B. T., Arnold, J. A., Ghent, R. R., and
Paige, D. A. (2015). Formation of lunar swirls by
magnetic field standoff of the solar wind. Nature com-
munications, 6(1):1–8.
He, K., Zhang, X., Ren, S., and Sun, J. (2015). Deep resid-
ual learning for image recognition. 2016 IEEE Con-
ference on Computer Vision and Pattern Recognition
(CVPR), pages 770–778.
Heiken, G. H., McKay, D. S., and Brown, R. (1974). Lunar
deposits of possible pyroclastic origin. Geochimica et
Cosmochimica Acta, 38(11):1703–1718.
Hess, M., W
¨
ohler, C., Bhatt, M., Berezhnoy, A., Grumpe,
A., Wohlfarth, K., Bhardwaj, A., and Shevchenko, V.
(2020). Processes governing the vis/nir spectral re-
flectance behavior of lunar swirls. Astronomy & As-
trophysics, 639:A12.
Hess, M., W
¨
ohler, C., Qiao, L., and Bhatt, M. (2023). Com-
parative photometric analysis of the reiner gamma
swirl and chang’e 5 landing site. Astronomy & As-
trophysics, 674:A226.
Hood, L. L. and Schubert, G. (1980). Lunar magnetic
anomalies and surface optical properties. Science,
208(4439):49–51.
Humm, D. C., Tschimmel, M., Brylow, S. M., Mahanti, P.,
Tran, T. N., Braden, S. E., Wiseman, S., Danton, J.,
Eliason, E. M., and Robinson, M. S. (2015). Flight
calibration of the lroc narrow angle camera. Space
Science Reviews, 200(1-4):431–473.
Lunar Technosignatures: A Deep Learning Approach to Detecting Apollo Landing Sites on the Lunar Surface
497

Kaydash, V., Kreslavsky, M., Shkuratov, Y., Gerasimenko,
S., Pinet, P., Josset, J.-L., Beauvivre, S., Foing,
B., et al. (2009). Photometric anomalies of the lu-
nar surface studied with smart-1 amie data. Icarus,
202(2):393–413.
Kaydash, V., Shkuratov, Y., Korokhin, V., and Videen, G.
(2011). Photometric anomalies in the apollo land-
ing sites as seen from the lunar reconnaissance orbiter.
Icarus, 211(1):89–96.
Kim, K. J., W
¨
ohler, C., Berezhnoy, A. A., Bhatt, M.,
and Grumpe, A. (2019). Prospective 3he-rich land-
ing sites on the moon. Planetary and Space Science,
177:104686.
Kramer, G. Y., Besse, S., Dhingra, D., Nettles, J., Klima,
R., Garrick-Bethell, I., Clark, R. N., Combe, J.-P.,
Head III, J. W., Taylor, L. A., et al. (2011). M3 spec-
tral analysis of lunar swirls and the link between opti-
cal maturation and surface hydroxyl formation at mag-
netic anomalies. Journal of Geophysical Research:
Planets, 116(E9).
Lee, Y. and Kang, P. (2022). Anovit: Unsuper-
vised anomaly detection and localization with vision
transformer-based encoder-decoder. IEEE Access,
10:46717–46724.
Lesnikowski, A., Bickel, V. T., and Angerhausen, D.
(2020). Unsupervised distribution learning for lu-
nar surface anomaly detection. arXiv preprint
arXiv:2001.04634.
Li, C.-L., Sohn, K., Yoon, J., and Pfister, T. (2021). Cut-
paste: Self-supervised learning for anomaly detection
and localization. In 2021 IEEE/CVF Conference on
Computer Vision and Pattern Recognition (CVPR),
pages 9659–9669.
Li, S., Lucey, P. G., Milliken, R. E., Hayne, P. O., Fisher,
E., Williams, J.-P., Hurley, D. M., and Elphic, R. C.
(2018). Direct evidence of surface exposed water ice
in the lunar polar regions. Proceedings of the National
Academy of Sciences, 115(36):8907–8912.
Li, S. and Milliken, R. E. (2017). Water on the surface of the
Moon as seen by the Moon Mineralogy Mapper: Dis-
tribution, abundance, and origins. Science Advances,
3:e1701471.
Loveland, R. and Sime, R. (2024). Anomaly detection
methods for finding technosignatures. In ICPRAM,
pages 633–640.
Moseley, B., Bickel, V., Burelbach, J., and Relatores, N.
(2020). Unsupervised learning for thermophysical
analysis on the lunar surface. The Planetary Science
Journal, 1(2):32.
Paszke, A., Gross, S., Massa, F., Lerer, A., Bradbury, J.,
Chanan, G., Killeen, T., Lin, Z., Gimelshein, N.,
Antiga, L., Desmaison, A., K
¨
opf, A., Yang, E., De-
Vito, Z., Raison, M., Tejani, A., Chilamkurthy, S.,
Steiner, B., Fang, L., Bai, J., and Chintala, S. (2019).
Pytorch: An imperative style, high-performance deep
learning library.
Pieters, C. M., Hanna, K. D., Cheek, L., Dhingra, D., Pris-
sel, T., Jackson, C., Moriarty, D., Parman, S., and Tay-
lor, L. A. (2014). The distribution of mg-spinel across
the moon and constraints on crustal origin. American
Mineralogist, 99(10):1893–1910.
Pinet, P. C., Shevchenko, V. V., Chevrel, S. D., Daydou,
Y., and Rosemberg, C. (2000). Local and regional lu-
nar regolith characteristics at reiner gamma formation:
Optical and spectroscopic properties from clementine
and earth-based data. Journal of Geophysical Re-
search: Planets, 105(E4):9457–9475.
Robinson, M., Brylow, S., Tschimmel, M., Humm, D.,
Lawrence, S., Thomas, P., Denevi, B., Bowman-
Cisneros, E., Zerr, J., Ravine, M., et al. (2010). Lu-
nar reconnaissance orbiter camera (lroc) instrument
overview. Space science reviews, 150(1):81–124.
Roth, K., Pemula, L., Zepeda, J., Scholkopf, B., Brox, T.,
and Gehler, P. (2022). Towards total recall in in-
dustrial anomaly detection. In 2022 IEEE/CVF Con-
ference on Computer Vision and Pattern Recognition
(CVPR). IEEE.
Rudolph, M., Wandt, B., and Rosenhahn, B. (2021). Same
same but differnet: Semi-supervised defect detection
with normalizing flows. In 2021 IEEE Winter Con-
ference on Applications of Computer Vision (WACV).
IEEE.
R
¨
usch, O. and Bickel, V. T. (2023). Global mapping of
fragmented rocks on the moon with a neural network:
Implications for the failure mode of rocks on airless
surfaces. The Planetary Science Journal, 4(7):126.
R
¨
usch, O., Hess, M., W
¨
ohler, C., Bickel, V. T., Marshal,
R. M., Patzek, M., and Huybrighs, H. L. F. (2024).
Discovery of a dust sorting process on boulders near
the reiner gamma swirl on the moon. Journal of Geo-
physical Research: Planets, 129(1).
Sakurada, M. and Yairi, T. (2014). Anomaly detection
using autoencoders with nonlinear dimensionality re-
duction. In Proceedings of the MLSDA 2014 2nd
Workshop on Machine Learning for Sensory Data
Analysis, MLSDA’14. ACM.
Schlegl, T., Seeb
¨
ock, P., Waldstein, S. M., Schmidt-Erfurth,
U., and Langs, G. (2017). Unsupervised Anomaly
Detection with Generative Adversarial Networks to
Guide Marker Discovery, pages 146–157. Springer
International Publishing.
Selvaraju, R. R., Cogswell, M., Das, A., Vedantam, R.,
Parikh, D., and Batra, D. (2016). Grad-cam: Visual
explanations from deep networks via gradient-based
localization.
Speyerer, E. J., Wagner, R. V., Robinson, M. S., Humm,
D. C., Becker, K., Anderson, J., and Thomas, P.
(2012). In-flight geometric calibration of the lu-
nar reconnaissance orbiter camera. The International
Archives of the Photogrammetry, Remote Sensing and
Spatial Information Sciences, XXXIX-B4:511–516.
Sundararajan, M., Taly, A., and Yan, Q. (2017). Axiomatic
attribution for deep networks.
Syal, M. B. and Schultz, P. H. (2015). Cometary impact
effects at the moon: Implications for lunar swirl for-
mation. Icarus, 257:194–206.
Tsunakawa, H., Takahashi, F., Shimizu, H., Shibuya, H.,
and Matsushima, M. (2015). Surface vector mapping
of magnetic anomalies over the moon using kaguya
and lunar prospector observations. Journal of Geo-
physical Research: Planets, 120(6):1160–1185.
VISAPP 2025 - 20th International Conference on Computer Vision Theory and Applications
498

W
¨
ohler, C., Grumpe, A., Berezhnoy, A. A., and
Shevchenko, V. V. (2017). Time-of-day–dependent
global distribution of lunar surficial water/hydroxyl.
Science Advances, 3:e1701286.
APPENDIX
Code and Pre-Trained Models
All our implementations can be found inside
the following GitHub repository: https://github.
com/TechnicToms/lunar-technosignatures. The pre-
trained models and learned weights are also found in-
side this repository and in the logging files.
Training Details
This section briefly overviews the training and details
of the architecture.
AnoViT
As previously described, the AnoViT method uses the
PyTorch implementation of a vision transformer as
the encoder structure. For that, we used the follow-
ing Hyperparameters:
• patch size: 16
• num layers: 4
• num heads: 4
• hidden dim: 128
• mlp dim: 128
On the other hand, the decoder, is a classic convolu-
tional network consisting of three repeated conv trans-
pose and three additional convolutional layers (see
Figure 7 for a graphical representation).
Input
embeddings
E
∗
1
E
∗
2
E
∗
3
E
∗
4
E
∗
5
E
∗
6
E
∗
7
E
∗
8
E
∗
9
ConvTranspose2d
ReLU
BatchNorm2d
×3
Conv2d + ReLU
×3
Figure 7: Decoder architecture of the AnoViT algorithm
Each ConvTranspose2d layer has 64 channels.
The final Conv2d layers have 32, 16, and 3 layers to
produce the final reconstruction.
Cut&Paste
Our Cut&Paste implementation uses a pre-trained
ResNet18 Network and five sequential linear and
ReLU layers that break the 512-dimensional feature
vector down to two neurons, followed by a softmax
layer.
We initialize each individual Cut&Paste transform
as follows:
• Cut&Paste transform (see fig.: 4b):
– patch size = 32
– use flipping = True
• Mean transform (see fig.: 4c):
– patch size = 32
• Darken Blob transform (see fig.: 4d):
– min radius = 5
– max radius = 18
• Whiten Blob transform (see fig.: 4e):
– min radius = 3
– max radius = 3
• Darken path transform (see fig.: 4f):
– num points = 6
– thickness = 2
EfficientAD
In the EfficientAD method, we used a latent dimen-
sion of 384. The student networks use the smallest
Student, which takes a large image of 33 × 33 pix-
els as input. During training, our student networks
are trained on the NAC images against the ImageNet
dataset.
Lunar Technosignatures: A Deep Learning Approach to Detecting Apollo Landing Sites on the Lunar Surface
499
