
Integrating Gait and Clinical Data with Explainable Artificial
Intelligence for Parkinson’s Prediction: The EDAM System
Nicoletta Balletti
1,2
, Emanuela Guglielmi
2
, Gennaro Laudato
2
,
Rocco Oliveto
2,3
, Jonathan Simeone
3
and Roberto Zinni
4
1
Center for Biotechnology, Institute of Biomedical Sciences of the Ministry of Defense, Rome, Italy
2
University of Molise, Pesche (IS), Italy
3
Datasound srl, Pesche (IS), Italy
4
WordPower, San Salvo (CH), Italy
Keywords:
Gait Analysis, Clinical Biomarkers, Explainable Artificial Intelligence, Parkinson’s Disease Detection.
Abstract:
Several machine learning (ML) approaches have been introduced for gait and posture analysis, recognized as
crucial for early diagnosing neurological disorders, particularly Parkinson’s disease. However, these exist-
ing methods are often limited by their lack of integration with other clinical biomarkers and their inability to
provide transparent, explainable predictions. To overcome these limitations, we introduce EDAM (Explain-
able Diagnosis Recommender), a system that leverages Explainable Artificial Intelligence (XAI) techniques
to deliver both accurate predictions and clear, interpretable explanations of its diagnostic decisions. We eval-
uate the capabilities of EDAM in two main areas: distinguishing between healthy individuals and those with
Parkinson’s disease, and classifying abnormal gait patterns that may indicate early-stage Parkinson’s disease.
To ensure a comprehensive evaluation, we constructed one of the largest known dataset by merging and stan-
dardizing several existing datasets. This dataset includes 557 features and 7,303 labelled instances, covering
a wide range of gait patterns and clinical features. Results show that EDAM achieves high accuracy in both
tasks, demonstrating its potential for early detection of neurological disorders.
1 INTRODUCTION
The analysis of gait and posture (motion analysis)
is crucial for the early diagnosis of several patholo-
gies, especially neurological disorders, as well as for
monitoring disease progression and evaluating a pa-
tient’s therapeutic response (Buckley et al., 2019).
Research has shown that by monitoring upper-body
movements, it is possible to differentiate between
healthy individuals and those with Parkinson’s dis-
ease, while patients with ataxic symptoms, such as
those with multiple sclerosis, exhibit deficits in postu-
ral control. Moreover, slow gait has been identified as
a predictor of dementia, with early signs manifesting
up to nine years before an official diagnosis is made
(Buckley et al., 2019).
In the literature, several machine learning (ML)
approaches have been proposed for monitoring and
predicting specific diseases using gait and posture
data acquired through motion analysis systems (e.g.,
(Abdulhay et al., 2018; Costa et al., 2016; Cuzzolin
et al., 2017; Mannini et al., 2016; Raknim and Lan,
2016)). However, these approaches often rely on uni-
variate analyses, treating posture and gait data in iso-
lation from other clinical biomarkers. While this sim-
plification can streamline processing, it may overlook
crucial insights that could emerge from a more com-
prehensive, multivariate analysis (Holzinger et al.,
2017a). Additionally, the robustness of these systems
is a recurring concern. Many studies are based on rel-
atively small patient samples, which limits the gener-
alizability of the findings (Buckley et al., 2019).
Another significant limitation of ML-based mo-
tion analysis systems is their lack of transparency.
The predictions made by these models are frequently
perceived as “black-box” decisions, leaving special-
ists unable to grasp the reasoning behind the outputs
(Holzinger et al., 2017b). This opacity can reduce
trust in the system, prompting specialists to dismiss
even accurate predictions. To address this challenge,
there is an increasing need for systems that offer ex-
Balletti, N., Guglielmi, E., Laudato, G., Oliveto, R., Simeone, J. and Zinni, R.
Integrating Gait and Clinical Data with Explainable Artificial Intelligence for Parkinson’s Prediction: The EDAM System.
DOI: 10.5220/0013179400003911
Paper published under CC license (CC BY-NC-ND 4.0)
In Proceedings of the 18th International Joint Conference on Biomedical Engineering Systems and Technologies (BIOSTEC 2025) - Volume 2: HEALTHINF, pages 129-140
ISBN: 978-989-758-731-3; ISSN: 2184-4305
Proceedings Copyright © 2025 by SCITEPRESS – Science and Technology Publications, Lda.
129

plainable and transparent predictions. Explainable
Artificial Intelligence (XAI) techniques have emerged
as a promising solution, enabling users to understand
the rationale behind ML model outputs (Edwards and
Veale, 2017). These techniques are particularly valu-
able in the medical field, where practitioners must in-
terpret complex, heterogeneous data. AI methods, es-
pecially ML, are crucial for extracting actionable in-
sights from such data, and XAI enhances this process
by making predictions interpretable and useful for hu-
man experts.
To overcome the limitations of current ap-
proaches, in this paper, we present EDAM (Explain-
able Diagnosis Recommender), a system designed to
support predictions related to neurological disorders
by integrating posture and gait data with other clini-
cal biomarkers. The Decision Support System (DSS)
within EDAM—based on advanced ML techniques
(Hastie et al., 2009)—assists specialists in two closely
related tasks: distinguishing between healthy individ-
uals and those with Parkinson’s disease, and detecting
abnormal gait patterns, thereby facilitating the early
detection of neurological pathologies.
EDAM applies XAI techniques to generate trans-
parent, interpretable predictions. By leveraging ex-
plainable machine learning algorithms, EDAM pro-
vides specialists with not only accurate predictions
but also visual and natural-language explanations that
clearly outline the factors influencing the diagnosis.
Additionally, EDAM generates preliminary diagnos-
tic reports (pre-reports) to help specialists analyze the
results both quantitatively and qualitatively. These
user-friendly predictions enhance the interpretation
of data-driven insights, allowing specialists to seam-
lessly integrate their intuition, judgment, and experi-
ence into the decision-making process.
To evaluate the accuracy of EDAM, we con-
ducted a study using a dataset that was constructed
by homogenizing and merging several gait datasets
from the literature (i.e., datasets provided by Mehrizi
et al., 2019,Schreiber and Moissenet, 2019,Jun et al.,
2020, Kour et al., 2020). This process enabled us to
create the largest dataset in the literature, consisting
of 557 features and 7,303 labeled instances, making
it a highly comprehensive resource for gait analysis
and Parkinson’s disease prediction. Besides evaluat-
ing the accuracy of EDAM DSS, the study allowed for
an extensive evaluation of the importance of all gait-
related features in both predicting Parkinson’s dis-
ease and classifying gait types. The results demon-
strated that EDAM achieved high accuracy in both
tasks, with notable performance in detecting early
signs of Parkinson’s disease. Specifically, the classifi-
cation model was able to distinguish between Parkin-
sonian and healthy subjects with a high degree of pre-
cision, and it accurately classified various gait pat-
terns, including those associated with early neurolog-
ical symptoms. These findings underscore the poten-
tial of EDAM in supporting early diagnosis through
gait analysis.
Thus, the specific contributions of the paper can
be summarized as follows:
• the introduction of EDAM, emphasizing its key
features and the integration of explainable AI
techniques for clinical decision support;
• the creation of the largest dataset (to our knowl-
edge) by merging several existing datasets, en-
abling the most comprehensive validation of
machine learning-based prediction models for
Parkinson’s disease detection and gait classifica-
tion;
• an extensive evaluation of the effectiveness of
EDAM in predicting Parkinson’s disease and clas-
sifying various gait patterns. The evaluation
leverages a wide range of features, such as 3D
joint trajectories, rotations, step analysis, and
energy images (Han and Bhanu, 2005)—more
than any prior study has combined simultane-
ously—allowing for a comprehensive analysis of
their collective impact on model performance.
The remainder of the paper is organized as fol-
lows. In Section 2 we provide an overview of the
EDAM system, while in Section 3 and Section 4 we
present the study we conducted to evaluate the EDAM
DSS and the achieved results, respectively. Section 6
concludes the paper, after a discussion of the related
literature (Section 5).
2 EDAM OVERVIEW
EDAM (Explainable Diagnosis Recommender) is an
advanced diagnosis support system integrating mo-
tion analysis with other clinical biomarkers, enhanc-
ing disease prediction and early diagnosis through
XAI. The system addresses several limitations of tra-
ditional ML-based diagnostic approaches, which of-
ten focus narrowly on single data streams and deliver
predictions without offering comprehensible explana-
tions to specialists.
2.1 Architecture and Functionality
The EDAM system is built upon a modular architec-
ture that enables it to process data from various mo-
tion analysis systems and clinical devices, providing
HEALTHINF 2025 - 18th International Conference on Health Informatics
130

both diagnostic insights and explainability for medi-
cal professionals. The key components and function-
alities of EDAM are depicted in Figure 1.
EDAM is designed to capture data from a wide
range of devices, including motion-tracking systems
such as Vicon and Azure Kinect DK, heart rate mon-
itors like the Polar H10, and EEG/EMG sensors such
as DSI-7 and Cometa Mini Wave. The system is
device-agnostic, allowing seamless integration of new
sensors with minimal effort through the use of dedi-
cated drivers. These drivers ensure that data from dif-
ferent devices is formatted into a standardized struc-
ture, enabling consistent and uniform processing by
the system. This flexibility allows EDAM to collect
a comprehensive set of data, including gait parame-
ters, heart rate, EEG, and EMG signals, providing a
richer, multidimensional analysis that surpasses tradi-
tional univariate motion analysis approaches.
The acquired data are stored in a hybrid database
system: A relational database for medical records and
a NoSQL database for sensor-derived data like gait
dynamics and clinical biomarkers. This architecture
allows for efficient querying and flexible data man-
agement, facilitating real-time and historical analyses.
The core of EDAM is its Decision Support System
(DSS), which leverages pre-trained machine learn-
ing models to automatically diagnose specific dis-
eases based on collected data. EDAM currently in-
cludes models for detecting gait deviations, predict-
ing Parkinson’s disease, and calculating the Dynamic
Gait Index (DGI) (Shumway-Cook and Woollacott,
1995) (Balletti et al., 2024). Its flexible design al-
lows for the easy integration of additional predictive
models through standardized APIs, ensuring scalabil-
ity for future enhancements.
A standout feature of EDAM is its Explainable AI
(XAI) module, which uses SHapley Additive exPla-
nations (SHAP) (Lundberg and Lee, 2017) to pro-
vide interpretable insights into the model’s predic-
tions. SHAP values highlight the individual and com-
bined contributions of features such as gait speed or
EMG signals to a diagnosis. This interpretability is
crucial in clinical settings, where understanding the
reasoning behind a diagnosis fosters trust and sup-
ports informed decision-making by specialists.
The XAI module also generates textual explana-
tions, clearly outlining the key factors that influenced
the prediction. These pre-reports are designed for
easy interpretation by medical professionals, offer-
ing transparency and aiding early diagnosis. Addi-
tionally, the system incorporates visual aids like force
plots and image analyses (e.g., Gait Energy Images
and Skeleton Energy Images (Han and Bhanu, 2005))
to further illustrate the influence of specific features
on the predictions.
The continuous learning capability of EDAM en-
sures it stays current with evolving clinical knowl-
edge. After each diagnosis, validated data from spe-
cialists are added to the knowledge base, and once
enough new data is gathered, the ML models are re-
trained to enhance accuracy, keeping EDAM up-to-
date with the latest advancements.
2.2 Data Acquisition and Analysis
The EDAM system facilitates gait data acquisition
and analysis by integrating various sensor types. The
process starts with the technical operator selecting a
patient from a list. Once the patient is chosen, the
operator initiates the data acquisition by selecting the
“Acquisition” option, which opens a window to spec-
ify the examination type. The operator then selects
the data sources, including posture (kinematics), EEG
(brain activity), EMG (muscle activity), and heart
rate. While posture data is mandatory, other sources
are optional depending on the exam’s focus. Appro-
priate devices are chosen for each source. If EMG
data is included, the system provides a configuration
page where the operator assigns sensors to muscles
using a drag-and-drop interface (see Figure 2), with
visual indicators confirming correct sensor-to-muscle
pairing.
After configuration, the system presents both a
visual and textual guide for the patient, including a
video demonstration of the required movement and
a detailed text description. This ensures the patient
clearly understands the task to be performed.
During acquisition, the system captures real-time
data from the selected sources and displays it for the
operator. A 3D avatar visually represents the patient’s
movements, providing front, left, and right views of
the gait (see Figure 3). The operator can zoom in on
specific body parts for a closer examination of move-
ment details. Device status is shown using color-
coded icons: green for successful data transmission,
red for errors, and yellow for connection attempts.
After the exercise is completed, the operator selects
“End Acquisition” to conclude the session, at which
point a window appears for adding session notes,
which can be saved or discarded based on the oper-
ator’s evaluation.
After the data is acquired, it is analyzed through
a comprehensive dashboard. The operator can select
specific joints or muscles for detailed analysis, dis-
played in graphical form. If EMG data was collected,
the system allows the operator to choose specific mus-
cles for analysis; otherwise, it directly displays graphs
of the available data (see Figure 4). The dashboard is
Integrating Gait and Clinical Data with Explainable Artificial Intelligence for Parkinson’s Prediction: The EDAM System
131
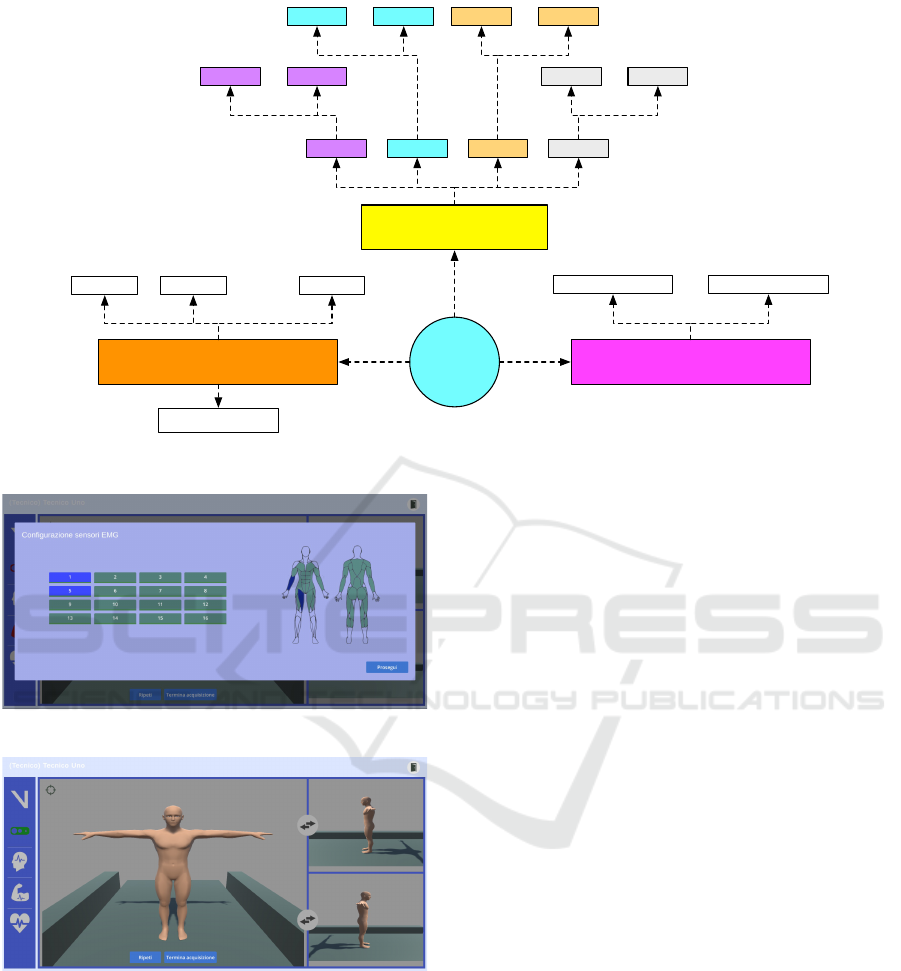
EDAM
Driver 1 Driver n
…
Data Acquisition
Decision Support System
Model 1
…
Model 2 Model m
XAI Module
Database management
Gait Heart EEG EMG
Driver 1 Driver n
…
Driver 1 Driver n
…
Driver 1 Driver n
…
NoSQL DBRelational DB
Figure 1: The EDAM architecture.
Figure 2: Configuration page for EMG data acquisition.
Figure 3: Real-time data acquisition interface of EDAM.
divided into two sections: on the left, a video of the
gait cycle is shown alongside predictions generated by
machine learning models and the Dynamic Gait In-
dex (DGI); on the right, synchronized graphs display
data from posture, EMG, EEG, and heart rate sensors.
These synchronized visuals provide a holistic view of
the data captured during the session.
The Explainable AI (XAI) module of EDAM pro-
vides detailed insights into how predictions are made,
offering visual aids such as force plots and image-
based analyses like Gait Energy Images (GEI) and
Skeleton Energy Images (SEI) to highlight the fea-
tures influencing predictions (see Figure 5). For in-
stance, the system can identify specific areas of the
body contributing to the classification of walking pat-
terns or the diagnosis of conditions such as Parkin-
son’s disease (see Figure 5). This transparency fosters
trust by helping medical professionals understand the
reasoning behind the system’s predictions.
Additionally, the operator can generate a pre-
report that summarizes the collected data and anal-
ysis. This report, which includes system-generated
predictions and explanations (see Figure 5), as well
as any observations made by the operator, can be re-
viewed and refined by specialists, such as physiatrists.
3 EVALUATION OF EDAM
PARKINSON’S DETECTION
CAPABILITIES
We conducted an empirical evaluation to assess the
effectiveness of the EDAM DSS in two key areas:
(i) automatically distinguishing between individuals
with Parkinson’s disease and healthy subjects, and (ii)
classifying gait patterns to support the early detec-
tion of Parkinson’s disease. This second study focuses
specifically on identifying subtle gait deviations that
may indicate the early stages of Parkinson’s disease.
HEALTHINF 2025 - 18th International Conference on Health Informatics
132
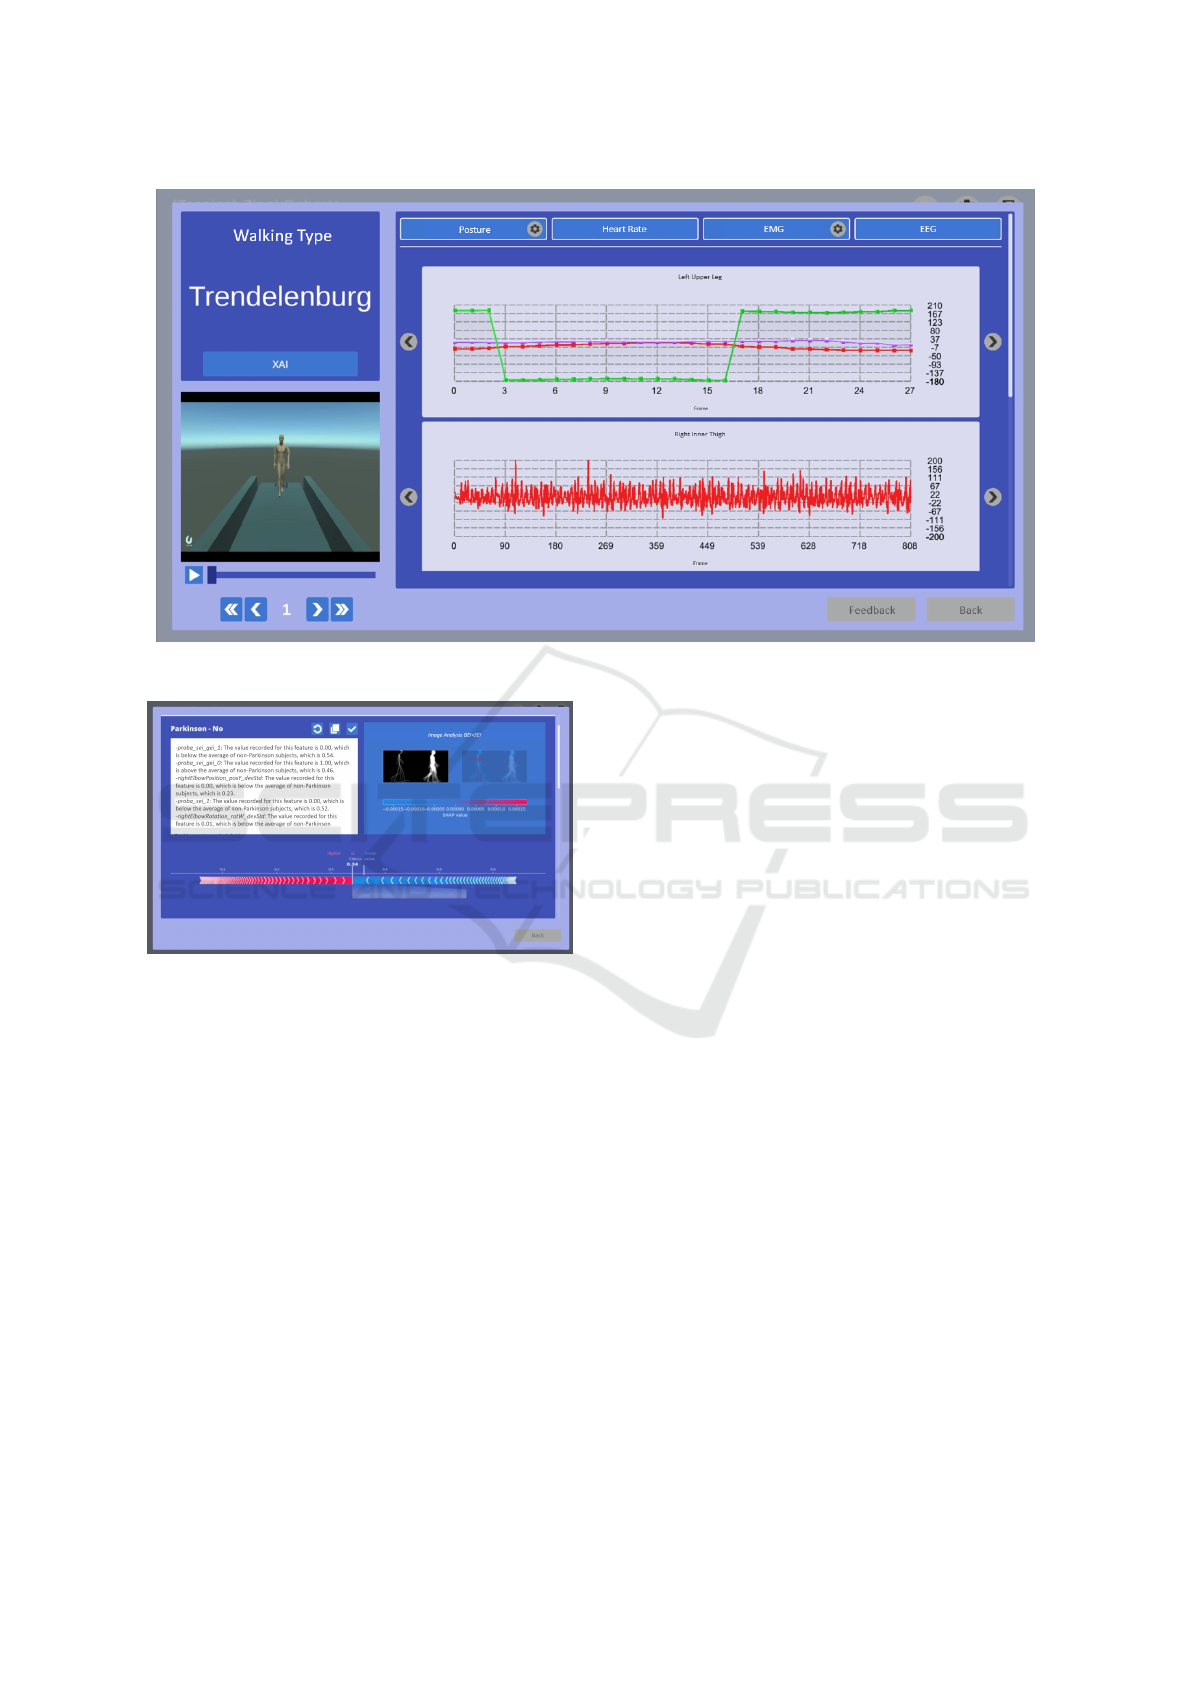
Figure 4: EDAM dashboard displaying gait cycle video, predictions, and synchronized sensor data.
Figure 5: Explainable AI (XAI) Interface Displaying Gait
Energy Images, Force Plots, and System-Generated Predic-
tions for Transparent Analysis.
3.1 Study Definition
The study is guided by the following interconnected
research questions:
• RQ
1
: To what extent can EDAM distinguish a
healthy subject from a subject with Parkinson’s
disease?
• RQ
2
: To what extent can EDAM automatically
classify a subject’s gait to support early Parkin-
son’s detection?
The first research question assesses EDAM ac-
curacy in distinguishing between healthy individuals
and those with Parkinson’s disease. Building on this,
the second research question evaluates EDAM ability
to classify a subject’s gait into one of six categories:
Antalgic, Lurch, Normal, Steppage, Stiff-Legged, and
Trendelenburg. This link between the two research
questions is crucial, as certain gait types, such as Step-
page or Stiff-Legged, are known to be early indica-
tors of Parkinson’s disease. By accurately classifying
these gait patterns, EDAM can detect subtle devia-
tions in movement that may suggest the early onset
of Parkinson’s, thereby facilitating early diagnosis.
Thus, while the first question focuses on distinguish-
ing known cases of Parkinson’s, the second question
explores EDAM potential for early detection through
gait analysis.
3.2 Context of the Study
To evaluate EDAM’s capabilities in detecting Parkin-
son’s disease and classifying gait types, we compiled
a comprehensive and standardized dataset by integrat-
ing several well-established datasets from the litera-
ture, including those referenced in the following stud-
ies:
• Mehrizi et al., 2019: This dataset includes gait
recordings from 23 patients with Parkinson’s dis-
ease, 22 with postural stroke, 25 with orthope-
dic issues, and 25 healthy controls. Participants
walked on a treadmill for about a minute, while
two digital cameras captured their movement, and
a motion capture system tracked reflective mark-
ers placed on key body joints. The dataset in-
cludes 24 time series representing the 3D position
of 8 body joints in three directions (x, y, z), col-
lected at a 100 Hz sampling rate. The goal was to
detect health problems related to gait using deep
Integrating Gait and Clinical Data with Explainable Artificial Intelligence for Parkinson’s Prediction: The EDAM System
133

neural networks for pose estimation.
• Schreiber and Moissenet, 2019: This dataset con-
tains gait data from 50 participants (24 women
and 26 men), acquired during a single session
where participants walked naturally on a 10-meter
walkway. Five walking speed conditions were
recorded, from slow to fast, using a 10-camera op-
toelectronic system sampling at 100 Hz. The sys-
tem tracked 3D trajectories of 52 reflective skin
markers placed on anatomical landmarks. The
dataset is designed for analyzing human gait at
different walking speeds.
• Jun et al., 2020: This dataset consists of gait data
from 10 healthy participants, each simulating five
different pathological gaits (antalgic, stiff-legged,
lurch, steppage, and Trendelenburg). The data
was captured using six Microsoft Kinect v2 sen-
sors, providing 3D coordinates for 25 body joints.
Each participant walked 20 times per gait type,
generating 3D skeletal data for the classification
of different gait patterns. The simulation guide-
lines focused on replicating mechanical limita-
tions, such as restricted joint movement.
• Kour et al., 2020: This dataset includes gait
recordings from 96 subjects: 50 with knee os-
teoarthritis, 16 with Parkinson’s disease, and 30
healthy individuals. Each participant performed
two gait sequences (left to right and right to left) in
the frontal/sagittal plane. The data was collected
using a NIKON DSLR camera positioned 8 me-
ters away from the walking path, and six passive
reflective markers attached to the subjects’ joints.
The dataset is in video format (.mov), designed
for analyzing gait differences between healthy in-
dividuals and those with musculoskeletal or neu-
rological conditions.
These datasets were initially developed for train-
ing machine learning (ML) models in gait analysis
and Parkinson’s disease prediction. Still, they varied
in terms of the features they provided, leading to chal-
lenges in ensuring reliable and reproducible model
performance across different clinical and commercial
settings. To address this issue, we merged instances
from various datasets and enhanced the dataset by cal-
culating missing features, creating a unified resource
that covers all relevant domains.
The analysis of these datasets indicated that the
most commonly used gait features fall into three do-
mains: (i) 3D trajectories of body joints, (ii) step-
related features such as swing and stance phases, and
(iii) Gait Energy Image (GEI) and Skeleton Energy
Image (SEI) data. However, none of the original
datasets contained a complete set of features from all
domains. Therefore, we employed an extensive fea-
ture engineering process to create a cohesive dataset.
For datasets that contained only 3D body joint tra-
jectories, we derived additional step-related features
(e.g., swing and stance) using custom-built feature en-
gineering strategies (Amboni et al., 2021). Further-
more, using the 3D trajectory data, we animated a
mannequin and reconstructed GEI and SEI data, pro-
viding a more comprehensive feature set. In cases
where only exercise execution videos were available,
we utilized the Plask tool
1
to extract 3D trajectories,
allowing us to compute all necessary features using
the same procedures applied to the other datasets.
Through this process, we constructed the largest
dataset ever used in the literature for gait classifica-
tion and Parkinson’s disease prediction, featuring a
total of 557 distinct features. These include 304 fea-
tures related to joint rotations, 228 features represent-
ing body trajectories, 17 features capturing pitch, and
6 features derived from GEI and SEI data. The dataset
encompasses 7,303 labelled instances, categorized as
follows: 20 instances labelled as Parkinson’s disease,
34 as healthy controls, and the remaining instances
divided among six different gait types (e.g., antalgic,
lurch).
3.3 Experimental Procedure
To address RQ
1
and RQ
2
, we adopted a Leave-
One-Subject-Out (L1SO) cross-validation approach
(Hastie et al., 2009). In this method, the dataset is
divided into n folds, each corresponding to a differ-
ent patient. For each iteration, one fold is used as the
test set, while the remaining n-1 folds are used for
training. This ensures that the data of each patient are
included in the training set n-1 times and in the test
set only once, preventing the model from being tested
on data from the same patient. This design simulates
a real-world scenario where predictions are made for
a patient being tested for the first time.
As previously mentioned, the dataset used for the
experiments consists of 7,303 labeled instances. For
RQ
1
, we used the 20 instances labelled as Parkinson’s
disease and the 34 instances labelled as healthy, to-
talling 54 instances. For RQ
2
, the remaining 7,093 in-
stances, corresponding to the six different gait types,
were used to evaluate EDAM gait classification accu-
racy.
We evaluated the proposed approach in two differ-
ent scenarios: Lower body, where only features from
the lower part of the body were used, and Full body,
where features from both the lower and upper body
were provided as input.
1
https://plask.ai/en-US
HEALTHINF 2025 - 18th International Conference on Health Informatics
134

During the experimentation, we applied two fea-
ture engineering techniques: (i) correlation analysis to
discard features with a correlation index higher than
0.95 (Guyon and Elisseeff, 2003), and (ii) automatic
feature selection to identify the most relevant descrip-
tors for classification (Li et al., 2017).
We tested 13 different machine learning models
(Hastie et al., 2009): Random Forest (RF), Multi-
Layer Perceptron (MLP), Logistic Regression (LR),
K-Nearest Neighbors (KNN), Gaussian Naive Bayes
(GNB), Stochastic Gradient Descent (SGD), Deci-
sion Tree (DT), Bagging Classifier (BC), Gradient
Boosting Classifier (GBC), AdaBoost (AB), Passive
Aggressive Classifier (PAC), Extra Trees Classifier
(ETC), and Support Vector Machine (SVM).
3.4 Evaluation Metrics
The following metrics (Hastie et al., 2009) were used
to evaluate the performance of the EDAM DSS and
address our research questions:
• Accuracy: The ratio of correctly classified in-
stances to the total number of instances.
Accuracy =
T P + T N
T P + T N + FP + FN
• Precision: The ratio of correctly classified pos-
itive instances to the total number of instances
classified as positive.
Precision =
T P
T P + FP
• Recall: The ratio of correctly classified positive
instances to the sum of correctly classified posi-
tive instances and those incorrectly classified as
negative.
Recall =
T P
T P + FN
• F1-Score: The harmonic mean of precision and
recall.
F1-score = 2 ×
Precision × Recall
Precision + Recall
Before evaluating the machine learning models in
relation to our research questions, we performed a
feature analysis using Principal Component Analysis
(PCA) (Wold et al., 1987) to identify the most relevant
features for (i) predicting Parkinson’s disease and (ii)
classifying gait. This analysis was carried out for both
the Lower body and Full body scenarios.
4 ANALYSIS OF THE RESULTS
In this section, we present the analysis of results for
the two research questions (RQs) of our study.
4.1 RQ
1
: Parkinson’s Prediction
The PCA analysis conducted for both the Lower Body
and Full Body scenarios revealed important insights
regarding the relevance of various feature domains in
predicting Parkinson’s disease. In the Lower Body
scenario, PCA showed that 32 features explained
97.8% of the variance (see Figure 6), including 20
from the rotation domain, 7 from the pitch domain,
4 from trajectories, and 1 from the GEI/SEI domain.
This result is significant as it highlights the contribu-
tion of each feature domain, particularly the rotation
domain, which was introduced in EDAM and has not
been extensively explored in prior studies.
Figure 6: Parkinson (Lower body): Variance Analysis.
In the Full Body scenario, PCA revealed that 33
features explained 97.5% of the variance (see Fig-
ure 7). Notably, none of the features from the
GEI/SEI domain were included in this set; the fea-
tures were instead distributed across the rotation (25
features), trajectory (6 features), and pitch (2 features)
domains. This suggests that GEI/SEI features may
be more valuable when only lower body information
is available. Importantly, the rotation features once
again proved to be crucial in identifying Parkinson’s,
reinforcing their relevance across both scenarios.
Focusing on the accuracy of detecting subjects
with Parkinson’s disease, experimental results indi-
cate that in the Lower Body scenario, 170 out of the
384 tested machine learning pipelines achieved 100%
accuracy. Similarly, in the Full Body scenario, 168
pipelines reached perfect accuracy. While these re-
sults are highly encouraging, further experimentation
is necessary to validate the generalizability of the
findings across more diverse datasets.
Nevertheless, it is worth noting that the combi-
nation of numerical features, such as 3D joint tra-
jectories and rotational data, with graphical features
like GEI and SEI, clearly enhances the overall predic-
Integrating Gait and Clinical Data with Explainable Artificial Intelligence for Parkinson’s Prediction: The EDAM System
135

Figure 7: Parkinson (Full body): Variance Analysis.
tion accuracy. As shown in Table 1, a system rely-
ing solely on GEI and SEI features achieved an accu-
racy of approximately 94%, underscoring their valu-
able contribution to the prediction process.
Table 1: Performance of EDAM Parkinson’s prediction
model based exclusively on GEI and SEI features.
Accuracy Precision Recall F1-Score
Mean 0.94 1.00 0.94 0.95
Median 1.00 1.00 1.00 1.00
Std.dev 0.21 0.00 0.21 0.18
To further analyze the contribution of individual
features, we examined one of the models with the
highest accuracy, which was based on a Decision
Tree. This model did not use synthetic oversampling
or feature correlation analysis but applied an auto-
matic feature selection algorithm based on Random
Forest. Decision Trees were chosen not only for their
accuracy but also for their interpretability, making
them well-suited for the EDAM system, which aims
to generate understandable preliminary reports (pre-
reports) based on predictions.
As seen in Table 2, the distribution of selected
features across the four domains (Rotations, Trajec-
tories, Step, and GEI/SEI) for both the Lower Body
and Full Body scenarios reinforces the findings from
the PCA analysis. This highlights the importance of
considering all feature domains in knowledge base of
EDAM, with rotation and trajectory features proving
especially influential.
Answer to RQ
1
. The evaluation of the EDAM DSS
demonstrates that the selected machine learning mod-
els, in both the Lower Body and Full Body scenarios,
achieved high accuracy in predicting Parkinson’s dis-
ease. The distribution of features across the domains
of rotations, trajectories, step, and GEI/SEI under-
scores the importance of each domain in the knowl-
Table 2: Feature distribution across Lower Body and Full
Body scenarios.
Domain Lower Body Full Body
Rotations 208 304
Trajectories 132 228
Step 13 17
GEI/SEI 6 6
Total Features 359 557
edge base of the system, further supporting the in-
sights gained from the PCA analysis.
4.2 RQ
2
: Gait Classification
In the Lower Body scenario, PCA revealed that 113
features explained 98.4% of the variance (see Fig-
ure 8). Of these, 76 were from the rotation domain,
18 from the step domain, 18 from trajectories, and 1
from the GEI/SEI domain. This finding underscores
the relevance of all feature domains in the context of
gait classification, particularly highlighting the rota-
tion domain, which, although rarely explored in the
literature, proves to be especially important in this
context.
Figure 8: Gait Classification (Lower body): Variance Anal-
ysis.
A similar result was observed in the Full Body sce-
nario (see Figure 9), where PCA identified 174 fea-
tures that explained 98.8% of the variance. In con-
trast to the Lower Body scenario, no GEI/SEI features
were included in this set. Specifically, the 174 fea-
tures came from the rotation domain (124), the tra-
jectory domain (26), and the step domain (21). This
aligns with the findings from the Parkinson’s predic-
tion analysis, suggesting that GEI/SEI features may
be particularly useful when only lower body motion
data is available, while the rotation domain consis-
tently plays a crucial role in gait classification.
HEALTHINF 2025 - 18th International Conference on Health Informatics
136

Table 3: Confusion matrix for the EDAM gait classification model in the Lower Body scenario.
Actual Antalgic Lurch Normal Steppage Stiff-Legged Trendelenburg
Antalgic 2,122 16 32 38 62 108
Lurch 0 2,308 0 2 0 20
Normal 4 2 2,346 0 0 40
Steppage 44 28 8 2,246 2 42
Stiff-Legged 84 2 36 0 2,208 42
Trendelenburg 206 98 386 20 14 1,636
Table 4: Results obtained from the gait classification model
in the Lower body scenario.
Class Precision Recall F1-score
Antalgic 0.86 0.89 0.88
Lurch 0.94 0.99 0.96
Normal 0.84 0.98 0.90
Steppage 0.97 0.95 0.96
Stiff-Legged 0.97 0.93 0.95
Trendelenburg 0.87 0.69 0.77
Global Accuracy 0.91
Figure 9: Gait Classification (Full body): Variance Analy-
sis.
For gait classification, the results in the Lower
Body scenario demonstrated that the best performance
was achieved using a machine learning pipeline based
on a linear Support Vector Machine (SVM) classifier.
This pipeline did not use synthetic oversampling or
feature correlation analysis, but included automatic
feature selection via Logistic Regression. The model
was built using 124 features: 12 from the rotation do-
main, 94 from the trajectory domain, 15 from the step
domain, and 3 from the GEI/SEI domain. This out-
come aligns with the findings of the PCA analysis, re-
inforcing the critical importance of trajectory features
in the gait classification process for the lower body
scenario. The model achieved an accuracy of 91%, in-
dicating strong performance in classifying gait types.
Table 3 presents the confusion matrix for the
gait classification model in the Lower Body scenario,
while Table 4 reports the results obtained in terms of
precision, recall and F1-score for each class.
The analysis of the results shows that both the
Steppage and Stiff-legged gait classes, which are asso-
ciated with early neurological symptoms, performed
very well. The Steppage class achieved metrics ex-
ceeding 95%, while the Stiff-legged class, often linked
to early signs of Parkinson’s disease, reached an ac-
curacy of 97% and a recall of 93%. These findings
underscore the potential of EDAM in the early detec-
tion of Parkinson’s disease, demonstrating its ability
to effectively identify key gait deviations associated
with the onset of the condition.
In the Full Body scenario, similar to the Lower
Body scenario, the best performance was achieved us-
ing a linear Support Vector Machine (SVM) classi-
fication algorithm. This pipeline also excluded syn-
thetic oversampling and feature correlation analysis,
but employed an automatic feature selection algo-
rithm based on Extra Trees. The model was con-
structed with 250 features, including 131 from the ro-
tation domain, 63 from trajectories, 5 from the step
domain, and 6 from the GEI/SEI domain. Unlike the
Lower Body scenario, the most influential features for
gait classification in this case were those from the ro-
tation domain, aligning with the findings from Parkin-
son’s disease prediction.
Regarding the accuracy metrics, Table 5 and Ta-
ble 6 present the precision, recall, and F1-score val-
ues for each class. In this scenario, the highest ac-
curacy was achieved for the Lurch class. However,
the Steppage and Stiff-legged classes continued to per-
form well, with recall values of 94% and 95%, re-
spectively, and precision values of 96% and 97%, re-
spectively. These results reinforce the robustness of
EDAM in classifying early symptoms of neurological
conditions such as Parkinson’s disease.
Answer to RQ
2
. The gait classification models in
the Lower Body scenario achieved 91% accuracy,
Integrating Gait and Clinical Data with Explainable Artificial Intelligence for Parkinson’s Prediction: The EDAM System
137

Table 5: Confusion matrix of the EDAM gait classification model in the Full body scenario.
Actual Antalgic Lurch Normal Steppage Stiff-Legged Trendelenburg
Antalgic 2,042 4 48 102 12 170
Lurch 8 2,262 2 12 28 18
Normal 48 0 2,312 10 0 22
Steppage 52 22 10 2,278 2 6
Stiff-Legged 30 6 10 8 2,308 16
Trendelenburg 134 18 186 2 10 2,010
Table 6: Results obtained from the gait classification model
in the Full body scenario.
Class Precision Recall F1-score
Antalgic 0.88 0.86 0.87
Lurch 0.98 0.97 0.97
Normal 0.90 0.97 0.93
Steppage 0.94 0.96 0.95
Stiff-Legged 0.95 0.97 0.97
Trendelenburg 0.90 0.85 0.87
Global Accuracy 0.93
with trajectory features playing a key role, especially
for the Steppage class, which is associated with early
neurological symptoms. Similarly, in the Full Body
scenario, the models reached 93% accuracy, where
rotation features proved most influential. Notably,
in both scenarios, the Stiff-Legged class, which is
closely linked to the early signs of Parkinson’s dis-
ease, showed strong performance, achieving high pre-
cision and recall. These results underscore the po-
tential of EDAM to effectively identify gait patterns
that could be early indicators of Parkinson’s disease,
demonstrating its capability for early diagnosis.
5 RELATED WORK
Numerous studies in the literature have focused on
evaluating the effectiveness of machine learning (ML)
techniques in monitoring and predicting specific dis-
eases based on gait and posture data acquired through
motion analysis systems (e.g., (Abdulhay et al., 2018;
Costa et al., 2016; Cuzzolin et al., 2017; Man-
nini et al., 2016; Raknim and Lan, 2016)). Daliri,
2012 proposed a system that combines time series
data from foot signals with Support Vector Machine
(SVM) algorithms to predict diseases, including ALS.
Additionally, Ajay et al., 2018 introduced a system
for analyzing and classifying parkinsonian gait us-
ing videos captured by pervasive devices (e.g., smart-
phones, webcams, and surveillance cameras) through
a skeleton extraction model that directly detects joint
information from video frames. Vilas-Boas et al.,
2021 evaluated the use of ML techniques to build a
model capable of identifying the Val30Met mutation
based on gait characteristics. The study utilized the
Kinect v2 sensor to capture 24 gait parameters while
individuals walked toward the camera. Multiple ma-
chine learning algorithms were tested, including k-
nearest neighbors (KNN), decision trees, random for-
est, SVM, and Multilayer Perceptron. The authors
constructed a model with an average accuracy of 92%
in distinguishing healthy individuals from mutation
carriers (with or without symptoms), and 98% ac-
curacy in distinguishing between asymptomatic and
symptomatic carriers (both using SVM). Zhang and
Ma, 2019 investigated the application of supervised
machine learning algorithms in classifying sagittal
gait patterns in children with spastic diplegia. Gait
parameters were extracted from data obtained from
200 children, and the results demonstrated that an ar-
tificial neural network (ANN) achieved an accuracy
of 93.5%, proving to be a promising tool for auto-
matic interpretation of gait data. The literature high-
lights the benefits of gait analysis in assessing mo-
tor deficits, as gait is a fundamental, physiological,
and unforced form of locomotion with direct clini-
cal relevance. However, current systems that focus
on videographic gait analysis often produce variable
and non-repeatable results (Abada et al., 2013; Guil-
lot et al., 2008; Hampton and Amende, 2009; Mead
et al., 2011; Vinsant et al., 2013; Wooley et al.,
2005). This variability is not surprising, as many
key changes in limb positioning and movement dy-
namics are only visible from the lateral plane. Con-
sequently, recent efforts have focused on developing
systems that incorporate machine learning algorithms
(e.g., NeuroCube) and lateral view analysis (e.g., Mo-
toRater, Locomouse (Machado et al., 2015)) to ana-
lyze gait more comprehensively (Alexandrov et al.,
2015; Bellardita and Kiehn, 2015; de Bruin et al.,
2016; Talpalar et al., 2013). However, the full poten-
tial of lateral plane videography has yet to be realized,
as current analyses are often limited to a few func-
tional aspects and a small number of gait parameters
HEALTHINF 2025 - 18th International Conference on Health Informatics
138

(Preisig et al., 2016). A multi-camera system could
potentially provide better results by enabling detailed
joint analysis from different angles.
6 CONCLUSION AND FUTURE
WORK
In this paper, we addressed the challenges of gait
and posture analysis for the early diagnosis of neu-
rological disorders, particularly Parkinson’s disease,
through machine learning (ML)-based approaches.
Traditional methods often lack integration with clin-
ical biomarkers and fail to provide transparent, ex-
plainable predictions, limiting their clinical utility. To
address these limitations, we introduced EDAM (Ex-
plainable Diagnosis Recommender), a decision sup-
port system that integrates posture and gait data with
clinical biomarkers using Explainable AI (XAI) tech-
niques.
EDAM not only predicts the likelihood of neu-
rological disorders like Parkinson’s disease but also
explains its diagnostic decisions through visual and
natural-language outputs. This combination enhances
the trustworthiness and usability of predictions, sup-
porting specialists in making data-informed decisions
that incorporate their intuition, judgment, and experi-
ence. Furthermore, EDAM generates pre-reports that
assist clinicians in both qualitative and quantitative
evaluations of patient conditions.
To validate the effectiveness of EDAM, we con-
structed one of the largest dataset known in the lit-
erature by merging several established gait datasets.
This dataset contains 557 features and 7,303 labelled
instances, making it the most comprehensive resource
for evaluating machine learning models in the con-
text of Parkinson’s prediction and gait classification.
EDAM achieved high accuracy in distinguishing be-
tween healthy individuals and those with Parkinson’s
disease, as well as in classifying abnormal gait pat-
terns linked to early-stage neurological disorders.
Future works will focus on expanding the range
of pathologies covered by the system, improving
model generalization across diverse populations, and
further refining the interpretability of its predictions
through advanced XAI techniques. We also plan to
conduct studies to assess the contribution of addi-
tional biomarkers in identifying neurological disor-
ders when combined with posture data. Furthermore,
we intend to perform experiments with specialists to
evaluate the acceptability of the predictions of EDAM
and the clarity of their explanations.
ACKNOWLEDGEMENT
This research was supported by Italian General In-
spectorate of Military Medical Services (IGESAN)
under Military Health Research Plan - Project n.
9908115328 (CIG).
REFERENCES
Abada, Y.-s. K., Nguyen, H. P., Schreiber, R., and Ellen-
broek, B. (2013). Assessment of motor function, sen-
sory motor gating and recognition memory in a novel
bachd transgenic rat model for huntington disease.
PloS one, 8(7):e68584.
Abdulhay, E., Arunkumar, N., Narasimhan, K., Vellaiap-
pan, E., and Venkatraman, V. (2018). Gait and tremor
investigation using machine learning techniques for
the diagnosis of parkinson disease. Future Genera-
tion Computer Systems, 83:366–373.
Ajay, J., Song, C., Wang, A., Langan, J., Li, Z., and Xu,
W. (2018). A pervasive and sensor-free deep learn-
ing system for parkinsonian gait analysis. In 2018
IEEE EMBS International Conference on Biomedical
& Health Informatics (BHI), pages 108–111. IEEE.
Alexandrov, V., Brunner, D., Hanania, T., and Leahy, E.
(2015). High-throughput analysis of behavior for
drug discovery. European journal of pharmacology,
750:82–89.
Amboni, M. et al. (2021). Gait analysis may distinguish
progressive supranuclear palsy and parkinson disease
since the earliest stages. Scientific Reports, 11(1):1–9.
Balletti, N., Zinni, R., Russodivito, M., Laudato, G., Scal-
abrino, S., and Oliveto, R. (2024). A machine learn-
ing model for the qualitative assessment of human gait
based on video features. In Proceedings of the 17th In-
ternational Joint Conference on Biomedical Engineer-
ing Systems and Technologies – HEALTHINF, Rome,
Italy.
Bellardita, C. and Kiehn, O. (2015). Phenotypic charac-
terization of speed-associated gait changes in mice
reveals modular organization of locomotor networks.
Current Biology, 25(11):1426–1436.
Buckley, C., Alcock, L., McArdle, R., Rehman, R. Z. U.,
Del Din, S., Mazz
`
a, C., Yarnall, A. J., and Rochester,
L. (2019). The role of movement analysis in diagnos-
ing and monitoring neurodegenerative conditions: In-
sights from gait and postural control. Brain sciences,
9(2):34.
Costa, L., Gago, M. F., Yelshyna, D., Ferreira, J.,
David Silva, H., Rocha, L., Sousa, N., and Bi-
cho, E. (2016). Application of machine learning
in postural control kinematics for the diagnosis of
alzheimer’s disease. Computational intelligence and
neuroscience, 2016(1):3891253.
Cuzzolin, F., Sapienza, M., Esser, P., Saha, S., Franssen,
M. M., Collett, J., and Dawes, H. (2017). Metric learn-
ing for parkinsonian identification from imu gait mea-
surements. Gait & posture, 54:127–132.
Integrating Gait and Clinical Data with Explainable Artificial Intelligence for Parkinson’s Prediction: The EDAM System
139

Daliri, M. R. (2012). Automatic diagnosis of neuro-
degenerative diseases using gait dynamics. Measure-
ment, 45(7):1729–1734.
de Bruin, N., Schmitz, K., Schiffmann, S., Tafferner, N.,
Schmidt, M., Jordan, H., H
¨
außler, A., Tegeder, I.,
Geisslinger, G., and Parnham, M. (2016). Multiple
rodent models and behavioral measures reveal unex-
pected responses to fty720 and dmf in experimental
autoimmune encephalomyelitis. Behavioural brain
research, 300:160–174.
Edwards, L. and Veale, M. (2017). Slave to the algorithm?
why a’right to an explanation’is probably not the rem-
edy you are looking for. Duke L. & Tech. Rev., 16:18.
Guillot, T. S., Asress, S. A., Richardson, J. R., Glass, J. D.,
and Miller, G. W. (2008). Treadmill gait analysis does
not detect motor deficits in animal models of parkin-
son’s disease or amyotrophic lateral sclerosis. Journal
of motor behavior, 40(6):568–577.
Guyon, I. and Elisseeff, A. (2003). An introduction to vari-
able and feature selection. Journal of machine learn-
ing research, 3:1157–1182.
Hampton, T. G. and Amende, I. (2009). Treadmill gait anal-
ysis characterizes gait alterations in parkinson’s dis-
ease and amyotrophic lateral sclerosis mouse models.
Journal of motor behavior, 42(1):1–4.
Han, J. and Bhanu, B. (2005). Individual recognition using
gait energy image. In 2005 IEEE Computer Society
Conference on Computer Vision and Pattern Recogni-
tion (CVPR’05), volume 2, pages i–i. IEEE.
Hastie, T., Tibshirani, R., and Friedman, J. (2009). The Ele-
ments of Statistical Learning: Data Mining, Inference,
and Prediction. Springer Science & Business Media.
Holzinger, A., Biemann, C., Pattichis, C. S., and Kell, D. B.
(2017a). What do we need to build explainable ai
systems for the medical domain? arXiv preprint
arXiv:1712.09923.
Holzinger, A., Malle, B., Kieseberg, P., Roth, P. M.,
M
¨
uller, H., Reihs, R., and Zatloukal, K. (2017b).
Towards the augmented pathologist: Challenges of
explainable-ai in digital pathology. arXiv preprint
arXiv:1712.06657.
Jun, K., Lee, Y., Lee, S., Lee, D. W., and Kim, M. S.
(2020). Pathological gait classification using kinect
v2 and gated recurrent neural networks. IEEE Access,
8:139881–139891.
Kour, N., Gupta, S., and Arora, S. (2020). Gait dataset
for knee osteoarthritis and parkinson’s disease anal-
ysis with severity levels.
Li, J., Cheng, K., Wang, S., Morstatter, F., Trevino, R. P.,
Tang, J., and Liu, H. (2017). Feature selection: A
data perspective. ACM Computing Surveys (CSUR),
50(6):1–45.
Lundberg, S. M. and Lee, S.-I. (2017). A unified approach
to interpreting model predictions. In Proceedings of
the 31st International Conference on Neural Infor-
mation Processing Systems (NIPS), pages 4765–4774.
Curran Associates Inc.
Machado, A. S., Darmohray, D. M., Fayad, J., Marques,
H. G., and Carey, M. R. (2015). A quantitative frame-
work for whole-body coordination reveals specific
deficits in freely walking ataxic mice. elife, 4:e07892.
Mannini, A., Trojaniello, D., Cereatti, A., and Sabatini,
A. M. (2016). A machine learning framework for gait
classification using inertial sensors: Application to el-
derly, post-stroke and huntington’s disease patients.
Sensors, 16(1):134.
Mead, R. J., Bennett, E. J., Kennerley, A. J., Sharp, P.,
Sunyach, C., Kasher, P., Berwick, J., Pettmann, B.,
Battaglia, G., Azzouz, M., et al. (2011). Optimised
and rapid pre-clinical screening in the sod1g93a trans-
genic mouse model of amyotrophic lateral sclerosis
(als). PloS one, 6(8):e23244.
Mehrizi, R., Peng, X., Zhang, S., Liao, R., and Li, K.
(2019). Automatic health problem detection from gait
videos using deep neural networks. arXiv preprint
arXiv:1906.01480.
Preisig, D. F., Kulic, L., Kr
¨
uger, M., Wirth, F., McAfoose,
J., Sp
¨
ani, C., Gantenbein, P., Derungs, R., Nitsch,
R. M., and Welt, T. (2016). High-speed video gait
analysis reveals early and characteristic locomotor
phenotypes in mouse models of neurodegenerative
movement disorders. Behavioural brain research,
311:340–353.
Raknim, P. and Lan, K.-c. (2016). Gait monitoring for
early neurological disorder detection using sensors in
a smartphone: Validation and a case study of parkin-
sonism. Telemedicine and e-Health, 22(1):75–81.
Schreiber, C. and Moissenet, F. (2019). A multimodal
dataset of human gait at different walking speeds es-
tablished on injury-free adult participants. Scientific
Data, 6(1):1–7.
Shumway-Cook, A. and Woollacott, M. H. (1995). The
dynamic gait index to quantify gait ability in patients
with vestibular and balance disorders. Physical ther-
apy, 75(6):538–548.
Talpalar, A. E., Bouvier, J., Borgius, L., Fortin, G., Pierani,
A., and Kiehn, O. (2013). Dual-mode operation of
neuronal networks involved in left–right alternation.
Nature, 500(7460):85–88.
Vilas-Boas, M. D. C., Rocha, A. P., Cardoso, M. N., Fer-
nandes, J. M., Coelho, T., and Cunha, J. P. S. (2021).
Supporting the assessment of hereditary transthyretin
amyloidosis patients based on 3-d gait analysis and
machine learning. IEEE Transactions on Neural Sys-
tems and Rehabilitation Engineering, 29:1350–1362.
Vinsant, S., Mansfield, C., Jimenez-Moreno, R., Moore,
V. D. G., Yoshikawa, M., Hampton, T. G., Prevette,
D., Caress, J., Oppenheim, R. W., and Milligan, C.
(2013). Characterization of early pathogenesis in the
sod1 g93a mouse model of als: part i, background and
methods. Brain and behavior, 3(4):335–350.
Wold, S., Esbensen, K., and Geladi, P. (1987). Principal
component analysis. Chemometrics and intelligent
laboratory systems, 2(1-3):37–52.
Wooley, C. M., Sher, R. B., Kale, A., Frankel, W. N., Cox,
G. A., and Seburn, K. L. (2005). Gait analysis detects
early changes in transgenic sod1 (g93a) mice. Muscle
& Nerve: Official Journal of the American Associa-
tion of Electrodiagnostic Medicine, 32(1):43–50.
Zhang, Y. and Ma, Y. (2019). Application of supervised
machine learning algorithms in the classification of
sagittal gait patterns of cerebral palsy children with
spastic diplegia. Computers in biology and medicine,
106:33–39.
HEALTHINF 2025 - 18th International Conference on Health Informatics
140
