
Strategic Returns Prevention in E-Commerce: Simulating Financial and
Environmental Outcomes Through Agent-Based Modeling
Marie Niederlaender
1 a
, Urs Liebau
2 b
, Yajing Chen
2 c
, Emil Breustedt
2 d
, Saad Driouech
1 e
and Dirk Werth
1 f
1
August-Wilhelm Scheer Institut, Uni Campus D 5 1, Saarbr
¨
ucken, Germany
2
August-Wilhelm Scheer Institut, Center for Digital Greentech, Clausthal-Zellerfeld, Germany
fi
Keywords:
Agent-Based Simulation, Customer Returns Behavior, Return Prevention, Sustainable Supply Chain.
Abstract:
Product returns pose an environmental and financial burden on manufacturers and online retailers worldwide,
especially in the fashion sector. Over 50% of all ordered garments end up being returned, which gives rise
to an ongoing search for approaches to successfully manage returns or to avoid returns in the first place. For
both approaches, an accurate prediction of returns can be useful, since it allows for an improved inventory risk
assessment and strategic reselling of garments, while also providing crucial information on common drivers
of return rates. This study focuses on preventive strategies in the context of customers placing selection
orders in online shops. An Agent based approach provides insight into the outcomes of three different return
prevention strategies, which are compared with the original outcome of real world data from a German clothing
manufacturer selling garments for special occasions. The four outcomes are analysed in terms of their financial
and environmental impact, utilising common life cycle assessment strategies.
1 INTRODUCTION
The global fashion e-commerce market has continu-
ously grown each year over the past years alongside
the growth of online retail in general. With fashion
e-commerce being forecast to reach over US 781.5
billion in 2024 and an estimate to reach US 1.6 tril-
lion by 2030, the fashion sector is the largest B2C
e-commerce market segment to date (Statista, 2024).
Alongside the increasing revenue comes the finan-
cial and environmental burden of an increasing vol-
ume of product returns. In 2022, most product returns
were associated with the fashion sector, for example
in Germany, a share of 91% of returns were fash-
ion items (Forschungsgruppe Retourenmanagement,
2022). Due to the additional costs that returns im-
pose on online retailers due to the necessary repro-
cessing steps before reselling the items, many busi-
nesses opt to send returned items to landfills. In 2021
a
https://orcid.org/0009-0008-1935-821X
b
https://orcid.org/0009-0002-6825-8342
c
https://orcid.org/0009-0002-3599-4140
d
https://orcid.org/0009-0004-0688-510X
e
https://orcid.org/0000-0002-2445-1098
f
https://orcid.org/0000-0003-2115-6955
in Germany, approximately 17 million returned items
were disposed, while other European countries ex-
hibit even higher disposal rates (Forschungsgruppe
Retourenmanagement, 2022). Another issue with re-
turns is posed by the large amount of parcel shippings,
where each returned package generates an average
of 1.5 kg of CO
2
equivalents (Forschungsgruppe Re-
tourenmanagement, 2022), contributing to the fashion
sector being among the top three of most polluting in-
dustries. Minimising returns overall has the largest
impact in reducing environmental harm and financial
strain. Strategies can be twofold - either pursuing
preventive strategies with the main goal of avoiding
returns in the first place, or reactive strategies aim-
ing at improving the handling of returns in terms of
sustainability, time and cost (Deges, 2021). In either
case, it is important to understand the drivers of re-
turns. The reasons for consumers to return items are
diverse and may include, but not be limited to the fol-
lowing reasons: Unmet expectations with regards to
look or quality, personal preferences, dissatisfaction
with the fit, the wrong size, too much time passed be-
tween order and delivery, receiving the incorrect item,
ordering for someone else. Therefore, it can be advan-
tageous for retailerst to know when which items will
likely be returned. The return reason can also be an
Niederlaender, M., Liebau, U., Chen, Y., Breustedt, E., Driouech, S. and Werth, D.
Strategic Returns Prevention in E-Commerce: Simulating Financial and Environmental Outcomes Through Agent-Based Modeling.
DOI: 10.5220/0013180600003890
In Proceedings of the 17th International Conference on Agents and Artificial Intelligence (ICAART 2025) - Volume 1, pages 453-462
ISBN: 978-989-758-737-5; ISSN: 2184-433X
Copyright © 2025 by Paper published under CC license (CC BY-NC-ND 4.0)
453

important indicator of the item’s condition upon re-
turn. A large quantity of fashion returns are related
to size or selection of items. The latter case is given
when customers order multiple versions of the same
item or multiple items from the same category (like
multiple dresses) with the intention of buying only
one or a few of them. This very common behavior in
the fashion sector is referred to as bracketing (Bim-
schleger et al., 2019).
This study focuses on an Agent based simulation
of preventive strategies based on the targeting of se-
lection orders by utilising awareness-raising methods
in order to have customers make alterations to their
shopping card in favor of the environment. This re-
search is part of a larger scope of research that aims at
developing an AI-based recommendation system for
the prediction of returns and improved return manage-
ment. This part of the research aims at presenting a
blueprint for estimating the possible financial and en-
vironmental impact that can be achieved using the re-
turn predictions and their associated return reasons to
target specific return driving behavior before an order
has been placed. The first section references related
work in the context of this study. The subsequent sec-
tion describes the methods used for the setup of the
Agent based approach and the methods used to infer
the environmental impact from the outputs. Third, we
analyse the outcomes of the simulation in general as
well as from an environmental perspective based on
material consumption.
2 RELATED WORK
This section presents a selection of work related to the
topics of this study, including sustainability research
in the fashion industry, development of size finding
tools and returns prediction models, as well as Agent
based approaches to customer behavior simulation in
an online shop setting. Yang et al. (2017) show a
comprehensive overview of the sustainability efforts
and shortcomings in the fashion industry, touching on
different topics ranging from the selection of sustain-
able materials to the effects of free returns and the
lack of credibility of sustainability claims made by
fashion companies. In the context of size recommen-
dation, Eshel et al. (2021) propose a deep learning
framework based on transformers for the size predic-
tion across different clothing segments (Mens, Wom-
ens, Kids, Unisex clothing) and categories (Tops, Bot-
toms, Dress/Skirt, Footware). In addition, utilising
the size predicting features for enhancing eBay’s sim-
ilar items recommendation service. Nestler et al.
(2021) propose SizeFlags, a probabilistic Bayesian
model based on weakly annotated large-scale data
from customers for prediction of the most suitable
size. In this study, the subjectivity of size percep-
tion is emphasised, stating that the ’true’ size of a cus-
tomer often remains unknown and can vary greatly by
external factors including changes in physique over
time and the mindset around what fits best.
When it comes to prediction of customer behavior,
Hummel et al. (2011) present an Agent based simula-
tion in order to predict customer behavior in an online
shop setting when the preferred payment method is
not available, taking into account gender specific pref-
erences of payment methods from real-world data.
Another recent study compares five different classical
Machine Learning Algorithms for the predictions of
returns, highlighting the importance of features rep-
resenting bracketing behavior and ordering habits of
customers (Niederlaender et al., 2024). Agent-based
modeling can be used to simulate how targeting spe-
cific order behaviors, like size-related and selection-
related returns, can influence shopping cart composi-
tion and ultimately impact broader factors such as ma-
terial consumption, costs, and profits. This bottom-up
approach allows for a detailed analysis of individual
customer behavior and the effectiveness of prevention
strategies. By incorporating real-world data and sim-
ulating customer interactions with size finding tools
and targeted messages, this model can capture the het-
erogeneity of customer behavior and assess the sus-
tainability implications of different strategies.
3 METHODS
This section presents the methods utilised for the esti-
mation of achievable financial and environmental im-
pact when employing strategies for the avoidance of
returns and is composed of two steps. First, the data
input, setup and output of the Agent-based simulation
are described in subsection 3.1. Based on the out-
put generated, financial aspects are analysed. An en-
vironmental analysis is conducted in the second step
and the methodology for the determination of relevant
parameters based on the output are described in sub-
section 3.2.
3.1 Simulation Setup
This simulation showcases three different return
prevention strategies pertaining to selection orders,
where a customer ordered multiples of the same cloth-
ing item in several sizes or a customer ordered mul-
tiple items from the same clothing category (for ex-
ample dresses, pants, jackets). The latter case may
ICAART 2025 - 17th International Conference on Agents and Artificial Intelligence
454

Figure 1: Flowchart representing the decision making process for each agent based on the initial shopping cart. Each of the
four approaches (Initial, Normal, Targeted, Incentive) is simulated separately with the ground truth shopping cart data as a
starting point.
not always indicate bracketing behavior, however, the
dataset is a deciding factor.
The Input Data. This simulation is based on real-
world sales and returns data of a German manufac-
turer of festive dresses and garments for special oc-
casions. Therefore, the assumption that the major-
ity of customers only intend to keep one festive gar-
ment from a category, one festive dress for example,
is considered reasonable. The overall return rate of
the shop is 72%, which may be caused by the specifi-
cation on special occasions. The tabular data contains
orders in the time span from March 1st 2023 to Febru-
ary 29 2024, where each order can be identified by a
unique order ID. Further columns include the size of
the items, a unique article ID, clothing category, the
color, fit and style of the garment, but also the mate-
rial composition in percent and the weight of the top
layer fabric per square meter in grams. The latter two
columns formed the basis for the calculations of mate-
rial consumption, which in turn have been used in the
environmental analysis. For items where the weight
of the top layer fabric was not given a value, the av-
erage weight over all top layer fabrics was assigned.
To estimate material consumption, for each cloth-
ing category the average square meters of total fab-
ric needed, including multiple layers were estimated
to be: Cocktail dress 3.0 m
2
; Stola 1.0 m
2
; Evening
gown 4.5m
2
; Day dress 2.75m
2
; Dress 3.0m
2
; Jump-
suit 3.5 m
2
; Bolero 1.25m
2
; Skirt (midi) 2.0 m
2
; Top
1.25m
2
; Blouse 2.0 m
2
; Corset 1.25 m
2
; Skirt (long)
3.0m
2
; Pants 2.0 m
2
; Jacket 2.25 m
2
; Skirt (short)
1.25m
2
.
The weight of the fabric per square meter of fabric
was approximated to match the given weight of the
top layer fabric provided in the data. Due to the large
amount of orders giving rise to averaging effects, the
over- and underestimation of heavier or lighter gar-
ments were considered to be negligible. From the
total weight estimation of the garment, subsequently
the total amount of fabric components in the garments
were estimated using the given material composition.
Materials used as fabric components are given in Ta-
ble 1.
Input Parameters. For each order in the real world
data, an agent was created to act as an entity which al-
ters the contents of the shopping basket as a result of
the returns prevention strategies in place. Depending
on the simulations scenarios, which are explained in
the next paragraph, different input parameters drive
the agents proneness to act a certain way. For the
commonly known scenario where a size finding tool
is in place but no active measures are taken, the
Sizefinder Adoption Rate S
normal
determines the prob-
ability with which a customer agent uses the size find-
ing tool in a situation where they would place a size
selection order instead in the ground truth shopping
cart. For each agent, S
normal
was drawn from a nor-
mal distribution with mean 0.2 and a standard devia-
tion of 0.05, which makes some customer agents more
prone to use the tool than others. The mean value and
standard deviation for the Sizefinder Adoption Rate
were determined by interviewing online fashion re-
tailers which have their own size finding tool in place
in their online shop. Based on this, an exemplary as-
sessment of a person’s Sensitivity to react to a targeted
Popup due to the contents of their shopping basket in-
dicating size or category selection orders was made.
An increased proneness to react compared to the sim-
ple presence of a size finding tool is considered real-
istic, since it raises the awareness of the customer re-
garding their own shopping behavior. Therefore, the
Targeted Popup Sensitivity S
target
for each agent was
Strategic Returns Prevention in E-Commerce: Simulating Financial and Environmental Outcomes Through Agent-Based Modeling
455

drawn from a normal distribution with mean 0.4 and a
standard deviation of 0.1. Similarly, a person’s sensi-
tivity to react to a version of the targeted popup which
is not solely based on raising awareness but also on an
incentive to act on the recommendations is considered
to be even higher. Incentives might include offering
free shipping or free returns in the case of ordering
only what the size finding tool recommends. Thus,
the Incentive Sensitivity S
incentive
for each agent was
drawn from a normal distribution with mean 0.6 and
a standard deviation of 0.1. The size finding tool was
set to correctly suggest the best size for the customer
in 80% of cases, so the accuracy a of the tool was set
to be a = 0.8. To track the total costs present in the
context of the shipping and return management, the
cost for shipping a parcel (either as return or as ship-
ping) were set to be EUR 5, where in the context of
this simulation, the return cost is borne by the retailer,
the outward shipping cost is borne by the customer.
The costs for reprocessing an incoming return parcel
were estimated to be EUR 10 on average, which is
determined by the interviews conducted with online
fashion retailers.
Simulation Scenarios. First, in order for the simu-
lation results to generalise better, for each order three
agents were created, which creates potentially differ-
ent outcomes for each unique order. The observed
scenarios are illustrated as a flow chart in Figure 1.
Second, three separate strategies are simulated in-
dependently from each other and compared to the
ground truth order data, which is shown as the ’Do
Nothing’ or ’Initial’ state scenario. In the first strat-
egy, the ’Normal’ approach, the simulation is set up to
mimick the prevention of size related selection orders
due to the presence of a size finding tool on the web-
site. The possible positive impact on non-selection or-
ders due to better size estimation is not considered in
this study, meaning that non-selection orders remain
unaltered throughout the entire simulation. In the
’Normal’ scenario, customer agents may or may not
use the size finding tool depending on their personal
preference determined by S
normal
. Consequently, de-
pending on the correctness of the tool in each particu-
lar case, determined by the sizefinder accuracy a, the
customer agent may either keep one item in the cor-
rect size, or they may keep the item in the incorrect
size.
The second returns prevention strategy, referred
to as the ’Targeted’ approach, the customer agent is
made aware of the potential to use the size finder in
the case of a size related selection in their shopping
cart. In that case, they may or may not use the tool,
depending on their sensitivity to such an awareness-
raising strategy given by S
target
. If the customer in
turn has an order which can be classified as a selection
order based on ordering n ≥ 2 items from the same
clothing category, the customer agent is also made
aware of the potential returns caused and the effects
that coincide with it. Depending on the customers
sensitivity to the message S
target
, the customer agent
proceeds to remove up to n − 1 items of this clothing
category from the shopping cart. The third strategy
is the same as the second, with a key difference: The
agent is given an incentive to act according to the rec-
ommendations. The eagerness to react to the offer-
ing of an incentive like free returns or free shipping
for each agent is given by their incentive sensitivity
S
incentive
.
Outputs and Implementation. The simulation was
implemented completely using python with com-
monly used libraries like pandas and the Agent based
modeling library Mesa. After each simulation sce-
nario has been run, the potentially altered shopping
cart including returns and non-returns are saved, as
well as the total value of the cart and the value of the
returned items in the cart. The information if the cus-
tomer agent received any advantageous offer from the
Incentive case is also saved as an output. The total
amount of outward shippings and return shippings is
tracked along with the total return processing cost.
3.2 Environmental Analysis
This chapter discusses the methodology used in this
study to analyse the environmental impacts under dif-
ferent scenarios. Sustainability assessments are in-
complete without consideration of environmental, one
of the 3 pillars of sustainable development (European-
Commission, 2024).The goal of this sustainability as-
sessment is to explore how variations in material con-
sumption across different scenarios impact the envi-
ronment.
3.2.1 Methodology Selection
Life Cycle Assessment (LCA), a method commonly
used in the literature to quantify the potential envi-
ronmental impacts of a product system, was adopted.
LCA involves four phases: Goal and Scope, Life Cy-
cle Inventory (LCI), Life Cycle Impact Assessment
(LCIA), and Interpretation. Since this study does not
involve a complete LCA, it focuses solely on the po-
tential environmental impacts of materials under dif-
ferent scenarios. Therefore, this study concentrates
on two key phases of LCA: LCI and LCIA ISO 14040,
ISO 14044).
ICAART 2025 - 17th International Conference on Agents and Artificial Intelligence
456

As part of the LCI phase, environmental data
related to raw materials is extracted from the LCI
database, focusing on the environmental impact of
fabrics during its production. In addition to categoris-
ing these data, the LCIA method is used to classify the
impacts of different materials under various scenarios
into specific impact categories. This categorization
allows for a better understanding of the environmen-
tal impacts of each material under different scenarios.
(ISO 14040, 2006)(ISO 14044, 2006)
3.2.2 LCI Database and LCIA Method
In LCA studies related to raw materials, there are vari-
ations in the selection of LCI databases across the lit-
erature. Table 1 presents different LCI databases and
LCIA methods used in different studies that have con-
ducted LCAs on the same type of fabrics as this study.
From Table 1, it is evident that the majority of rel-
evant literature has selected the ecoinvent database, as
their LCI database. Therefore, this study also chooses
to use the ecoinvent database as the data source for
analyzing the environmental impacts of different fab-
rics.
In contrast to the selection of LCI databases, there
is a significant variation in the choice of LCIA meth-
ods among previous studies. These differences arise
from variations in research locations and objectives.
For example, IPCC primarily provides results for the
Global Warming Potential (GWP) category (IPCC,
2022), while USEtox focuses on toxicity research in
the United States and includes only categories re-
lated to toxicity (USEtox, 2024). Many articles have
utilised the CML method, however, CML has not
been updated since 2017 (Leiden-University, 2016).
Given these uncertainties, this study has chosen to
adopt the ReCiPe 2016 method, as it includes 18 mid-
point categories and is continuously updated (ReCiPe,
2016).
3.2.3 Analysis of Environmental Impacts
As shown in Table 1, the variations in LCIA meth-
ods have also led to differences in the selection of
impact categories by different authors. The ReCiPe
2016 method selected for this study encompasses var-
ious environmental impact pathways (ReCiPe, 2016).
However, the environmental impacts of different fab-
ric can vary significantly (Velden et al., 2014)(Parvez
et al., 2018)(Wu, 2020)(Shena et al., 2010)(Guo et al.,
2021)(Manteco, 2022)(Shuang et al., 2023)(Fangli
et al., 2021)(Gomez-Campos et al., 2020)(Marek
et al., 2023). To better demonstrate how changes
in the ordering process can impact the environment
from the perspective of fabric production and the 6
most relevant categories to the textile industry were
selected for further focus. Carbon footprint (CC),
Terrestrial Ecotoxicity (TEtox), and Human Toxicity
(HT, both cancer and non-cancer) were selected be-
cause they are the Top 3 most frequently examined
categories in other studies, as shown in Table 1. Ad-
ditionally, Freshwater Ecotoxicity (FEtox) and Fossil
Fuel Depletion were included. First, FEtox is consis-
tently highlighted in EU article as one of the three ma-
jor environmental issues in textile production, due to
the large volumes of water pollution generated during
the process (European-Parliament, 2024). Second,
excessive fossil fuel consumption in fabric produc-
tion contributes significantly to environmental degra-
dation (Zaman et al., 2023). Reducing fossil fuel use
has been identified as an important factor in mak-
ing textile production more sustainable (Zaman et al.,
2023).
This study will analyze how different scenarios
of fabric usage affect six environmental impact cat-
egories. By identifying the fabric with the greatest
environmental impact, this research will support sus-
tainable decision-making.
Normen Clature Environmental Analysis. The
Parameters for interpretation of environmental im-
pacts are described by the following Normen Cla-
ture: AD: Abiotic depletion; AP: Acidification po-
tential; AWARE: Available water remaining; CLCD:
Chinese life cycle database; CC: Climate change; ET:
Eutrophication; ETO: Ecotoxicity; EDIP: Environ-
mental design of industrial products; FD: Fine dust;
FPM: Fine particulate matter formation; FE: Fresh-
water eutrophication; FEtox: Freshwater ecotoxicity;
GWP: Global warming potential; HT: Human toxi-
city; HTc: Human toxicity, cancer; HTnc: Human
toxicity, non-cancer; IPCC: International panel on cli-
mate change; IR: Ionising radiation; LU: Land use;
ME: Marine eutrophication; MEtox: Marine ecotox-
icity, RD: Mineral, fossil and renewable resource de-
pletion; OD: Ozone depletion; OF: Ozone formation;
OFh: Ozone formation, Human health; PM: Partic-
ulate matter; POF: Photochemical ozone formation;
POxF: Photochemical oxidant formation; PED: Pri-
mary energy demand; SOD: Stratospheric ozone de-
pletion; TA: Terrestrial acidification; TE: Terrestrial
ecosystems; TEtox: Terrestrial ecotoxicity; WU: Re-
source depletion-water; USEtox: United nation envi-
ronment program and society of environmental toxi-
cology chemistry; WC: Water consumption
Strategic Returns Prevention in E-Commerce: Simulating Financial and Environmental Outcomes Through Agent-Based Modeling
457

Table 1: Summary of LCI databases and LCIA methods used with impact categories from various literature sources.
Material type LCI database LCIA method Impact categories References
Nylon Ecoinvent
IPCC, USEtox, ReCiPe,
IMPACT 2002+, CML,
Ecopoints 97, Eco-
indicator 99, Green-
house gas protocol
GWP, ETO, AP, ET,
POxF, FD, TE, FE, SOD,
IR, OFh, FPM, OF, TA,
MEtox, HTc, HTnc, LU,
WC
(Velden et al.,
2014)(Parvez et al.,
2018)
Polyester
Gabi,
Ecoinvent
EDIP, IPCC, USE-
tox, ReCiPe, IMPACT
2002+, CML
GWP, WC, ETO, AP, ET,
POxF, FD, AD, OD, HT,
FEtox, Tetox
(Velden et al., 2014)
(Wu, 2020) (Shena et al.,
2010)
Elastane Ecoinvent
IPCC, USEtox,
ReCiPe,IMPACT 2002+
GWP, ETO, AP, ET,
POxF, FD, MEtox; WC
(Velden et al., 2014)
Viscos
CLCD,
Ecoinvent
CML, IPCC
AD, PED, WU, AP,
GWP, ET, CC, OD, HT,
FEtox, Tetox, POxF, AP
(Shena et al., 2010) (Guo
et al., 2021) (Manteco,
2022)
Cotton Ecoinvent
CML, IMPACT 2002+,
ReCiPe, EDIP, USEtox,
Eco indicator 99, foot-
print, Australian impact
method, Australian Indi-
cator Set V3, IPCC
CC, OD, TA, FE, FE-
tox, HT, WC, AD, Tetox,
POxF, AP, ET
(Shena et al., 2010)
(Manteco, 2022)
(Shuang et al., 2023)
(Fangli et al., 2021)
Flax
Ecoinvent,
Agribalse
ILCD 2001+
CC, OZ, PM, IR, POF,
AP, FE, ME, RD
(Gomez-Campos et al.,
2020)
Metallic fab-
rics
Ecoinvent
IPCC, USEtox 2,
AWARE
GWP, HTc, HTnc, FE-
tox, WC
(Marek et al., 2023)
4 DISCUSSION OF RESULTS
4.1 Comparison of the Simulation
Outcomes
The relative changes in the simulation outcomes com-
pared to the initial ground truth case are summarised
in Table 2. The absolute values are compared in Fig-
ure 2. It becomes clear that the difference between the
targeted approach and the normal approach is not very
pronounced. The normal approach often saves more
resources than the targeted approach, despite the lat-
ter’s broader scope. While the targeted approach re-
duces total returns, it also decreases the number of
items kept. The incentive approach, while effective
in reducing returns, might impact sales. Additional
costs associated with incentives should be considered.
While the overall reduction in material consumption
is similar across cases, it’s not directly proportional to
the reduction in returns. This is due to varying prod-
uct compositions and return reasons. Further research
is needed to optimize pop-up timing and placement,
as well as address complex cases involving multiple
high-risk items. Due to the high individuality of the
carts as well as the unknown sensitivity of customers
to small changes in size und unknown personal prefer-
ences, the decision process of customers remain pre-
Table 2: Relative changes of the different scenarios (N =
Normal, T = Targeted, I = Incentive) compared to the initial
scenario.
Outcome
N
[%]
T
[%]
I
[%]
Total Returns -0.67 -0.69 -9.14
Total Non Returns -1.93 -1.84 -10.4
Return Shippings -0.20 -0.17 -1.90
Outward Shippings -0.24 -0.23 -0.72
Sum Price Returns -0.67 -0.71 -9.46
Sum Price Non Returns -2.01 -1.97 -11.1
Return Shipping Costs -0.20 -0.17 -1.90
Total Outward Shipping
Costs
-0.24 -0.23 -0.72
Return Processing Costs -0.67 -0.69 -9.14
Nylon -0.79 -1.59 -5.90
Polyester -1.12 -1.06 -9.68
Metallic Fabric -0.93 -0.95 -6.16
Elastane -1.23 -1.16 -8.75
Viscose -0.83 -1.37 -4.41
Cotton -1.18 -1.49 -11.3
Flax -0.92 0.00 -1.84
dominantly difficult to comprehend. Online retailers
are therefore encouraged to explore their customers
sensitivities S
normal
, S
target
and S
incentive
in the con-
text of their own online shop. Further, the sensitivi-
ties S
target
and S
incentive
may vary depending on the re-
turn category, for example making customers on aver-
ICAART 2025 - 17th International Conference on Agents and Artificial Intelligence
458
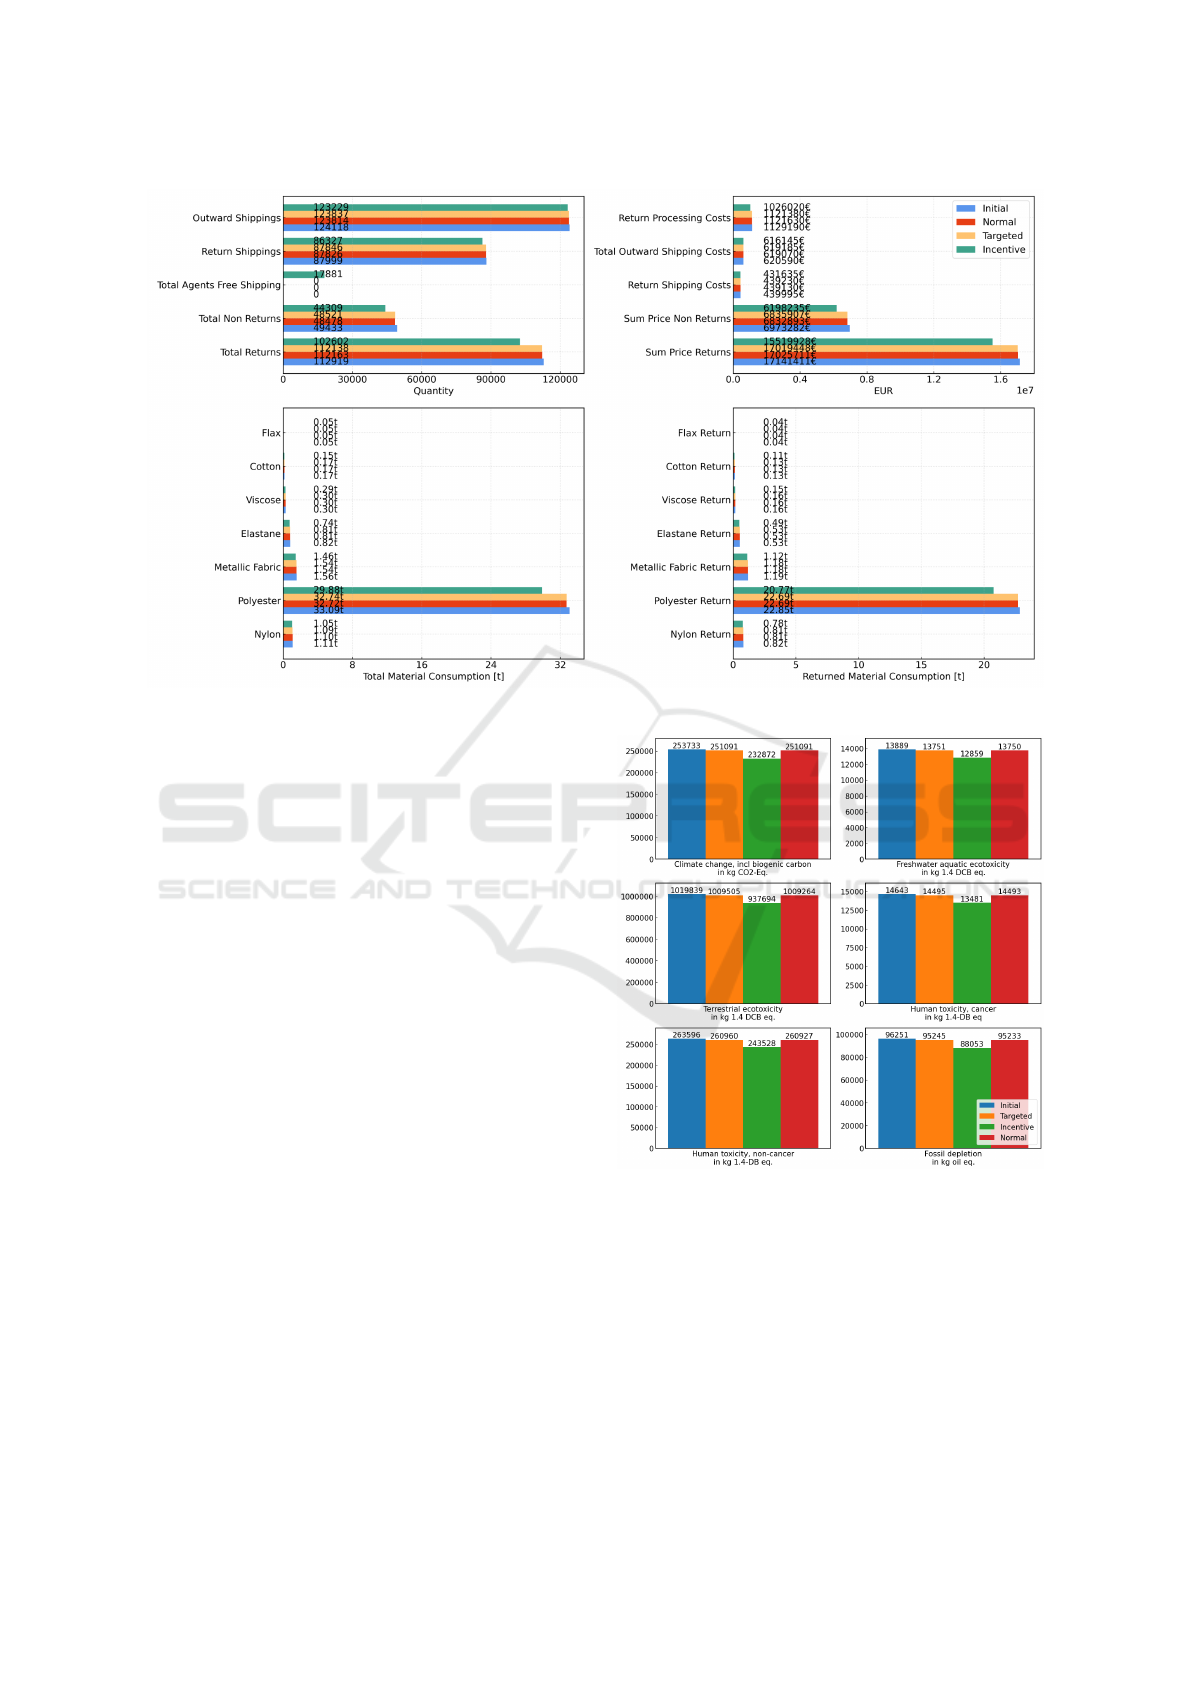
Figure 2: Comparison of simulation outcomes for the four scenarios, where Initial represents the ground truth data.
age more susceptible to removing size selection items
than removing category selection items. This differ-
entiation needs further investigation.
4.2 Impact of Outcomes on Relevant
Environmental Parameters
A key objective of this research is to provide an as-
sessment and classification of potential environmen-
tal impacts that may arise due to changes in the or-
dering process. For this reason, the results from the
various scenarios in Figure 4 were analysed for their
environmental impacts using the environmental anal-
ysis method described (see subsection 3.2). As out-
lined in the methodology, the focus was placed on
the following six impact categories: Climate Change
(CC), Freshwater Aquatic Ecotoxicity (FAE), Ter-
restrial Ecotoxicity (TE), Human Toxicity, cancer
(HTC), Human Toxicity, non-cancer (HTNC), Fos-
sil Depletion (FT). The results are presented in two
main sections. An overview of the absolute values in
the scenarios is described. Then the relative share of
the individual materials for the respective impact cat-
egory is discussed in more detail and it is described
whether there are changes in the scenarios compared
to the “Initial” scenario.
4.2.1 Absolute Summed Impacts per Scenario
Figure 3 illustrates the impact of the different cloth-
ing sales scenarios (Initial, Targeted, Incentive, and
Figure 3: Absolute values of different impact metrics for
different ordering scenarios.
Normal) on the six environmental metrics. The units
are not the same for all metrics. Care should therefore
be taken when comparing values across metrics. The
chart highlights the significant impact that different
sales strategies can have on the environment. Out-
comes for other metrics are shown in the Appendix.
The ”Incentive” scenario consistently outperforms the
others across all six metrics, indicating that it is the
most sustainable option. The percentage decline in
Strategic Returns Prevention in E-Commerce: Simulating Financial and Environmental Outcomes Through Agent-Based Modeling
459
each metric is between 7 and 9 percent. The high-
est percentage decrease is in Fossil depletion with 8.6
percent and the lowest in Freshwater aquatic ecotox-
icity with 7.5 percent.The Target scenario also low-
ers the impact compared to Normal and Initial. The
highest decrease compared to the Initial Scenario is
in Fossil depletion with 1.2 percent and the lowest
Freshwater aquatic ecotoxicity with one percent. The
CO2 equivalent can be considered in more detail as
an example. The difference between the initial sce-
nario with 253 tons and the incentive scenario with
232 tons corresponds to savings of 21 tons. By way
of comparison, a return flight of 3000 miles (e.g. from
Boston to London and back) emits around one ton of
CO2 per passenger(United States Environmental Pro-
tection Agency, 2018). Freshwater aquatic ecotoxic-
ity has about a ton of difference between Initial with
13t and Incentive with 12t 1.4 DCB equivalent. The
target of a maximum pollutant concentration of 75 mi-
crograms of p-DCB per liter of drinking water set by
the United States Environmental Protection Agency
(2009) (EPA) can be used for reference. Both exam-
ples were used to better illustrate the quantities given.
Overall, it can be seen that, compared to the initial
scenario, only the incentive scenario has a clear influ-
ence and would have an impact reduction of around
8 percent in most impact categories. Target and Nor-
mal also show a reduction in the impact categories,
but this is significantly smaller.
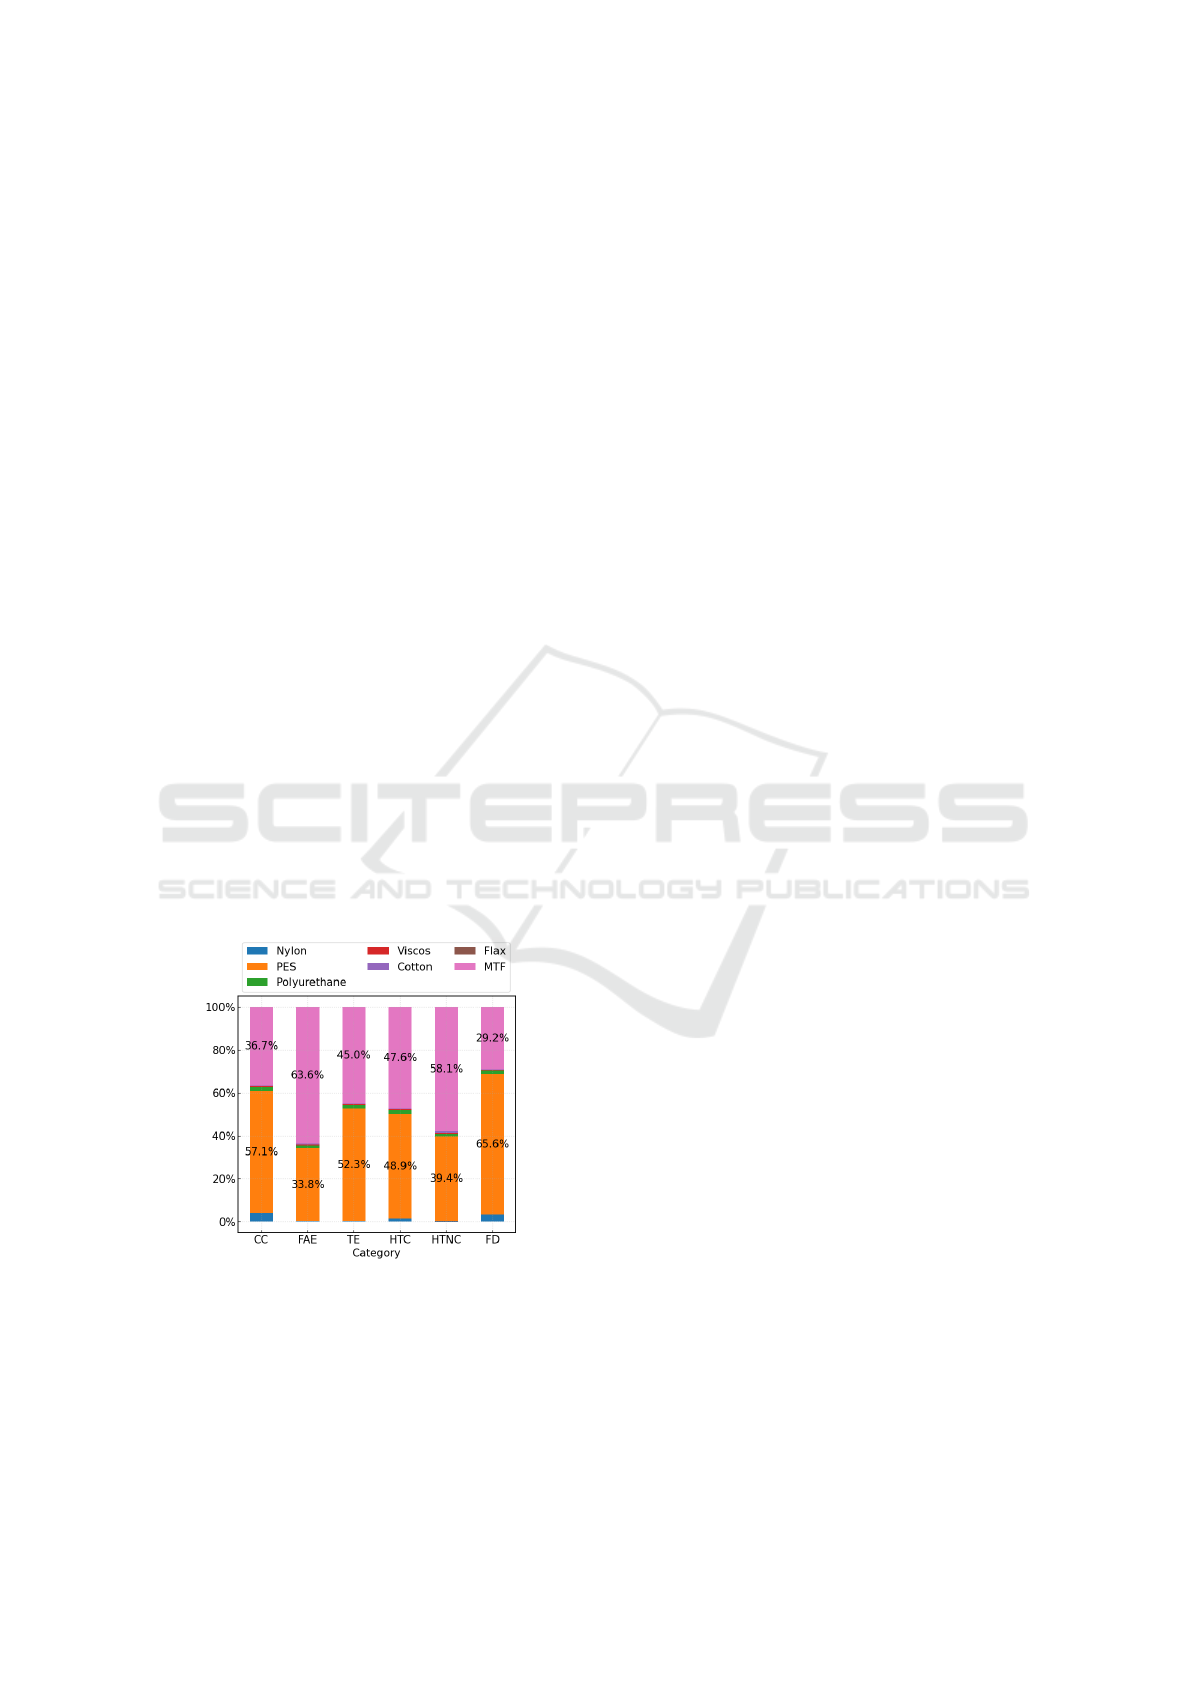
4.2.2 Relative Proportion of Individual
Materials per Impact Category
Figure 4: Percentage share of the analysed fabrics of the
total impact in the various metrics.
Figure 4 illustrates the relative impact of different fab-
ric materials on the same six environmental metrics as
in Figure 3. The values are totaled over the 4 scenar-
ios. The material composition of the clothes signifi-
cantly influences the environmental footprint. The use
of PES (Polyester) and MFT (Metallic Fiber) consis-
tently contributes to a higher impact across all met-
rics compared to other fabrics, despite the fact that
the total consumption of MFT is just a small share
of the total material consumption. PES with percent-
ages between 65 and 33 and MTF between 63 and
29 percent. Nylon and Polyurethane generally exhibit
lower environmental impacts. Viscos, Cotton and
Flax demonstrate the lowest impacts relatively. This
analysis highlights the significance of fabric compo-
sition in sustainable clothing consumption. While in-
terventions in the ordering process can have a pos-
itive impact, substantial improvements require more
significant changes. Focusing on PES and MFT com-
ponents offers the greatest potential for reducing en-
vironmental impact.
5 CONCLUSION AND OUTLOOK
This work proposed an Agent-Based approach for
the estimation of financial and environmental out-
comes when implementing return prevention strate-
gies in fashion e-commerce. Alternative order out-
comes when targeting customers based on size or cat-
egory related selection orders and intervening with
targeted popups or incentives were explored and com-
pared to ground truth order data from a German online
retailer, as well as the scenario of a size finding tool
in place but not raising awareness about its presence.
Depending on customers unique sensitivity to these
strategies, returns can be prevented by reducing selec-
tion orders, having a positive financial impact through
saved return shipping and processing cost, but also
preventing some amount of orders that would have
not been returned in the initial scenario. However, this
aspect needs further investigation taking into account
the possibility of follow-up orders after returning the
first time. One key objective of this work is to classify
the sustainability effects that could arise as a result
of changes in the ordering process. For this reason,
the sustainability effects of the results from the var-
ious scenarios from Figure 4. were examined using
the sustainability analysis method described in sub-
section 3.2. In a first step, the impact of the outcome
from the initial scenario was determined. In a sec-
ond step, the initial scenario was compared with the
changed outcomes of the different scenarios, which
were also evaluated with regard to their sustainabil-
ity effects. In a third step, these sustainability assess-
ments are used to compare the various impacts of the
scenarios. Future work is suggested to investigate the
impact of targeting other return types besides selec-
tion order induced returns, while taking varying sen-
ICAART 2025 - 17th International Conference on Agents and Artificial Intelligence
460

sitivities dependent on the return type into account.
The potential for cart abandonment should be consid-
ered. Real-world customer responses to these strate-
gies must be studied. Online retailers are encouraged
to analyze their own sales and return data to estimate
the potential impact on financial and environmental
sustainability. Expanding these strategies to other e-
commerce types could offer new insights. AI and ML
can help predict returns and inform decision-making
for efficient and sustainable return processing. A re-
turn prediction system could identify high-risk orders
and items, enabling targeted interventions to prevent
returns. By analyzing customer return history, per-
sonalized recommendations can be made to reduce re-
turns without discouraging legitimate ones.
ACKNOWLEDGEMENTS
This research was funded in part by the Ger-
man Federal Ministry of Education and Research
(BMBF) under the project OptiRetouren (grant num-
ber 01IS22046B). It is a joint project of the August-
Wilhelm Scheer Institut, INTEX, HAIX and h+p.
August-Wilhelm Scheer Institut is mainly entrusted
with conducting research in AI for forecasting returns
volume and for recommendations based on AI.
REFERENCES
Bimschleger, C., Patel, K., and Leddy, M. (2019). Bringing
it back: Retailers need a synchronized reverse logis-
tics strategy. Technical report, Deloitte Development
LLC.
Deges, F. (2021). Retourencontrolling im online-handel.
Controlling – Zeitschrift f
¨
ur erfolgsorientierte Un-
ternehmenssteuerung, 2/2021:61–68.
Eshel, Y., Levi, O., Roitman, H., and Nus, A. (2021). Pre-
size: predicting size in e-commerce using transform-
ers. In Proceedings of the 44th international ACM
SIGIR conference on research and development in in-
formation retrieval, pages 255–264.
European-Commission (2024). Sustainable development.
European-Parliament (2024). The impact of textile pro-
duction and waste on the environment (infographics).
Technical report.
Fangli, C., Pinghua, X., Xiang, J., Laili, W., and Jiang, C.
(2021). A review: life cycle assessment of cotton tex-
tiles. Special Issue on Circular Economy. Industria
textila, (72):1.
Forschungsgruppe Retourenmanagement (2022). Ergeb-
nisse des europ
¨
aischen retourentachos ver
¨
offentlicht.
https://www.retourenforschung.de/info-
ergebnisse-des-europaeischen-retourentachos-
veroeffentlicht.html. Online; accessed 2023-01-26.
Gomez-Campos, A., Vialle, C., Rouilly, A., Sablayrolles,
C., and Hamelin, L. (2020). Flax fiber for technical
textile: a life cycle inventory. Journal of Cleaner Pro-
duction.
Guo, S., Li, X., Zhao, R., and Gong, Y. (2021). Comparison
of life cycle assessment between lyocell fiber and vis-
cose fiber in china. The International Journal of Life
Cycle Assessment, 26:1545-1555.
Hummel, A., Kern, H., and D
¨
ohler, A. (2011). An agent-
based simulation of payment behavior in e-commerce.
In Multiagent System Technologies: 9th German Con-
ference, MATES 2011, Berlin, Germany, October 6-7,
2011. Proceedings 9, pages 41–52. Springer.
IPCC (2022). Climate change 2022, mitigation of climate
change. Technical report.
ISO 14040 (2006). Environmental management-life cycle
assessment-principles and framework. International
Organization for Standardization.
ISO 14044 (2006). Environmental management-Life cy-
cle assessment-Requirements and guidelines, volume
14044. International Organization for Standardiza-
tion.
Leiden-University (2016). Handbook on life cycle assess-
ment.
Manteco (2022). Life cycle assessment on mwool® by
manteco. Technical report, Manteco.
Marek, S., Marzena, W.-A., and Ganczewski, G. (2023).
Striving for a less toxic production of metallized tex-
tiles - environmental impact assessment. Journal of
Cleaner Production.
Nestler, A., Karessli, N., Hajjar, K., Weffer, R., and Shir-
vany, R. (2021). Sizeflags: reducing size and fit re-
lated returns in fashion e-commerce. In Proceedings
of the 27th ACM SIGKDD Conference on Knowledge
Discovery & Data Mining, pages 3432–3440.
Niederlaender, M., Lodi, A., Gry, S., Biswas, R., and
Werth, D. (2024). Garment returns prediction for ai-
based processing and waste reduction in e-commerce.
In Proceedings of the 16th International Conference
on Agents and Artificial Intelligence - Volume 2:
ICAART, pages 156–164. INSTICC, SciTePress.
Parvez, M. M. A., Huda, N., Farjana, S. H., and Candace,
L. (2018). Environmental profile evaluations of piezo-
electric polymers using life cycle assessment. IOP
Conference Series: Earth and Environmental Science.
ReCiPe (2016). Pr
´
e sustainability - method for the life cy-
cle impact assessment (lcia). https://pre-sustainability.
com/articles/recipe/. Accessed: 2024-10-15.
Shena, L., Worrell, E., and Patel, M. K. (2010). Environ-
mental impact assessment of man-made cellulose fi-
bres. Resources, Conservation and Recycling. 55:260-
274.
Shuang, C., Lisha, Z., Lirong, S., Huang, H. Q., Ying, Z.,
Li, L. X., Xiangyu, Y., Yi, L., and Laili, W. (2023).
A systematic review of the life cycle environmental
performance of cotton textile products. Science of the
Total Environment, 883.
Statista (2024). Fashion ecommerce report
2023. https://www.statista.com/topics/9288/
fashion-e-commerce-worldwide/#topicOverview.
Online; accessed 2024-09-30.
Strategic Returns Prevention in E-Commerce: Simulating Financial and Environmental Outcomes Through Agent-Based Modeling
461

United States Environmental Protection Agency (2009).
Drinking water contaminants: p-dichlorobenzene (p-
dcb). Accessed: 2024-10-15.
United States Environmental Protection Agency (2018).
Emission factors for greenhouse gas inventories. Ac-
cessed: 2024-10-15.
USEtox (2024). The usetox model — usetox®.
Velden, N. M., Patel, M. K., and Vogtl
¨
ander, J. G. (2014).
Lca benchmarking study on textiles made of cotton,
polyester, nylon, acryl, or elastane. . The International
Journal of Life Cycle Assessment, 19(2), 331–356.
Wu, Z. (2020). Haode evaluating the life-cycle environ-
mental impacts of polyester sports t-shirts. IOP Con-
ference Series: Earth and Environmental Science.
Yang, S., Song, Y., and Tong, S. (2017). Sustainable re-
tailing in the fashion industry: A systematic literature
review. Sustainability, 9(7):1266.
Zaman, S., Umair, M., and Javid, A. (2023). Sustainable
production practices in textiles.
APPENDIX
Table 3: Outcomes of Initial and Normal impact metrics for
different ordering scenarios.
Category Initial Normal Unit
Climate change
incl biogenic
carbon
253733.28 251091.32 kg CO2-
Eq.
Freshwater
aquatic ecotoxi-
city
13889.52 13750.29 kg 1.4
DCB eq.
Marine aquatic
ecotoxicity
18070.87 17889.51 kg 1.4
DCB eq.
Terrestrial eco-
toxicity
1019839.03 1009264.53 kg 1.4
DCB eq.
Freshwater Eu-
trophication
125.70 124.46 kg P eq.
Marine Eutroph-
ication
45.70 45.23 kg N eq.
Terrestrial Acid-
ification
695.41 688.14 kg SO2
eq.
Photochemical
Ozone Forma-
tion. Ecosys-
tems
565.56 559.55 kg NOx
eq.
Ionizing Radia-
tion
21460.72 21245.99 kBq Co-
60 eq.
Human toxicity
cancer
14643.98 14493.22 kg 1.4-
DB eq.
Human toxicity
non-cancer
263596.40 260927.14 kg 1.4-
DB eq.
Fine Particulate
Matter Forma-
tion
301.25 298.08 kg
PM2.5
eq.
Photochemical
Ozone Forma-
tion. Human
Health
518.20 512.70 kg NOx
eq.
Table 3: Outcomes of Initial and Normal impact metrics for
different ordering scenarios (cont.).
Category Initial Normal Unit
Stratospheric
Ozone Depletion
0.784 0.775 kg CFC-
11 eq.
Land use 4984.98 4932.55 Annual
crop eq.
Fossil depletion 96251.62 95233.25 kg oil
eq.
Metal depletion 2748.16 2720.18 kg Cu
eq.
Freshwater Con-
sumption
3667.45 3628.48 m3
Table 4: Outcomes of Targeted and Incentive impact met-
rics for different ordering scenarios.
Category Targeted Incentive Unit
Climate change
incl biogenic
carbon
251091.30 232872.84 kg CO2-
Eq.
Freshwater
aquatic ecotoxic-
ity
13751.61 12859.24 kg 1.4
DCB eq.
Marine aquatic
ecotoxicity
17891.43 16726.44 kg 1.4
DCB eq.
Terrestrial eco-
toxicity
1009505.05 937694.95 kg 1.4
DCB eq.
Freshwater Eu-
trophication
124.46 116.57 kg P eq.
Marine Eutrophi-
cation
45.20 42.06 kg N eq.
Terrestrial Acidi-
fication
688.10 637.73 kg SO2
eq.
Photochemical
Ozone Forma-
tion. Ecosystems
559.62 516.92 kg NOx
eq.
Ionizing Radia-
tion
21248.71 19875.78 kBq Co-
60 eq.
Human toxicity
cancer
14495.31 13481.50 kg 1.4-
DB eq.
Human toxicity
non-cancer
260960.88 243528.13 kg 1.4-
DB eq.
Fine Particulate
Matter Formation
298.10 275.83 kg
PM2.5
eq.
Photochemical
Ozone Forma-
tion. Human
Health
512.76 473.89 kg NOx
eq.
Stratospheric
Ozone Depletion
0.776 0.710 kg CFC-
11 eq.
Land use 4929.10 4564.97 Annual
crop eq.
Fossil depletion 95245.71 88053.60 kg oil
eq.
Metal depletion 2719.68 2536.61 kg Cu
eq.
Freshwater Con-
sumption
3625.23 3347.68 m3
ICAART 2025 - 17th International Conference on Agents and Artificial Intelligence
462
