
A Deep Learning Approach for Predicting the Response to Anti-VEGF
Treatment in Diabetic Macular Edema Patients Using Optical Coherence
Tomography Images
Karima Garraoui
1,5,∗ a
, Ines Rahmany
1,5 b
, Salah Dhahri
1,2
, Hedi Tabia
3
, Desir
´
e Sidib
´
e
3
,
Hsouna Zgolli
4
and Nawres Khlifa
5
1
Faculty of Sciences and Techniques of Sidi Bouzid, University of Kairouan, Tunisia
2
Electronics and Microelectronics Laboratory, Faculty of Sciences of Monastir, University of Monastir 5000, Tunisia
3
University of Paris-Saclay, Evry IBISC Evry, France
4
Department of Ophthalmology Institut Hedi Raies Tunis, Tunisia
5
Research Laboratory of Biophysics and Medical Technologies, Higher Institute of Medical Technologies of Tunis,
University of Tunis El Manar, 1006 Tunis, Tunisia
Keywords:
Prediction, Anti-VEGF, DME Patients, OCT Images, Deep Learning, Siamese Network, EfficientNetB2.
Abstract:
Diabetic macular edema (DME) is a serious complication of diabetes that can lead to vision loss, making
the prediction of patient response to anti-vascular endothelial growth factor (anti-VEGF) treatment crucial for
optimizing therapeutic strategies. This study introduces ESSDP (Extended Siam Saves Diabetes Patients), a
novel deep learning approach leveraging a Siamese network architecture with EfficientNetB2 to predict thera-
peutic response in DME patients through optical coherence tomography (OCT) image analysis. By classifying
patients into good or poor responder groups based on central macular thickness reduction after injection, the
proposed framework achieved a predictive performance with an accuracy of 0.80, sensitivity of 0.71, precision
of 0.89, and an F1-Score of 0.74. These findings highlight the potential of Siamese network-based deep learn-
ing architectures as effective tools for predicting treatment outcomes in DME patients, even when working
with limited datasets, and pave the way for enhancing personalized treatment strategies in ophthalmology.
1 INTRODUCTION
Diabetic macular edema (DME) is a common and se-
rious complication of diabetes, affecting patients cen-
tral vision. It is characterized by a thickening of the
central retina due to the accumulation of intraretinal
fluid (Bhagat et al., 2009). DME represents a major
cause of visual impairment in people with diabetes
(Yau et al., 2012).
The treatment of DME has evolved significantly
with the advent of anti-VEGF agents. These ther-
apeutic agents, such as ranibizumab and aflibercept,
specifically target VEGF, a protein involved in vascu-
lar permeability and pathological angiogenesis (Fer-
rara et al., 2004). The treatment of DME has evolved
significantly with the advent of anti-VEGF (vascular
endothelial growth factor) agents. These therapeutic
a
https://orcid.org/0009-0006-4435-5884
b
https://orcid.org/0000-0001-9086-5080
∗
Corresponding author
agents, such as ranibizumab and aflibercept, specif-
ically target VEGF, a protein involved in vascular
permeability and pathological angiogenesis (Brown
et al., 2013).
1
Optical coherence tomography (OCT) plays a cru-
cial role in the diagnosis and monitoring of DME.
This non-invasive imaging technique provides cross-
sectional images of the retina with micrometric reso-
lution (Zhang et al., 2022). OCT allows quantification
of retinal thickness, visualization of edema morphol-
ogy, and evaluation of treatment response (Browning
et al., 2007).
Recently, artificial intelligence (AI), and more
specifically deep learning (DL) and convolutional
neural networks (CNN), have emerged as promising
1
Work carried out in the OCTIPA project (CMCU
23G1418), as part of the PHC-Utique program managed by
the CMCU of the French Ministry of Europe and Foreign
Affairs and the Tunisian Ministrtfcy of Higher Education
and Scientific Research
Garraoui, K., Rahmany, I., Dhahri, S., Tabia, H., Sidibé, D., Zgolli, H. and Khlifa, N.
A Deep Learning Approach for Predicting the Response to Anti-VEGF Treatment in Diabetic Macular Edema Patients Using Optical Coherence Tomography Images.
DOI: 10.5220/0013181700003890
Paper published under CC license (CC BY-NC-ND 4.0)
In Proceedings of the 17th International Conference on Agents and Artificial Intelligence (ICAART 2025) - Volume 2, pages 453-462
ISBN: 978-989-758-737-5; ISSN: 2184-433X
Proceedings Copyright © 2025 by SCITEPRESS – Science and Technology Publications, Lda.
453

tools in the analysis of OCT images. These tech-
nologies allow for automated interpretation of im-
ages, early detection of abnormalities, and prediction
of disease progression (Ting et al., 2019). CNNs, in
particular, have shown great efficiency in the classifi-
cation of medical images, including those from OCT
(Kermany et al., 2018).
The classification of medical imaging, especially
OCT images in the context of DME, is a rapidly ex-
panding field. AI algorithms can now classify images
according to various criteria, such as the presence or
absence of edema, the type of edema, or the sever-
ity of the disease (Schlegl et al., 2018). This auto-
mated classification offers considerable potential for
improving diagnostic efficiency and therapeutic man-
agement of patients with DME (Fauw et al., 2018).
In this study, we propose an approach based on a
Siamese network using the EfficientNetB2 architec-
ture to predict the response to anti-VEGF treatment
in patients with diabetic macular edema (DME) from
OCT images. The Siamese network, initially intro-
duced by (Ding and Zhu, 2022), is a neural archi-
tecture particularly suited to comparison or similarity
tasks. It consists of two identical subnetworks shar-
ing the same weights, each processing a different in-
put image. These subnetworks, in our case based on
EfficientNetB2, extract relevant features from OCT
images. The uniqueness of the Siamese network lies
in its ability to learn a representation of images that
brings together the characteristics of patients with
similar treatment responses, while distancing those
of patients with different responses. This approach
is particularly effective for limited-size datasets, as is
often the case in medical imaging.
Our approach presents a significant innovation in
the field of prediction of Anti-VEGF treatment re-
sponse in DME patients using deep learning on OCT
Images. To our knowledge, this specific method has
not been applied to this particular research topic be-
fore. This originality provides several notable advan-
tages to our work:
• Our study opens new research avenues in the
fields of ophthalmology and machine learning ap-
plied to medicine by proposing an innovative ap-
proach based on the Siamese network to a critical
clinical problem.
• Our paper goal in this regard is to use both opti-
cal coherence tomography and deep learning pic-
tures to anticipate how individuals with diabetes
macular edema will respond to opposed to VEGF
medication.
• Experimental verification with public OCT and
private datasets, shows that this method can ef-
fectively predict anti-VEGF treatment response in
DME High Impact Potential: As the first applica-
tion of this method to predicting anti-VEGF treat-
ment response in DME, our work has the potential
to significantly influence future research and clin-
ical practices in this area.
This document is organized as follows: Section 2
presents a state of the art of existing methods for pre-
dicting response to anti-VEGF treatment. Section 3
details our methodological approach, including the
Siamese network architecture, the feature extraction
process, and the learning strategy. Section 4 describes
the experiments carried out, including the description
of the databases used, the evaluation protocols, and
the results obtained. Finally, Section 5 concludes the
study, discusses the clinical implications of our re-
sults, and presents future perspectives for improving
and applying this approach.
2 RELATED WORK
This research project aims to implement a predictive
model exploiting deep learning techniques to assess
reaction to patients having DME to anti-VEGF treat-
ment. Based on established references in medical
imaging, particularly within the field related to op-
tical coherence tomography (OCT), the goal is to de-
sign a model capable of predicting the efficiency of
treatment from OCT images.
Considering earlier research like those carried out
and reported by (Cao et al., 2021), (Jin et al., 2024)
(Ko et al., 2022). The process entails the creation of
an advanced learning (DL) model for segmenting im-
ages and response categorization by the use of infor-
mation from patients who have not yet received ther-
apy retinopathy caused by diabetes along with elec-
tronic medical records (EMR).
These studies document different patient informa-
tion, encompassing age, sexuality, and sharp vision,
OCT evaluations, as well as further eye disorders.
We start by looking at prior efforts about the ap-
plication of deep learning to anticipate the reaction to
the medical intervention.
In their work, (Meng et al., 2024), intended to as-
sess a prediction model based on BPNN (Back Prop-
agation Neural Network) over OCT-omics to evaluate
the anti-VEGF therapy’s effectiveness in those who
have DME, or diabetic macular edema. A review con-
ducted on 113 eyes in the past was carried out on 82
patients. The classifiers used were logistic regression
and Support Vector Machine. These were applied to
a dataset of 34 eyes from a total of 79 eyes. The
findings indicated that the classifiers demonstrated
superior discriminating powers during the validation
ICAART 2025 - 17th International Conference on Agents and Artificial Intelligence
454

sets as well as during the test sets. Similarly, (Jin
et al., 2024) developed an algorithm that leverages
deep learning techniques to quantify the fluid within
and beneath the retina in optical coherence tomog-
raphy (OCT) images, aimed at assessing changes in
the condition of patients with diabetic macular edema
(DME). A deep learning network based on the U-Net
model was used for the segmentation and calculation
of intraretinal fluid (IRF) as well as the fluid con-
tent in the sub-retinal (SRF) region. A total of 2,955
OCT scans from DME patients with SRF, and IRF,
who received anti-VEGF therapy were analyzed. The
method demonstrated an area under the ROC curve of
0.993 for IRF and 0.998 for SRF. This deep learning
approach enabled the accurate determination of fluid
volumes for both IRF and SRF, with high sensitivity
and specificity, to assess the condition of patients with
DME.
Furthermore, (Liu et al., 2023) in their work,
aimed to evaluate the accuracy of images obtained
from optical imaging generated by generative an-
tagonist networks (GAN) in order predict response
anti-VEGF levels in individuals with diabetic mac-
ular edema (DME). Clinical and imaging data from
715 patients were used for training, and data from
103 patients were used for validation. Six different
GAN models were applied to generate OCT images,
aimed at estimating the effectiveness of anti-VEGF
therapy. The RegGAN model showed the best predic-
tive performance. The majority of the generated post-
processed OCT images, 95 out of 103, were difficult
for experts to differentiate from real OCT images. By
utilizing GAN models, physicians can better predict
how patients with diabetic macular edema may re-
spond to anti-VEGF treatment, leading to improved
management strategies.
Also, (Ko et al., 2022), in their work, aimed to
develop a time convolutional network (TCN) model
to predict changes in visual acuity (VA) one year af-
ter three monthly injections of anti-VEGF for macu-
lar edema caused by diabetes (DME), using images
from optical coherence tomography (OCT) taken at 1
month and 3 months of follow-up. OCT imaging data
from 317 DME patients treated with three anti-VEGF
injections were collected retrospectively, with pa-
tients classified as ”improved” (2-line enhanced VA)
or ”non-responders.” A trained beforehand ResNet50
model was applied to extract image characteristics,
then refined on the training set with data augmenta-
tion for the ”enhanced” group. Using concatenated
OCT images with ResNet50 alone achieved 69.04%
accuracy, 0.70.37% specificity, and 68.05% sensitiv-
ity. However, the application of TCN to extract tem-
poral characteristics of serial OCT images improved
predictive performance to 81.25% accuracy, 74.40%
specificity, and 92.07% sensitivity, showing its po-
tential to predict the response to DME treatment and
identify early non-responders for treatment adjust-
ment.
In their study, (Cao et al., 2021) aimed to predict
therapeutic responses to anti-VEGF agents in OCT
images of DME patients at the start of medical treat-
ment, using an explainable machine learning-based
system. 712 patients were classified as poor respon-
ders (294) and good responders (418) based on the re-
duction in central macular thickness following three
injections. Models were developed to make predic-
tions based on the features extracted from the basic
OCT. After performing 5-fold cross-validation, the
best model was a random forest (RF) with a sensi-
tivity of 0.900, a specificity of 0.851, and an AUC
of 0.923. Ophthalmologists One and Two achieved
sensitivities of 0.775 and 0.750, and specificities of
0.716 and 0.821 respectively. The sum of the hyper-
reflective points proved to be the most relevant fea-
ture. Thus, the RF algorithm accurately predict the
response to anti-VEGF treatment, contributing to per-
sonalized therapeutic planning.
The table 1 below represents the summary of re-
lated work.
3 PROPOSED METHOD
In this study, we introduce a novel approach called
ESSDP (Extended Siam Saves Diabetes Patients),
which leverages the Siamese network architecture for
predicting the response to anti-VEGF treatment in
DME patients using OCT images. This name reflects
the core objective of the framework: extending the
application of Siamese networks to improve the lives
of diabetes patients through advanced prediction ca-
pabilities.
The Siamese network is a variant of neural net-
work design initially proposed by Bromley et al.
(Koch et al., 2015). They developed a pair of iden-
tical neural networks with shared parameters and co-
efficients, which generated dual feature representa-
tions when presented with a pair of input signatures.
The outcome for the two signatures comprises a pair
of vectors. These representations are then evalu-
ated using a similarity metric, which was utilized as
an optimization criterion during the learning process.
Over time, the Siamese network has been adapted
to additional areas of machine vision applications,
such as identity confirmation (Taigman et al., 2014)
and single-example image classification (Koch et al.,
2015). The core principle of the Siamese neural ar-
A Deep Learning Approach for Predicting the Response to Anti-VEGF Treatment in Diabetic Macular Edema Patients Using Optical
Coherence Tomography Images
455

Table 1: Summary table of related work dealing with response to anti-vegf treatment.
Author Method Database Results
(Meng et al., 2024) Logistic regression,
SVM, BPNN
Private, 113 eyes
from 82 patients
Sensitivity = 0.962%,
Specificity = 0.926%,
F1-Score = 0.962%,
AUC = 0.982%
(Jin et al., 2024) Deep learning (U-
Net)
Private, 2955 OCT
images from 14 eyes
AUROC 0.993% for IRF,
0.998% for SRF volume
(Liu et al., 2023) GAN models (Reg-
GAN best)
Private, 715 train-
ings, 103 validations
RegGAN showed highest
prediction accuracy, MAE
26.74±21.28 m for CMT
(Ko et al., 2022) Temporal CNN
(TCN)
Private, Taipei Veter-
ans General Hospital,
317 patients
Accuracy = 81.25%,
Specificity = 74.40%,
Sensitivity = 92.07%
(Cao et al., 2021) Random Forest Private, 712 patients Sensitivity = 0.900%,
Specificity = 0.851%,
AUC = 0.923%
chitecture is to acquire generalized feature encodings
with a similarity (or difference) measure derived from
the feature representations extracted from a pair of
comparable inputs (retinal scans in our case). The
Siamese architectures have demonstrated particular
effectiveness in scenarios with sparse data, as they can
be trained using limited labeled examples and sub-
sequently refined on more extensive datasets (Koch
et al., 2015).
The Siamese Network architecture is a family of
designs that typically encompasses a pair of equiv-
alent networks. These two networks possess identi-
cal layer counts and structure, featuring shared co-
efficients and weights. Modifications to the param-
eters of one network are mirrored in the companion
network due to the identical configuration. This ap-
proach has proven effective for dimensionality reduc-
tion in weakly supervised metric learning and identity
verification (Koch et al., 2015).
The uppermost layer of these networks incorpo-
rates an objective function that quantifies the sim-
ilarity or divergence score utilizing Euclidean dis-
tance, cosine similarity, or Manhattan distance be-
tween the feature vector representations from the two
networks. Three widely-used objective functions as-
sociated with Siamese networks are contrastive loss,
triplet loss, and binary cross-entropy.
For our investigation, We employed the binary
cross-entropy (BCE) loss function, denoted as L
BCE
,
and defined as follows:
L
BCE
= −[ylog(p) + (1 − y)log(1 − p)] (1)
In this equation:
• L
BCE
represents the binary cross-entropy loss.
• y ∈ {0, 1} is the actual class designation (or
ground truth), where y = 1 indicates the positive
class, and y = 0 indicates the negative class.
• p ∈ [0, 1] denotes the likelihood estimated by the
model that the instance belongs to the positive
class (y = 1).
The objective of Siamese networks is to generate
the vectorized feature representation among sample
images sharing an identical class designation to be
nearer together, while distancing the feature vector
representations among sample images with distinct
class designations. Through the binary cross-entropy
objective function 1, following the learning phase
of the model, the resulting feature vector possesses
the characteristic that the Manhattan separation be-
tween similarly-classified images is more cohesive
compared to images from different categories. For
determining if a pair of images are of the same cat-
egory (label = 0) or distinct categories label= 1), a
threshold on the cosine divergence of the separation
among stored vector representations must be estab-
lished. Generally, this approach is decided through
model training and seeking resemblance scores from
artificial and authentic images. A match in the top
K is deemed a qualifying criterion derived from the
image collection using the established threshold.
The figure 1 below illustrates the flowchart of the
proposed method based on Siamese network architec-
ture.
The complete process of treatment response clas-
sification structure is illustrated in figure 2 below.
ICAART 2025 - 17th International Conference on Agents and Artificial Intelligence
456
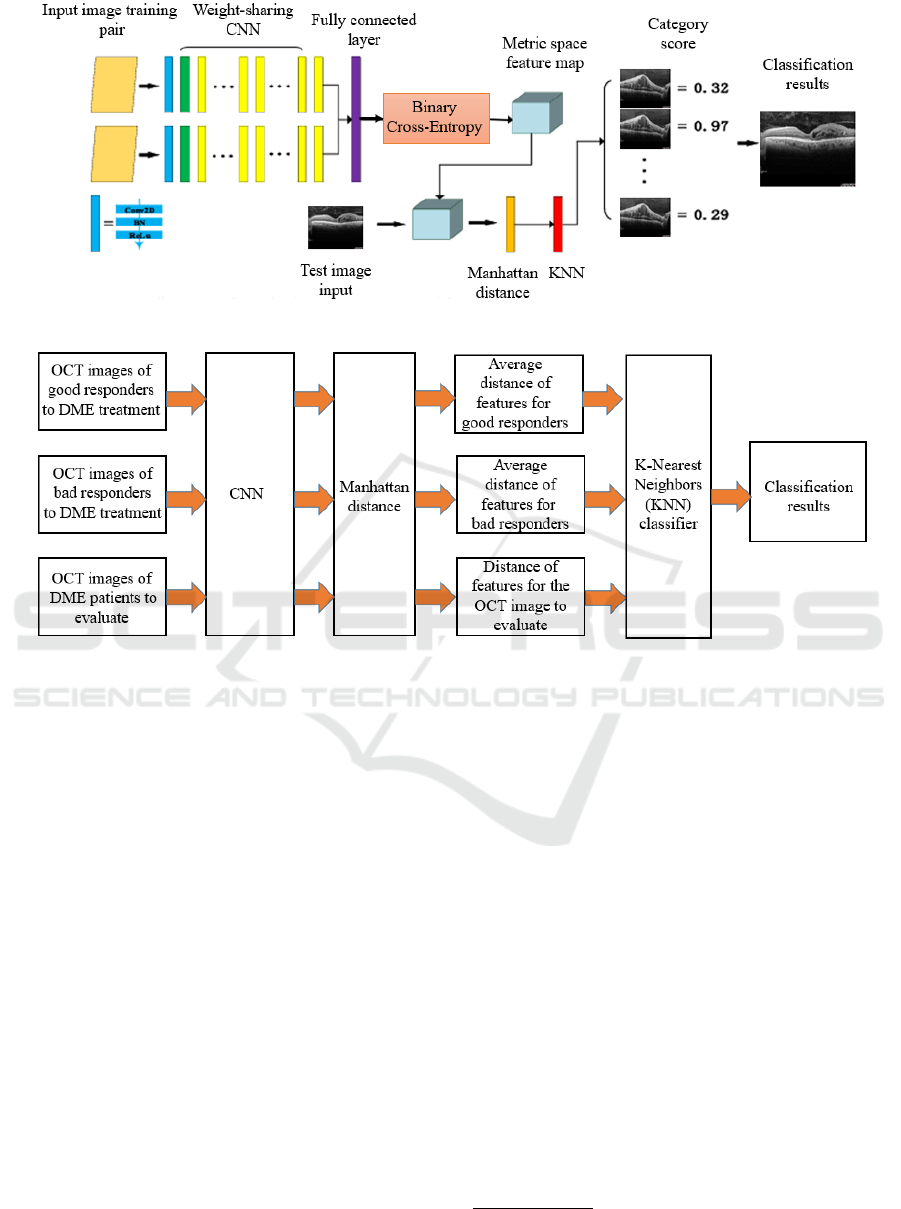
Figure 1: The flowchart of the complete process of the proposed solution using Siamese networks.
Figure 2: Flowchart of treatment response classification for the test dataset.
Feature Extraction Using CNN
During the test phase, the test sample and the
trained samples are extracted by the convolutional
neural network in order to derive relevant attributes
from OCT scans.
This step captures the most important aspects of the
images for predicting the treatment response.
Calculation of Manhattan Distances
After feature extraction, we calculate the Man-
hattan distances between these features and those
of the reference groups (good and bad responders).
This step quantifies the similarity between a new
patient and the reference patients by using function
2, formulated as follows:
D
Manhattan
=
n
∑
i=1
|x
i
− y
i
| (2)
In this equation:
• D
Manhattan
represents the Manhattan distance,
which quantifies the similarity between two vec-
tors x and y.
• x
i
and y
i
are the i-th components of the respective
vectors.
• n denotes the total number of components in each
vector.
Classification Using KNN
Finally, we use a k-Nearest Neighbors (KNN)
classifier to determine the class of the new patient
based on their similarity to the training samples.
This similarity-based classification method provides
increased interpretability of the results.
4 EXPERIMENTAL RESULTS
4.1 Dataset
4.1.1 Training Dataset (Kaggle OCT)
For the training of our model, we have used the retinal
OCT dataset from Kaggle
2
. This extensive dataset en-
2
https://www.kaggle.com/code/paultimothymooney/
detect-retina-damage-from-oct-images
A Deep Learning Approach for Predicting the Response to Anti-VEGF Treatment in Diabetic Macular Edema Patients Using Optical
Coherence Tomography Images
457

compasses 84,495 retinal scans in JPEG format, cat-
egorized into four distinct groups: NORMAL, CNV
(choroidal neovascularization), DME (diabetic mac-
ular edema), and DRUSEN. The collection is orga-
nized into three main directories (train, test, and val),
each containing subdirectories for each image cate-
gory. This structure enables the learning and assess-
ment of the system across a diverse range of ocular
conditions.
4.1.2 Test Dataset
Our test dataset, for the classification of good and
poor responders to anti-VEGF treatment, comes from
the Ophthalmology Department A at the H
´
edi Raies
Institute in Tunis. It includes 120 radiographs cor-
responding to 104 patients with DME who received
anti-VEGF treatment. For each patient, we collected
pre-treatment and post-treatment images. A profes-
sional ophthalmologist analyzed the post-treatment
images to create a database containing the pre-
treatment image associated with a label indicating
whether the patient is a good or poor responder to the
treatment.
4.2 Results and Discussion
Our overall experimental procedure relies on the
Siamese network framework. It begins with feature
extraction from pairs of OCT images, followed by
the calculation of the distance between these features.
The loss function guides the learning process by min-
imizing the distance between images of patients with
similar responses to anti-VEGF treatment while max-
imizing it between patients with different responses.
This approach allows learning directly from pairs of
images and works efficiently with relatively small
datasets, which is often the case in medical applica-
tions.
Once the features are derived, a KNN k-Nearest
Neighbors algorithm is employed for the ultimate cat-
egorization. KNN evaluates the Manhattan distance
between the attributes of the sample picture and the
ones from the training dataset to forecast the sample
picture’s class based on the closest neighbors in the
attribute space.
4.2.1 Hyperparameters’ Tuning
In our experimental environment, models were
trained and validated using a five-fold cross-
validation approach to ensure generalization of re-
sults. Hyperparameters, including batch size, learn-
ing rate, and number of time periods, were optimized
using a grid search.
Here are the specific values for the hyperparameters
according to our code:
• Batch size: 32.
• Number of epochs:10.
• Cross-validation: Five-fold cross-validation ap-
proach.
• Hyperparameter Optimization: Using grid search
to optimize hyperparameters.
• Callback to adjust the learning rate: ReduceL-
ROnPlateau that reduces the learning rate by 0.2
after 3 periods without improved validation loss,
with a minimum of 0.00001.
The Siamese model was trained using these optimized
parameters, thus ensuring a good generalization of the
results.
Performance evaluation plays a crucial role in every
image classification endeavor. Various assessment
criteria exist to gauge the performance of an image
classification system. In this work, we focus on: accu-
racy, sensitivity, F1-score, as well as precision (Gran-
dini and Visani, 2020).
AUC-ROC Curve is used to interpret the likeli-
hood that, when considering two randomly chosen
patients, one being a treatment responder and the
other a non-responder, the predictive marker’s value
is greater for the responder compared to the non- re-
sponder. Notably, an AUC of 0.5 (50%) suggests
that the marker is non-informative. A rise in AUC
signifies enhanced discriminatory capabilities of the
model, with a maximum of 1.0 (100%).
4.2.2 Experimental Results
We chose to use the EfficientNetB2 as an architecture
for our convolutional neural network (CNN) model.
This architecture has recently demonstrated strong
performance across many image classification tasks,
offering a good balance between accuracy and ef-
ficiency. The table 2 represents the results of our
method.
Table 2: The overall results of the proposed method Effi-
cientNetB2.
Metric Value
Accuracy 0.80%
Sensitivity 0.71%
Precision 0.89%
F1-score 0.74%
4.2.3 Classification Results
A prediction of ’good responders’, with associated
scores of 0.40 for poor responders and 0.60 for good
ICAART 2025 - 17th International Conference on Agents and Artificial Intelligence
458
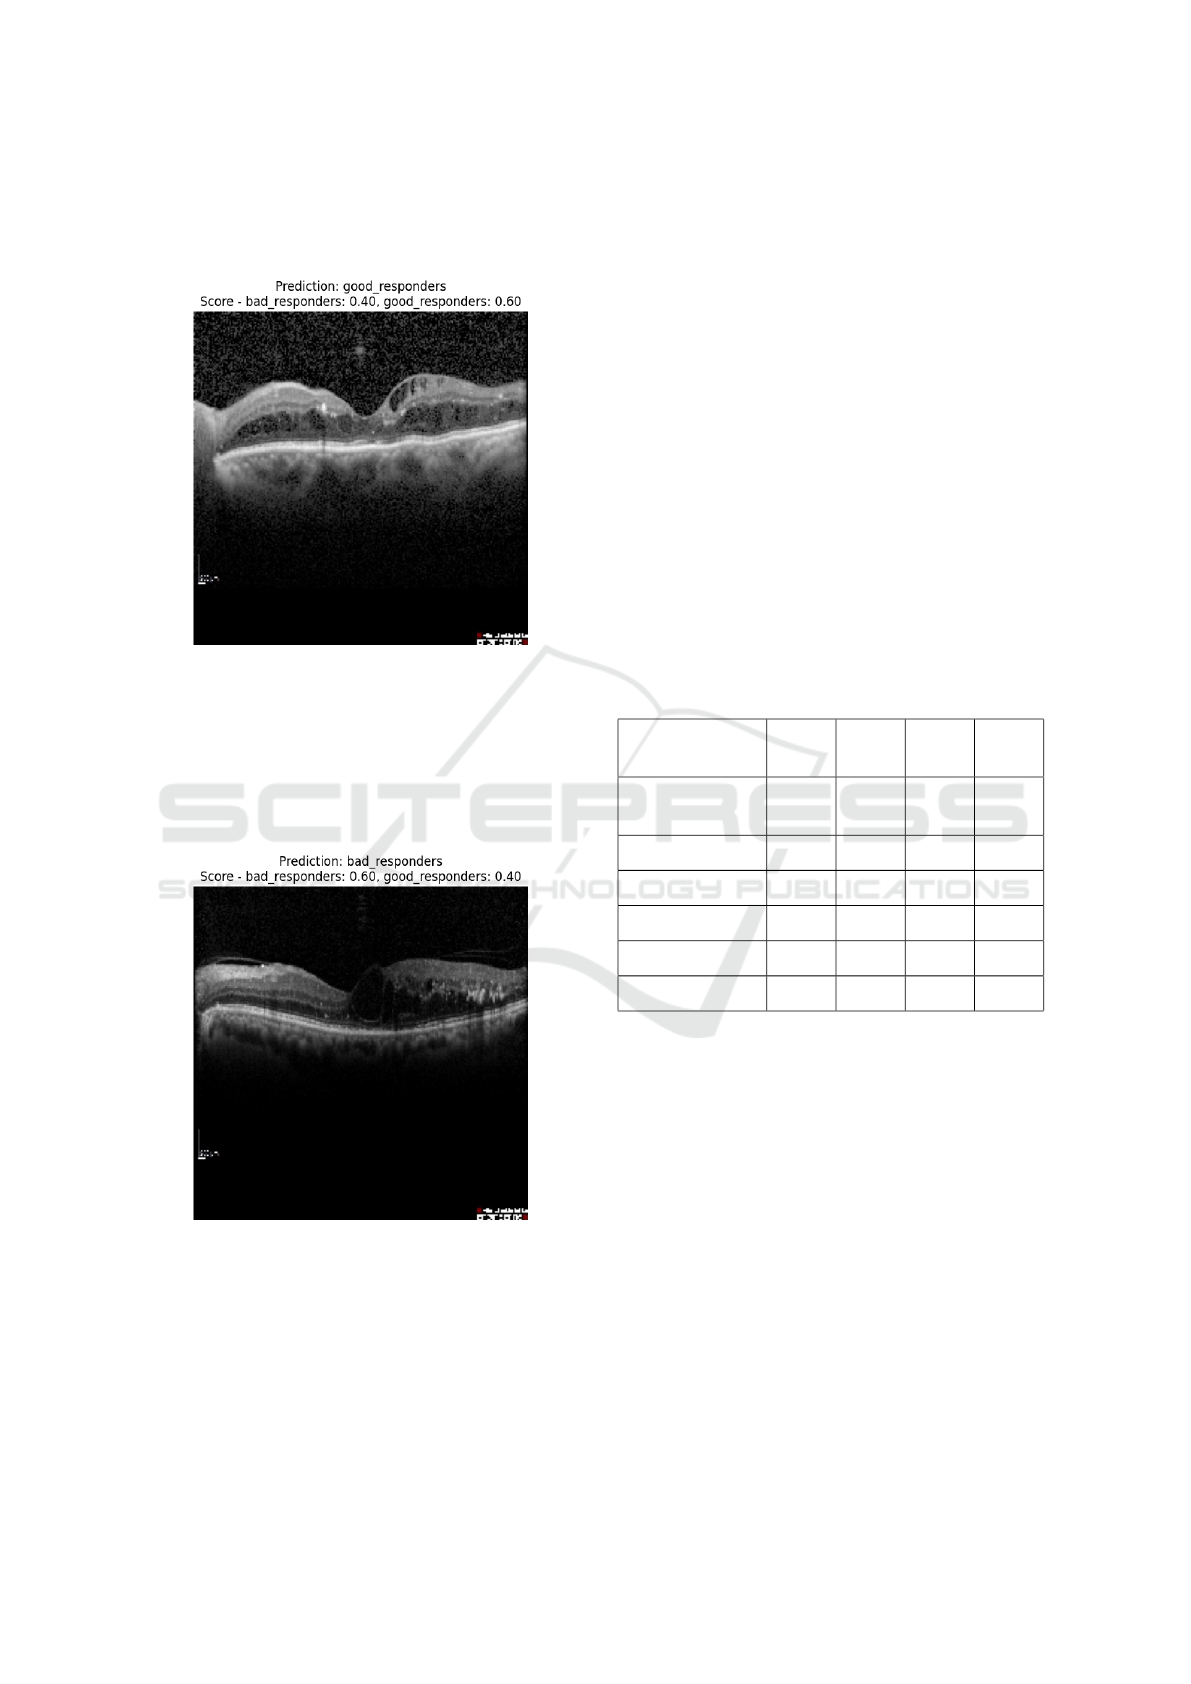
responders. Figure 3 below represents the prediction
on an OCT image is that the image of a DME patient
is good for anti-VEGF treatment.
Figure 3: Good responder patient.
It shows a prediction of ’bad responders’, with as-
sociated scores of 0.60 for poor responders and 0.40
for good responders. Figure 4 below represents the
prediction on an OCT image, meaning that here we
see that the image is of a DME patient, which is clas-
sified as a poor responder to anti-VEGF treatment.
Figure 4: Bad responder patient.
4.2.4 Training and Validation Loss and
Accuracy Curves
Figure 5 below shows the evolution of the model’s
loss and accuracy during training and validation
across epochs.
The training loss curve decreases fairly steadily,
indicating that the model is learning well during train-
ing. The validation loss curve follows a similar trend,
but with a slight increase at the end, suggesting pos-
sible overfitting.
The accuracy curves show an inverse trend, with
an increase in both training accuracy and validation
accuracy over the epochs. This confirms that the
model is improving in its performance.
4.2.5 Comparison with Other Architectures
We evaluated several Convolutional Neural Network
(CNN) architectures for our classification task and
compared their effectiveness based on metrics such
as accuracy, sensitivity, precision, and F1-score. Our
following results provide a comparison of the mod-
els EfficientNetB2, CNN from scratch, InceptionV3,
ResNet50V2, EfficientNetB1, and EfficientNetB3, al-
lowing us to identify the strengths and weaknesses of
each architecture.The table 3 provides a comparison
of evaluation metrics.
Table 3: Comparison of evaluation metrics.
Accu-
racy
Sensi-
tivity
Preci-
sion
F1-
score
CNN from
scratch
0.79% 0.79% 0.79% 0.79%
InceptionV3 0.68% 0.68% 0.80% 0.64%
ResNet50V2 0.50% 0.50% 0.25% 0.33%
EfficientNetB1 0.62% 0.62% 0.79% 0.56%
EfficientNetB2 0.80% 0.71% 0.89% 0.74%
EfficientNetB3 0.71% 0.57% 0.85% 0.54%
Comparison with Other Methods from the
Literature
The table 4 below compares our method, based on
a Siamese network and EfficientNetB2, with other
approaches from the literature. It highlights (1) the
databases used, (2) the results in terms of sensitiv-
ity, specificity, F1-score, and AUC, and (3) the per-
formance of each study.
4.2.6 Discussion
The results obtained, with an accuracy of 80%, a sen-
sitivity of 71%, a precision of 89%, and an F1-Score
of 74%, demonstrate the effectiveness of the proposed
approach for predicting the anti-VEGF treatment re-
sponse in patients with DME. These results are likely
attributed to the use of the Siamese network com-
A Deep Learning Approach for Predicting the Response to Anti-VEGF Treatment in Diabetic Macular Edema Patients Using Optical
Coherence Tomography Images
459
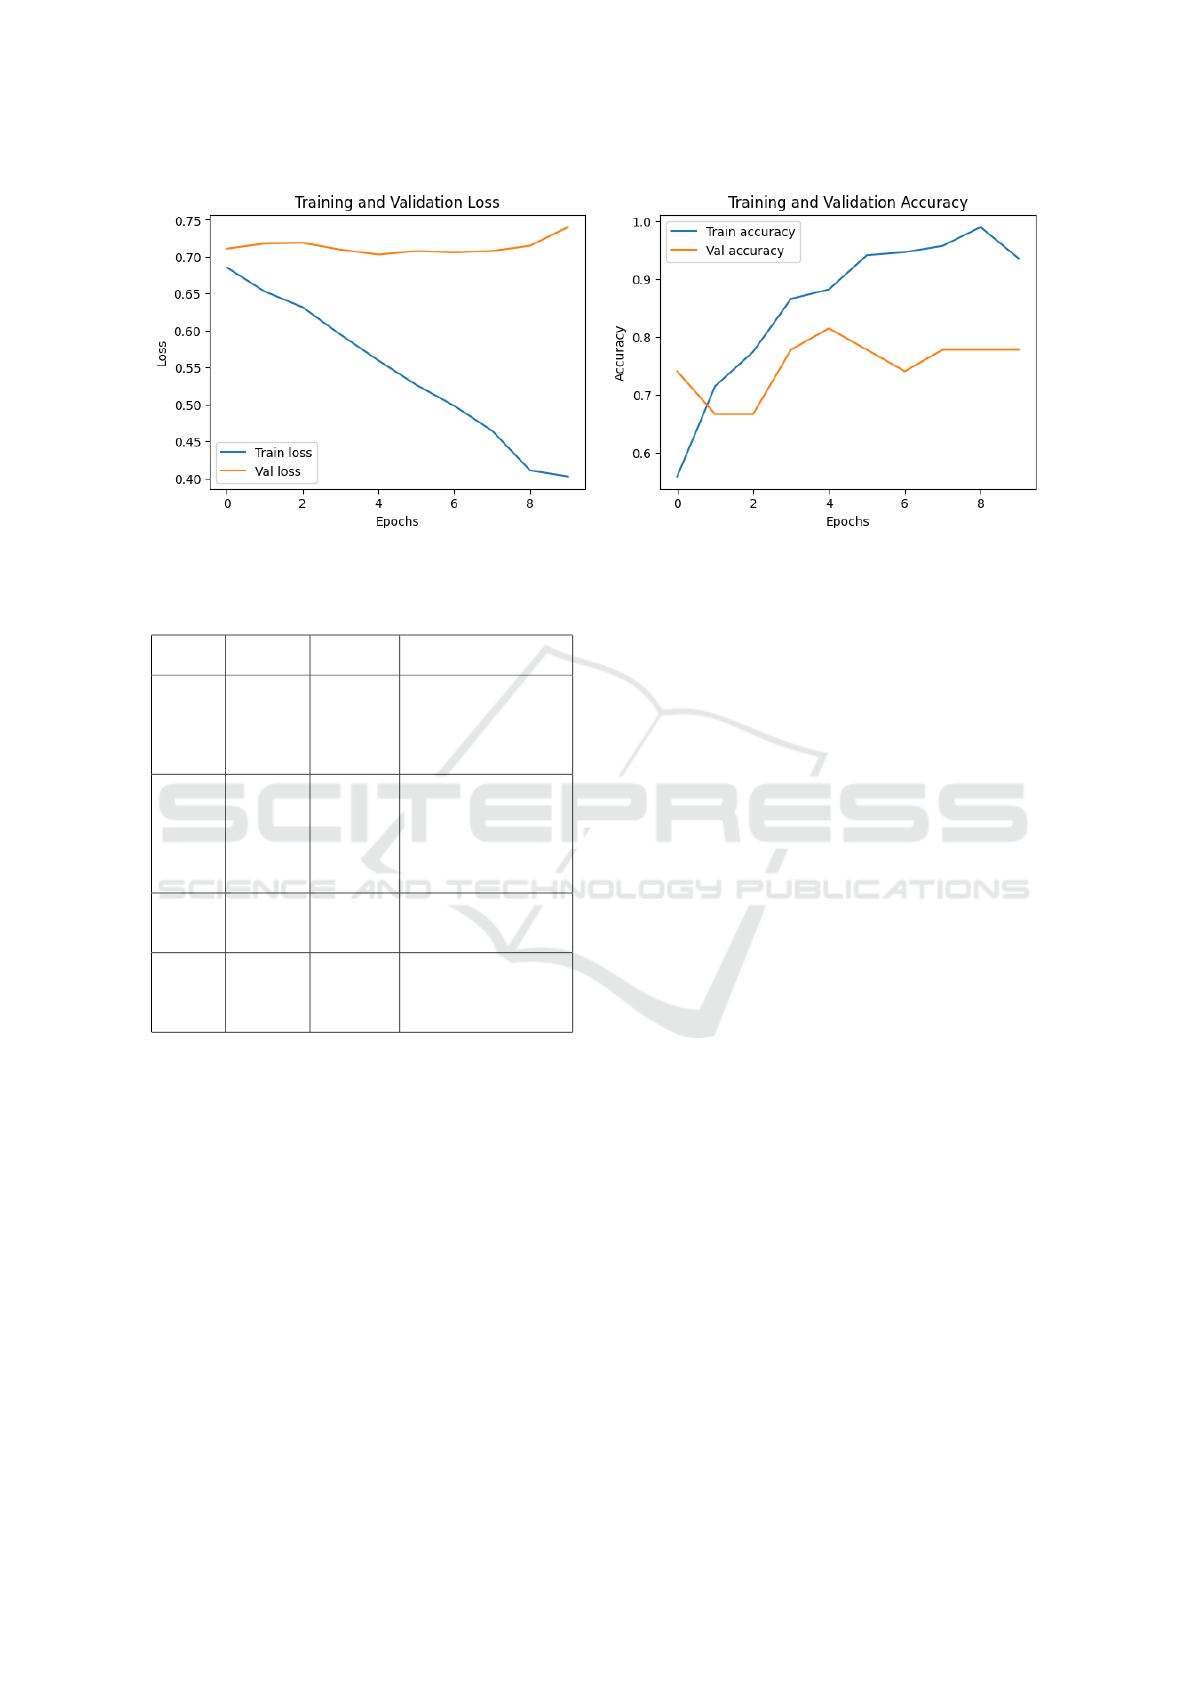
Figure 5: Training and validation loss of the EfficientNetB2 architecture.
Table 4: Comparison with other methods from the litera-
ture.
Author Method Data-
base
Results
(Meng
et al.,
2024)
Logistic
regres-
sion,
SVM,
BPNN
Private,
113 eyes
from 82
patients
Sensitivity=0.962%,
Specificity=0.926%,
F1-Score = 0.962%,
AUC = 0.982%
(Jin
et al.,
2024)
Deep
learning
(U-Net)
Private,
2955
OCT
images
from 14
eyes
AUROC 0.993% for
IRF,
0.998% for SRF vol-
ume
(Cao
et al.,
2021)
Random
Forest
Private,
712
patients
Sensitivity=0.900%,
Specificity=0.851%,
AUC=0.923%
Our
method
Efficient-
NetB2
Private,
104 OCT
images
Accuracy=0.80% ,
Sensitivity=0.71%,
Precision=0.89%,
F1 score=0.74%
bined with the EfficientNetB2 architecture, which al-
lows for efficient feature extraction from OCT im-
ages while effectively managing the limited dataset.
The ability of our method to function with a reduced
dataset is one of its main strengths. However, several
limitations should be acknowledged. First, the small
size of our dataset (104 patients) may limit the gener-
alizability of the results to larger or more diverse pop-
ulations. Additionally, variations in OCT image qual-
ity, due to differences in the equipment used or ac-
quisition protocols, could affect the robustness of the
model. Poor-quality or poorly lit images, for exam-
ple, may introduce bias into the model’s predictions.
To enhance the robustness and generalizability of our
method, several avenues are being explored. Testing
our approach on other databases, including similar
retinal pathologies or other medical imaging modal-
ities, would allow us to assess its ability to adapt to
different clinical scenarios. Moreover, integrating ad-
ditional clinical data, such as age, medical history,
or other biological factors of patients, could enrich
the predictions by capturing aspects not visible in the
OCT images, further strengthening the accuracy of
the results. We also plan to expand our study to other
retinal pathologies to test the generalization capability
of our method while maintaining its advantage of ef-
fectively working with limited datasets. These efforts
will help validate the applicability of our approach in
various clinical contexts.
Furthermore, we aim to explore multimodal ap-
proaches, such as combining textual and medical im-
age information. Integrating these different sources
of information could improve the precision and per-
formance of the model, further strengthening the con-
tribution of our work. Lastly, we intend to implement
additional models that leverage the inherent strengths
of machine learning and deep learning methods to fur-
ther improve the prediction of the anti-VEGF treat-
ment response in patients with DME.
5 CONCLUSION
In humans, learning is a continuous process that
evolves throughout life, influenced by sensory percep-
tions, personal experiences, and recurring events. In
contrast, devices function through processes that rely
on input and output data. Deep learning, a technique
inspired by the human brain, has emerged as a power-
ful tool, achieving levels of accuracy that sometimes
surpass human capabilities. It has proven particularly
effective in the medical field, where it can identify
diseases in medical images, characterize them, and
even quantify their progression.
ICAART 2025 - 17th International Conference on Agents and Artificial Intelligence
460

Unlike humans, who continuously process large
volumes of data and face a variety of challenges over
time, deep learning models typically learn from a
more limited dataset tailored to a specific task. This
study focused on exploring the impact of an optimized
data pipeline on the performance of a deep learn-
ing model, highlighting the significant improvements
that can be achieved through a data-driven approach.
Our findings suggest that combining robust data engi-
neering with a relatively simple convolutional neural
network architecture, such as the Siamese network,
holds great potential for advancing clinical applica-
tions. Specifically, the model can be leveraged to
predict responses to anti-VEGF treatment in patients
with diabetic macular edema (DME), offering a valu-
able tool for personalized treatment strategies.
The use of the Siamese network architecture in our
study, designed for scenarios involving small datasets,
was particularly beneficial given the limited size of
our private OCT image dataset. However, several av-
enues remain for enhancing clinical outcomes. Fu-
ture research could focus on expanding the dataset by
including diverse patient populations to improve the
generalizability of the model. Additionally, integrat-
ing multimodal data, such as clinical histories or ge-
netic information, could enhance predictive accuracy.
Exploring transfer learning or semi-supervised learn-
ing techniques could also help overcome the limita-
tions of small datasets and expand the applicability
of this approach to other retinal pathologies and dis-
eases beyond DME. These steps could strengthen the
model’s potential in clinical settings, ultimately lead-
ing to more accurate and timely treatment predictions
for patients.
REFERENCES
Bhagat, N., Grigorian, R. A., Tutela, A., and Zarbin, M. A.
(2009). Diabetic macular edema: pathogenesis and
treatment. Survey of Ophthalmology, 54(1):1–32.
Brown, D. M., Nguyen, Q. D., Marcus, D. M., Boyer, D. S.,
Patel, S., Feiner, L., and Ehrlich, J. S. (2013). Long-
term outcomes of ranibizumab therapy for diabetic
macular edema: the 36-month results from two phase
iii trials. Ophthalmology, 120(10):2013–2022.
Browning, D. J., Glassman, A. R., Aiello, L. P., Beck,
R. W., Brown, D. M., Fong, D. S., and Ferris, F. L.
(2007). Relationship between optical coherence to-
mography–measured central retinal thickness and vi-
sual acuity in diabetic macular edema. Ophthalmol-
ogy, 114(3):525–536.
Cao, J., You, K., Jin, K., Lou, L., Wang, Y., Chen, M., and
Ye, J. (2021). Prediction of response to anti-vascular
endothelial growth factor treatment in diabetic mac-
ular oedema using an optical coherence tomography-
based machine learning method. Acta Ophthalmolog-
ica, 99(1):e19–e27.
Ding, F. and Zhu, F. (2022). Hliferl: A hierarchical life-
long reinforcement learning framework. Journal of
King Saud University - Computer and Information
Sciences, 34(7):4312–4321.
Fauw, J. D., Ledsam, J. R., Romera-Paredes, B., Nikolov,
S., Tomasev, N., Blackwell, S., and Ronneberger, O.
(2018). Clinically applicable deep learning for diag-
nosis and referral in retinal disease. Nature Medicine,
24(9):1342–1350.
Ferrara, N., Hillan, K. J., Gerber, H. P., and Novotny, W.
(2004). Discovery and development of bevacizumab,
an anti-vegf antibody for treating cancer. Nature Re-
views Drug Discovery, 3(5):391–400.
Grandini, E. B. and Visani, G. (2020). Metrics for multi-
class classification: an overview. arXiv preprint,
2008.05756.
Jin, Y., Yong, S., Ke, S., Zhang, C., Liu, Y., Wang, J., and
Zhang, J. (2024). Deep learning assisted fluid vol-
ume calculation for assessing anti-vascular endothe-
lial growth factor effect in diabetic macular edema.
Heliyon, 10(8).
Kermany, D. S., Goldbaum, M., Cai, W., Valentim, C. C.,
Liang, H., Baxter, S. L., and Zhang, K. (2018). Iden-
tifying medical diagnoses and treatable diseases by
image-based deep learning. Cell, 172(5):1122–1131.
Ko, Y., Peng, C., Ho, H., Chiu, S., Chen, S., and Lee, C.
(2022). Deep learning assisted prediction of long-term
visual outcome after 3 monthly anti-vascular endothe-
lial growth factor injections in patients with central-
involved diabetic macular edema. Investigative Oph-
thalmology & Visual Science, 63(7):3778–F0199.
Koch, G., Zemel, R., and Salakhutdinov, R. (2015).
Siamese neural networks for one-shot image recogni-
tion. In ICML Deep Learning Workshop, volume 2,
Lille.
Liu, S., Hu, W., Xu, F., Chen, W., Liu, J., Yu, X., and
Li, J. (2023). Prediction of oct images of short-
term response to anti-vegf treatment for diabetic mac-
ular edema using different generative adversarial net-
works. Photodiagnosis and Photodynamic Therapy,
41:103272.
Meng, Z., Chen, Y., Li, H., Zhang, Y., Yao, X., Meng,
Y., and Luo, J. (2024). Machine learning and optical
coherence tomography-derived radiomics analysis to
predict persistent diabetic macular edema in patients
undergoing anti-vegf intravitreal therapy. Journal of
Translational Medicine, 22(1):358.
Schlegl, T., Waldstein, S. M., Bogunovic, H., Endstraßer, F.,
Sadeghipour, A., Philip, A. M., and Schmidt-Erfurth,
U. (2018). Fully automated detection and quantifica-
tion of macular fluid in oct using deep learning. Oph-
thalmology, 125(4):549–558.
Taigman, Y., Yang, M., Ranzato, M., and Wolf, L. (2014).
Deepface: Closing the gap to human-level perfor-
mance in face verification. In Proceedings of the IEEE
Conference on Computer Vision and Pattern Recogni-
tion, pages 1701–1708.
A Deep Learning Approach for Predicting the Response to Anti-VEGF Treatment in Diabetic Macular Edema Patients Using Optical
Coherence Tomography Images
461

Ting, D. S. W., Pasquale, L. R., Peng, L., Campbell, J. P.,
Lee, A. Y., Raman, R., and Wong, T. Y. (2019). Artifi-
cial intelligence and deep learning in ophthalmology.
British Journal of Ophthalmology, 103(2):167–175.
Yau, J. W., Rogers, S. L., Kawasaki, R., Lamoureux, E. L.,
Kowalski, J. W., Bek, T., and Wong, T. Y. (2012).
Global prevalence and major risk factors of diabetic
retinopathy. Diabetes Care, 35(3):556–564.
Zhang, Y., Yang, M., Zhao, S. X., Shen, L. J., and Han,
W. (2022). Hyperosmolarity disrupts tight junction
via tnf-α/mmp pathway in primary human corneal ep-
ithelial cells. International Journal of Ophthalmology,
15(5):683.
ICAART 2025 - 17th International Conference on Agents and Artificial Intelligence
462
