
Time Series and Deep Learning Approaches for Predicting English
Premier League Match Outcomes
Weronika Wiechno
1
, Bartosz Bartosik
2 a
and Piotr Duch
2 b
1
Institute of Information Technology, Lodz University of Technology, al. Politechniki 8, Lodz, Poland
2
Institute of Applied Computer Science, Lodz University of Technology, Bohdana Stefanowskiego 18, Lodz, Poland
Keywords:
Football Match Prediction, Long Short-Term Memory, Deep Neural Network, Machine Learning, Recurrent
Neural Network, Siamese Neural Network, Multilayer Perceptron.
Abstract:
The continuous development of tools used in football match analysis has resulted in a greater availability
of game statistics, providing analysts, coaches, and researchers with with more detailed data regarding the
matches played. This results in the need for more advanced algorithms for effectively processing and inter-
preting the available information. In the paper, the modified architecture of the Siamese Neural Networks
is presented. The time series approach is incorporated to capture temporal dynamics in teams’ performance
throughout analysed matches. The algorithm was compared with classifiers and deep neural networks ap-
proaches commonly used for match outcome prediction in the literature. All methods were trained and tested
on two prepared datasets with the same division into train and test sets. Finally, the proposed architecture
outperforms others by reaching higher overall accuracy in match prediction outcomes.
1 INTRODUCTION
Football has been a popular sport in many a civiliza-
tion since time immemorial. Throughout centuries, it
has occupied people’s minds to a great extent, evolv-
ing into a global phenomenon. Nowadays, with over
5 billion fans worldwide, it is hard to discredit its in-
fluence. Throughout the football season, changes in
team performance are closely associated to fluctua-
tions in public opinion and sentiment, which in turn
influence the growth of the sports prediction industry
and discussions surrounding match outcomes.
However, this money and popularity influx is not
distributed equally across all football leagues. Among
them the English Premier League stands as the excep-
tional case. According to Ampere’s Sports Consumer
survey (Q4 2023) (Daniel Harraghy, 2024), it is the
third most popular competition after the Uefa Cham-
pions League and the Fifa World Cup. Nevertheless
it is the first when it comes to the proportion of me-
dia rights revenue generated by international broad-
cast deals and sponsorships.
The continuous development of tools used in foot-
ball match analysis has resulted in a greater avail-
a
https://orcid.org/0009-0002-9699-3440
b
https://orcid.org/0000-0003-0656-1215
ability of game statistics, providing analysts, coaches,
and researchers with detailed insights into historical
games. A considerable percentage of the data col-
lected during these matches is readily available to re-
searchers and analysts aiming to predict future match
outcomes or in-depth evaluation. This in turn, cre-
ates a whole host of new opportunities. After all,
the beneficiaries, are not only the large bookmak-
ing companies or clubs. A great many football fans
avail themselves of those analyses to better under-
stand their favourite team’s strategies or to play in
fantasy leagues where reliable predictions are at a pre-
mium.
In this paper, we present a novel approach for pre-
dicting football match outcomes by leveraging time
series analysis and Siamese networks. Siamese net-
works are primarily used in tasks where measuring
the similarity or distance between two inputs is es-
sential. In the proposed approach the modified archi-
tecture based on Siamese networks is used for match
outcome prediction by comparing pairs of features
related to the teams and specific match characteris-
tics. The features used for match outcome predic-
tion are taken from the previous matches played by
both teams and treated as time series data to capture
temporal dynamics. To compare the results obtained
using Siamese networks, the most popular classifiers
Wiechno, W., Bartosik, B. and Duch, P.
Time Series and Deep Learning Approaches for Predicting English Premier League Match Outcomes.
DOI: 10.5220/0013182500003890
In Proceedings of the 17th International Conference on Agents and Artificial Intelligence (ICAART 2025) - Volume 3, pages 789-796
ISBN: 978-989-758-737-5; ISSN: 2184-433X
Copyright © 2025 by Paper published under CC license (CC BY-NC-ND 4.0)
789

and neural networks found in the literature, including
recurrent neural networks, were trained on the same
set of features.
2 BACKGROUND AND RELATED
WORKS
2.1 Predictive Models Evolution
The history of attempts to predict football match re-
sults dates back to the mid-20th century. One of the
earliest studies focused on analysing relationship be-
tween factors like possession, shots on and off target,
and the likelihood of scoring a goal was conducted
over 50 years ago (Reep and Benjamin, 1968). Since
then, many different approaches were used in order
to predict the matches outcomes. The most popular
includes Logistic Regression, Artificial Neural Net-
works (ANNs), Bayesian Networks, Decision trees,
k-NN, Na
¨
ıve Bayes, Random Forest, and Support
Vector Machine (SVM). Recently, approaches based
on deep learning have become more popular. One of
the example of such approaches is the Artificial Neu-
ral Network trained to predict results of all matches
during 2006 Soccer World Cup tournament (Huang
and Chang, 2010).
2.2 Literature Review
In case of the Premier League, which is the object
of this research, aforementioned methods are applied
along with different approaches that vary in terms of
selected matches data source, seasons span, features
and feature engineering, and finally parameter tuning.
Commonly utilized data source are websites con-
taining historical matches data, in particular http://
football-data.co.uk. An example of its 11 seasons
composition with Rating statistics, followed by a
careful feature engineering, is a proposition by (Ba-
boota and Kaur, 2019). As a result, their best classi-
fier, gradient boosting, achieves an accuracy of 56.7%
in predicting the matches outcomes aggregated over
two seasons (2014/2015 and 2015/2016) using 33 for-
merly crafted features. This algorithm slightly out-
performed Random Forest, and got higher advantage
over SVM and Na
¨
ıve Bayes.
While (Muszaidi et al., 2022) operates on the same
data origin, only the 2018-2019 season consisting of
380 matches (each of 62 features) has been selected
for training and validation. Unlike the former, this
paper leverages the ANN approach, namely the Mul-
tilayer Perceptron, and obtains the accuracy of 78.4%,
which is higher than the one obtained by its deeper
version. However, it is not stated what set of this data
has been use for validation.
More sophisticated deep learning classifier has
been presented in (Jain et al., 2021). Authors of
this paper prepared their dataset by taking into ac-
count football matches from seasons 2010/2011 to
2017/2018, and performing manual feature selection
making each sample consists of 22 attributes. Next,
the Long Short-Term Memory (LSTM) neural net-
work, which is typically used in tasks requiring under-
standing of sequence for further predictions, has been
employed. After performing a simple grid search hy-
perparameters tuning, the architecture provides the
accuracy of 81.2%. This approach, however, returns
the output within 2 classes — win or loss. This
methodology is flawed, as it disregards the possibil-
ity of a draw, thereby limiting its predictive accuracy.
An extensive review of machine learning match
results prediction has been prepared by (Bunker and
Susnjak, 2022). The paper compares team sports
studies from 1996 to 2019, where football, as the ma-
jority, stands for around 37% of the sports taken into
account. The authors reveal that the ANNs have been
used the most frequently, i.e. in over 21% of the cases,
with the Decision trees on the second place (13%).
The English Premier League appears in four articles
within the review.
2.3 Discussion
The majority of presented papers rely on a data that
has been dimensionally reduced through simple sta-
tistical method — arithmetic mean. Data preparation
plays a crucial role in the predictive accuracy of foot-
ball match outcomes. The way it is averaged may
limit its potential and lead to masking of existing de-
pendencies. This can prevent the model from captur-
ing them as deciding patterns when it comes to reli-
able predictions.
In order to investigate possible accuracy improve-
ments, more sophisticated and less traditional ap-
proaches could be explored. The repeatability of sta-
tistical models that are exerted in this area presents
great potential for testing the ones that is classical use
case serves different tasks nature.
The increasing number of available data, as the
time passes creates new field for validating the solu-
tions developed earlier. More interestingly, investi-
gating more complex models that can efficiently work
with the increased amount of information may enable
capturing dependencies that could have been undis-
coverable before.
ICAART 2025 - 17th International Conference on Agents and Artificial Intelligence
790

3 DATA
The data that has been used in this research spans
from the 2017/2018 to 2023/2024 Premier League
seasons. The dataset covers 2660 matches, of which
1192 ended in a home team victory, 602 in a draw, and
866 in an away team victory. The detailed statistics
of each match have been collected from two sources:
“https://fbref.com/en/” and “http://clubelo.com/”.
3.1 Features
For each match, the performance of home and away
teams in previous matches is being compared. Each
team is described by a set of 18 individual features
that have been meticulously chosen as the ones which
contribution to the match outcome may have the
strongest influence. Next, these teams’ information
are concatenated along with the result of their match
and the venue, yielding a total of 38 attributes describ-
ing their meeting.
These features have been categorized into three
different types. The first type is related to the overall
team form and includes the team’s results in previous
matches, specifically information about wins, losses,
or draws, as well as the location of the match: home
or away. The second type of features concerns de-
tailed information about the team’s performance dur-
ing those matches. This includes the following fea-
tures: the number of aerials won, clearances, corners,
crosses, fouls, goalkicks, interceptions, longballs, off-
sides, passes and passes accuracy, possessions, saves,
shooting accuracy, shots on-target, tackles, throw-ins.
The final set of features relates to the strength of the
team in a given match, for which the Elo rating was
used (Elo, 1961). The Elo rating is well known from
chess, it assess the relative strength of teams based
on their previous performance. The adjustments are
made after each match, depending on the match out-
come and the strength of the opponent.
3.2 Dataset
Two datasets were prepared to thoroughly investigate
the proposed approach. In the first dataset, the form
of both teams (home and away) in the five matches
preceding the considered match is taken into account.
The second dataset, however, focuses on the teams’
form at home and away specifically, considering their
last three respective matches.
The first dataset (MatchForm-5) takes into consid-
eration detailed statistics of both teams in the previous
five matches. For each of those matches, the statistics
of the considered team and its opponent are recorded,
including metrics such as goals scored, shots, passes,
possession, the location of the match, the match out-
come, and the strength of both teams at the time of
the game. This gives a comprehensive informations
about the team’s form leading up to the match in ques-
tion. In total the 38 features is available for each
game. To determine the form of a given team, only
matches played in the Premier League, were taken
into account. Therefore, matches from the Champi-
ons League, FA Cup, or other competitions played by
the teams during that time were ignored. When it was
not possible to generate the form of either team based
on the last five matches the match was ignored. Fi-
nally, the dataset consists of 2307 matches from the
seven seasons considered, with 1046 home team vic-
tory, 518 draws, and 743 away team victory.
The second dataset (HomeAwayForm-3) considers
only the team’s form based on the venue. It is very
common in football that a team’s playing style differs
between home and away matches. This is clearly vis-
ible in the points earned by teams in home matches
and those gathered in away games. Additionally, this
distinction is also evident in the detailed statistics of
the matches, including metrics such as the number
of passes completed, shots taken, and other relevant
performance indicators. In this dataset the form of
the host team in the last three home matches is taken
into account, reflecting potential advantages of play-
ing home. Similarly, for the guest team, their form in
the last three away matches is considered. In contrast
to the first dataset, this case does not include statistics
from opponents in historical matches. Matches for
which it was not possible to collect data on the last
three games for either team were ignored. Finally,
the dataset includes 2228 matches with 20 features,
where 1011 matches ended in a home team victory,
499 in a draw, and 718 in an away team victory.
The literature commonly presents two popular ap-
proaches for dividing data into train and test datasets.
In the first approach, there is a simple division into
two disjoint sets, with 80% of the matches allocated
to the train set and 20% to the test set (80 20, Fig. 1).
The second method of splitting the data takes into ac-
count the seasons in which the matches are played. In
this case, the most recent season is typically treated
as the test data, while the remaining seasons consti-
tute the train set (test is last). In our study, both ap-
proaches were applied.
4 PROPOSED APPROACH
First, the selected classifiers were trained on the pre-
viously prepared data to establish a baseline for the
Time Series and Deep Learning Approaches for Predicting English Premier League Match Outcomes
791
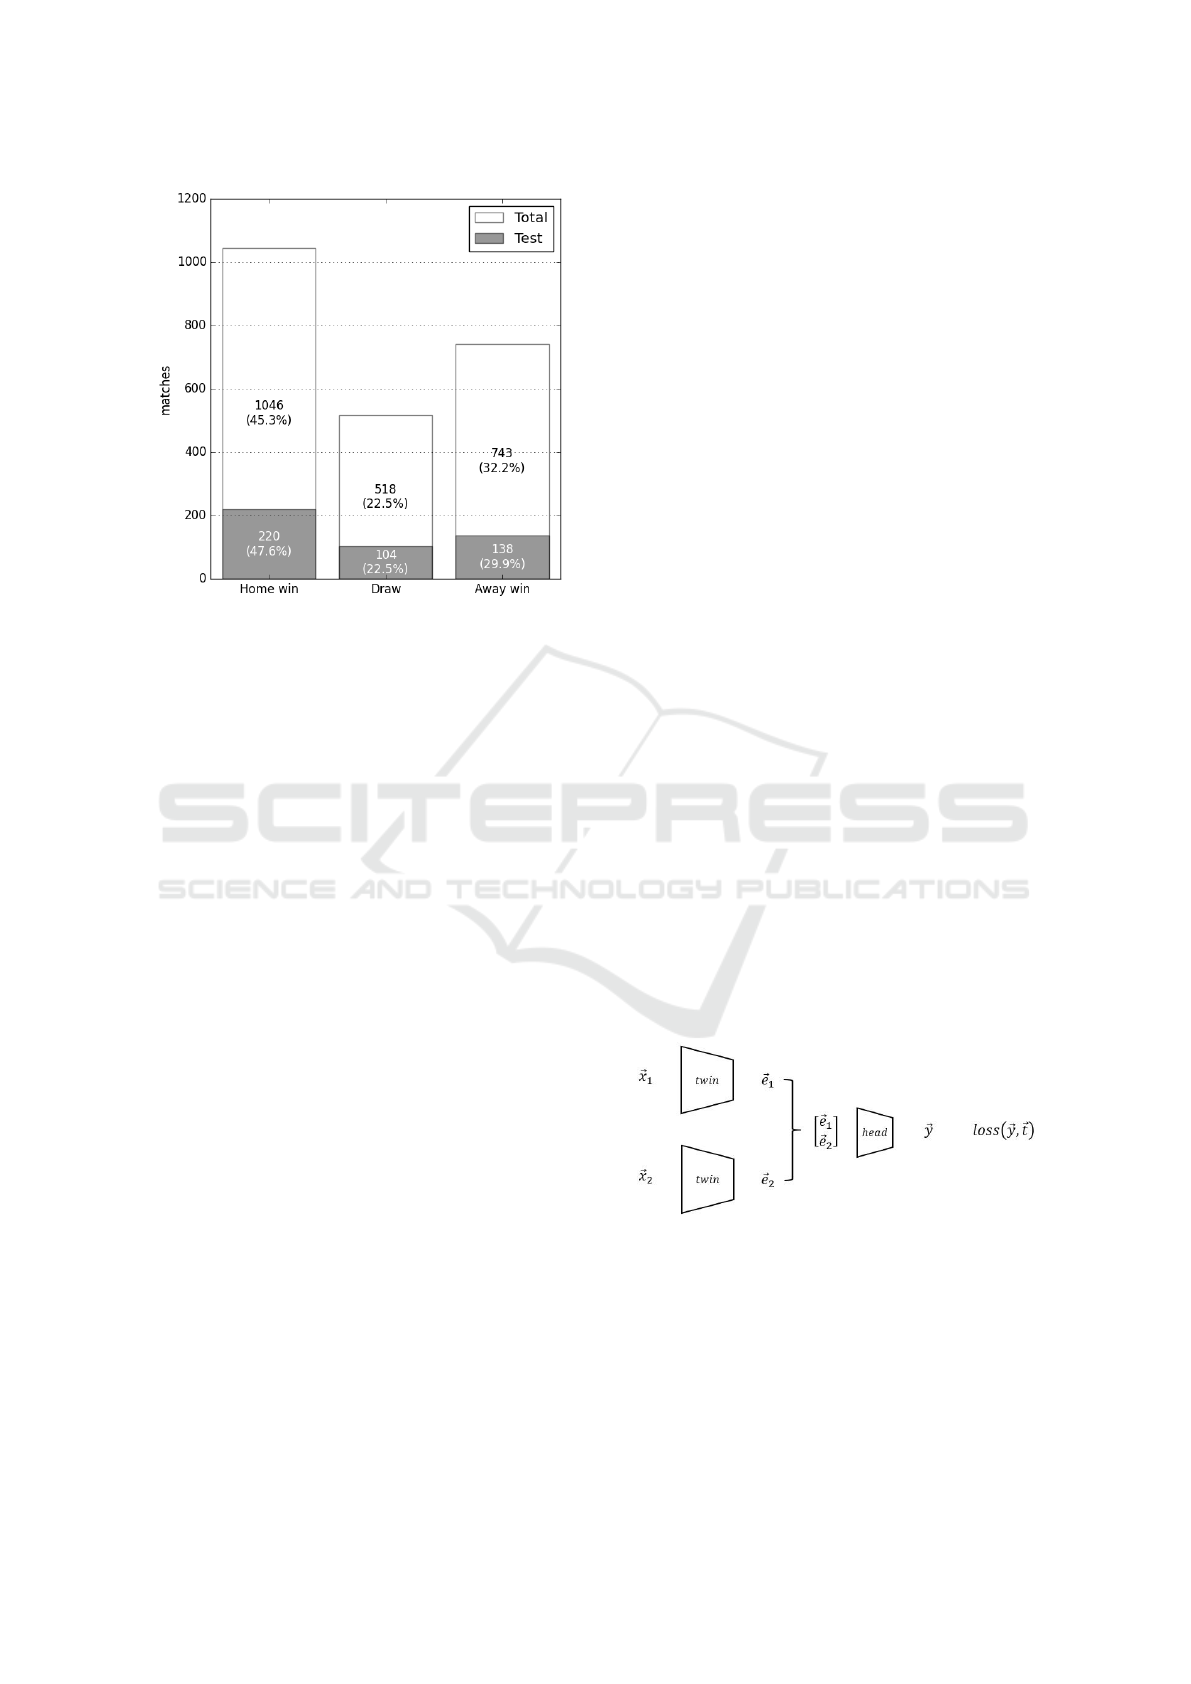
Figure 1: The class distribution among the respective cate-
gories. The Total bars include the whole set of data taken
into consideration in the research, while the Test stand for
the 20% validation split. The percentages on the bars relate
to the share of each label in each dataset.
other algorithms. Next, Multilayer Perceptron, Re-
current Neural Network, and Siamese networks were
trained on the same data.
4.1 Predictive Models
4.1.1 Baseline Classifiers
To determine the baseline for the proposed solution
seven different classifiers were considered: Random
Forest, Gaussian Na
¨
ıve Bayes, Support Vector Ma-
chine, Decision Tree, K-Nearest Neighbours, and
XGBoost. Those are most commonly used classifiers
for predicting match outcomes in the literature.
4.1.2 Multilayer Perceptron
The Multilayer Perceptron (MLP), a type of artificial
neural network, consists of multiple interconnected
layers of neurons. This structure renders it an asset for
match outcome forecasting algorithms, as it adeptly
tackles complex, non-linear problems. Furthermore,
its inherent ability to discern subtle patterns within
data significantly enhances accuracy. In particular,
its capacity to juxtapose various variables—such as
those related to teams’ performance—plays a pivotal
role in refining prediction precision.
4.1.3 Recurrent Neural Networks
Recurrent Neural Networks (RNNs) play a pivotal
role in numerous machine learning tasks – especially
when processing data sets such as time series. They
are instrumental in predictions that heavily rely on
context from earlier steps. Deplorably, they tend to
quickly forget information once learned. That is why
another approach was used - Long Short-Term Mem-
ory.
Recurrent Neural Networks are particularly suited
for predicting match outcomes due to their ability to
process sequential data and capture temporal depen-
dencies. Historical match data for both teams are fed
into the network, allowing it to analyse trends and
patterns over time. By examining sequences of past
performances, the RNN can identify how each team’s
form evolves, accounting for variables such as re-
cent victories, losses, previous detailed match statis-
tics and changes in the teams strength.
4.1.4 Siamese Neural Networks
Siamese Neural Networks are a special type of neu-
ral network architecture designed to identify semantic
similarities between two inputs by processing them
through two or more identical subnetworks that share
the same weights (Bromley et al., 1993). These net-
works take two (or more) input samples and, for each
of them, output embedding vectors, which are then
compared using a distance metric to determine the de-
gree of similarity. This architecture is particularly ef-
fective in tasks such as face recognition and matching,
where understanding the relationship between pairs of
inputs is crucial.
Because the aim of the classifier is to determine
the outcome of the match as one of the three classes,
this type of task significantly differs from the the clas-
sical use case — the architecture and loss function
have to be adjusted accordingly, so that the output can
be clearly interpreted.
Figure 2: Proposed Siamese Neural Network architecture.
In order to fulfil the desired requirements, the ar-
chitecture shown in the Figure 2 has been proposed.
⃗x
i
, ⃗e
i
are the match input data and their embeddings,
respectively, where i = 1 is home, and i = 2 away
team. The concatenated embeddings are being passed
to a head network which finally predicts the match
result vector ⃗y that is compared against the target
⃗
t
within the loss function.
ICAART 2025 - 17th International Conference on Agents and Artificial Intelligence
792

4.2 Grid Search
Determining optimal aforementioned classifiers hy-
perparameters can be done using various techniques,
starting from manual adjustments based on observed
learning curves, through random search, to evolution-
ary and gradient-based methods. Taking into account
the computational effort required for this research,
as well as knowledge of subsets of hyperparameters
for which the best performance could be expected,
a grid search method has been employed. As each
type of model is trained under specific hyperparame-
ters regime, different subsets for each classifier have
been considered.
Within this stage, not only the hyperparameters
were considered as an object of adjustment, but also
the type of the data structure that was used in the
training. This has been done in order to capture both
the one that contributes to the predictive accuracy the
most, and the potential interdependencies between its
structure, and the models architecture.
4.2.1 Baseline Classifiers
All of the classifiers were evaluated by fine-tuning
their hyperparameters. The optimal configurations
were identified using grid search, ensuring that the
best parameters were selected for each of them. Op-
timisation included a wide range of hyperparameters,
among which there was the number of estimators for
the Random Forest, value of C for SVM, maximum
depth for Decision Trees or gamma hyperparameter
for XgBoost.
4.2.2 Multilayer Perceptron
To guarantee that the optimal hyperparameters were
used, and the best possible performance was achieved
in MLP approach a grid search was conducted to tune
the following parameters: batch size, model activa-
tion function, rate of the dropout layer, and optimizer.
It was found that the smaller the batch size was the
better was the prediction accuracy, and that the rate
of the dropout layer needed to be relatively high to
achieve the best results.
4.2.3 Recurrent Neural Networks
In an effort to identify the optimal setup of the dataset,
features, and hyperparameters in RNN, various con-
figurations were tested. The grid search of hyper-
parameters included variables such as the number of
neurons, batch size, model activation function, model
optimizer, and the rate of dropout layers.
4.2.4 Siamese Neural Networks
The optimal hyperparameters search in case of
Siamese Neural Network is focused not only on the
basic ones, like batch size or learning rate, but also
on extensive search of the architecture that would suit
the match outcome prediction task.
As the typical use case of this model is determin-
ing the degree of similarity, it has been first tested in
this classical setup, i.e. with one output neuron. For
this task, the Mean Squared Error (MSE, eq. 1) loss
function has been applied, and a tanh activation func-
tion. The labels for away win, draw, and home win
has been set as −1, 0, and 1, respectively. Next, the
model has been trained for a regression task, where
the output was being discretised to one of the three
labels.
MSE(
⃗
t,⃗y) =
1
n
n
∑
i=1
(t
i
− y
i
)
2
(1)
However, because task itself is about predicting
one of the three classes, the second setup considered
three output neurons, contrastively to the standard
Siamese network architecture. These three neurons,
followed by so f tmax activation function, can be now
exploited by using Categorical Cross Entropy (CCE,
eq. 2) loss function.
CCE(⃗y,
⃗
t) = −
n
∑
i=1
C
∑
c=1
t
i,c
log(y
i,c
) (2)
As a result, according to Table 1, an architecture
with one hidden layer in the twin subnetworks and
one in the head network has been chosen. Moreover,
the highest accuracy has been achieved on the test
dataset with the use of CCE loss. This is a setting
that corresponds to three output neurons and one-hot
labels encoding.
5 RESULTS
5.1 Baseline Classifiers
The highest accuracy achieved by the Random Forest
classifier was 55.01%. Nonetheless, it lacked balance,
particularly in predicting draws, which were often
predicted with the 0.00% accuracy. It was only when
the HomeAwayForm-3 dataset with an 80/20 train-test
split was utilized that Random Forest emerged as one
of the more balanced out classifiers while maintaining
a substantial overall accuracy of 54.48%.
Similarly, the XGBoost classifier achieved its
highest accuracy of 55.10% on the HomeAwayForm-3
Time Series and Deep Learning Approaches for Predicting English Premier League Match Outcomes
793

Table 1: Chosen hyperparameters subset for grid search.
parameter subset optimal
batch size {16,64, 128} 128
learning rate
{10
−3
, 3 · 10
−4
,
10
−4
, 3 · 10
−5
}
10
−4
twin
hidden layers
{64,
128,
64-64,
128-64,
128-128-64}
128
head
hidden layers
{none,
64,
128,
64-32,
128-64}
64
loss function {MSE, CCE} CCE
dataset. As expected, general performance improved
with more training data, as seen in the result on the
test is last split. Nevertheless, draw prediction re-
mained unsatisfactorily low at 0.00%.
Interestingly, this pattern was not observed with
the Gaussian Na
¨
ıve Bayes classifier, a probabilis-
tic model. Its accuracy remained relatively sta-
ble across all datasets. The highest overall accu-
racy was achieved with the HomeAwayForm-3 dataset
and the test is last split. Notably, the draw pre-
diction accuracy for this model was consistent be-
tween both data splits, reaching approximately 15%
for the HomeAwayForm-3 dataset and 25% for the
MatchForm-5 dataset.
The Support Vector Machine (SVM) with an RBF
kernel and Decision Tree classifiers were much more
sensitive to the way the training/testing split was
conducted. Both classifiers performed well on the
MatchForm-5 dataset but saw a substantial drop in
accuracy when using the HomeAwayForm-3 dataset
with an 80 20 split. Nevertheless, on the latter
dataset, the achieved accuracy was among the most
balanced across all classifiers, but the draw prediction
plummeted to 0.00% on the former dataset. Visualiz-
ing the decision tree structure using Graphviz and the
plot tree function provided insight into the models’
mechanics but did not resolve the issue of low draw
accuracy on the HomeAwayForm-3 with test is last
split.
After tuning hyperparameters for the K-Nearest
Neighbours (K-NN) and Bagging classifiers, with the
former optimizing the number of neighbours and the
latter adjusting the number of estimators, both classi-
fiers reached a high accuracy. Notably, the Bagging
classifier, using the Decision Tree as its base estima-
tor, outperformed - in therms of accuracy - all classi-
fiers, including the Decision Tree itself.
5.2 Multilayer Perceptron
Inasmuch as the baseline classifiers performed rea-
sonably well, the introduction of the Multilayer Per-
ceptron (MLP) classifier led to further improve-
ments. The best performance was observed on
the MatchForm-5 dataset using the test is last split,
achieving an overall accuracy of 57.45%. This con-
figuration was particularly notable for generating the
most balanced predictions, with the draw predic-
tion accuracy reaching 15.27%. Similarly, in the
MatchForm-3 dataset, it was the split with more train-
ing data that had better overall accuracy, albeit with
the worse draw predictive performance.
5.3 Recurrent Neural Networks
The evaluation of the accuracies of Recurrent Neu-
ral Networks in both datasets and splits showed
lower sensitivity to the different dataset configura-
tions. The overall accuracies achieved on each of
the two datasets was approximately 56%. The most
profound difference found was in the accuracy of
draw prediction. Specifically, in the MatchForm-
5 dataset (Table 5), the aforementioned accuracy
reached a notable 22.22%, whereas in both splits of
the HomeAwayForm-3 dataset (Table 2 and Table 3),
it was significantly lower, at 0.00%.
5.4 Siamese Neural Networks
While the overall results for deep learning methods
yield the highest accuracies, Siamese Neural Network
consistently outperforms other models, demonstrat-
ing the best results across prepared datasets and their
validation splits. It is particularly evident in the splits
of MatchForm-5 dataset (Table 4 and Table 5).
However, the problem present in other models, i.e.
accuracy of draw prediction, is a case of this solution
as well. Despite the best overall results - shown in Ta-
ble 5, it has the lowest score in this metric. Addition-
ally, the overall accuracy (Table 2) indicate minimal
difference between the Siamese network and a simple
Multilayer Perceptron. However, a closer examina-
tion of the class-wise accuracy reveals the Siamese
network’s tendency to alleviate the problem by ignor-
ing prediction of draw outcomes.
The model presents better performance than the
others inasmuch as it developed a strategy of focusing
on the prediction of the winner of the match. Conse-
quently, this outcome proves that, given task-specific
adjustments in the default architecture, the approach
can be applied to problems whose ultimate goal does
not necessarily focus on determining similarity.
ICAART 2025 - 17th International Conference on Agents and Artificial Intelligence
794

Table 2: Accuracies achieved on HomeAwayForm-3 80 20.
Classifier Overall accuracy Home win accuracy Draw accuracy Away win accuracy
Random Forest 54.48% 73.33% 7.76% 59.38%
Gaussian Na
¨
ıve Bayes 51.12% 67.14% 14.56% 54.13%
Support Vector Machines 48.20% 56.19% 23.31% 54.88%
Decision Tree 43.94% 50.47% 30.09% 44.36%
K-Nearest Neighbours 50.22% 75.71% 7.76% 42.85%
Bagging 50.67% 68.57% 9.71% 54.13%
XGBoost 52.92% 77.62% 5.82% 50.37%
Multilayer Perceptron 56.50% 80.95% 7.76% 48.12%
Recurrent Neural Network 56.05% 71.42% 0.00% 61.65%
Siamese Neural Network 56.50% 88.57% 0.00% 49.62%
Table 3: Accuracies achieved on dataset HomeAwayForm-3 test is last.
Classifier Overall accuracy Home win accuracy Draw accuracy Away win accuracy
RandomForest 54.14% 83.56% 0.00% 48.98%
Gaussian Na
¨
ıve Bayes 53.82% 73.29% 15.71% 52.04%
Support Vector Machines 54.46% 74.66% 5.71% 59.18%
Decision Tree 49.04% 47.95% 0.00% 85.71%
K-Nearest Neighbours 51.59% 80.14% 1.43% 44.9%
Bagging 54.78% 82.19% 1.43% 52.04%
XGBoost 55.1% 80.82% 0.00% 56.12%
Multilayer Perceptron 56.69% 78.76% 0.00% 51.02%
Recurrent Neural Network 56.69% 64.38% 0.00% 71.42%
Siamese Neural Network 57.96% 81.51% 0.00% 64.28%
Table 4: Accuracies achieved on dataset MatchForm-5 80 20.
Classifier Overall accuracy Home win accuracy Draw accuracy Away win accuracy
Random Forest 53.67% 73.18% 0.00% 63.04%
Gaussian Na
¨
ıve Bayes 49.56% 55.45% 25.96% 57.97%
Support Vector Machines 53.24% 68.63% 3.84% 65.94%
Decision Tree 53.03% 86.81% 0.00% 39.13%
K-Nearest Neighbours 50.86% 70.00% 2.88% 56.52%
Bagging 54.54% 78.63% 0.96% 56.52%
XGBoost 52.59% 68.63% 8.65% 60.14%
Multilayer Perceptron 56.71% 67.27% 2.28% 50.43%
Recurrent Neural Network 56.28% 75.45% 6.73% 49.27%
Siamese Neural Network 57.58% 85.38% 0.00% 61.59%
Table 5: Accuracies achieved on dataset MatchForm-5 test is last.
Classifier Overall accuracy Home win accuracy Draw accuracy Away win accuracy
Random Forest 55.01% 81.16% 0.00% 54.36%
Gaussian Na
¨
ıve Bayes 50.45% 57.79% 25.0% 57.28%
Support Vector Machines 55.62% 71.42% 4.16% 67.96%
Decision Tree 52.88% 87.01% 0.00% 38.83%
K-Nearest Neighbours 54.40% 75.32% 4.16% 58.25%
Bagging 56.53% 81.81% 2.77% 56.31%
XGBoost 53.49% 73.37% 9.72% 54.36%
Multilayer Perceptron 57.45% 55.84% 15.27% 56.31%
Recurrent Neural Network 56.53% 56.49% 22.22% 48.02%
Siamese Neural Network 58.97% 84.42% 0.00% 62.14%
6 CONCLUSIONS
In the paper, the method for predicting football match
outcomes based on Siamese Neural Network archi-
tecture was presented. The proposed method lever-
ages the ability of Siamese networks to compare the
performance of two teams by processing their recent
performance data through two identical subnetworks.
This approach allows the model to capture similari-
ties and differences in the teams’ trends leading up
to the match. The inputs of the network are detailed
statistics from the previous matches of the analysed
Time Series and Deep Learning Approaches for Predicting English Premier League Match Outcomes
795

teams. That way the network can more effectively un-
derstand the trend in team performance, which leads
to better match outcome predictions. In contrast to
the classic Siamese network architecture, the output
of the proposed architecture consists of three neurons,
corresponding to the possible match outcomes.
The proposed algorithm was compared with clas-
sifiers commonly used for match outcome predic-
tion in the literature. For this purpose, seven classi-
fiers (Random Forest, Gaussian Na
¨
ıve Bayes, Support
Vector Machine, Decision Tree, k-Nearest Neigh-
bours, and XGBoost) were selected and trained, in-
cluding the optimization of their parameters. To fur-
ther investigate the results of the proposed algorithm,
two additional approaches based on deep neural net-
works were examined: Multilayer Perceptron and Re-
current Neural Network. All methods were trained
and tested on two prepared datasets: MatchForm-5
and HomeAwayForm-3 with the same division into
training and test sets.
The obtained results demonstrate that approaches
based on deep neural networks outperform traditional
classifiers for each of the datasets analysed. The per-
formance of MLP and RNN was by at least 2% better
than the best of the classical classifiers. The proposed
architecture of Siamese Neural Networks achieved re-
sults up to 59.00% in overall match prediction accu-
racy, which are better than those obtained by MLP
and RNN. This indicates that Siamese networks, with
their ability to effectively capture the comparative dy-
namics between teams, offer a promising approach for
improving match outcome prediction.
The greatest challenge in predicting football
match outcomes is forecasting a draw. This situa-
tion is reflected in the results obtained by the analysed
methods. Approaches based on deep neural networks
are characterized by greater overall accuracy, but ac-
curacy in predicting draws is very low.
This work contributes to the field of football
match outcome prediction by introducing a method
based on the modified Siamese Neural Network archi-
tecture and times series approach. Future work may
include incorporating Recurrent Neural Networks or
Long Short-Term Memory units into the Siamese
Neural Network architecture to better capture tempo-
ral dependencies and enhance the model’s ability to
analyse the patterns of team performance over time.
This integration could potentially improve prediction
accuracy by allowing the model to consider both the
historical context and the evolving dynamics of the
teams involved.
ACKNOWLEDGEMENTS
This work was financed by the Lodz University of
Technology, Faculty of Electrical, Electronic, Com-
puter and Control Engineering as a part of statutory
activity (project no. 501/2-24-1-1).
REFERENCES
Baboota, R. and Kaur, H. (2019). Predictive analysis and
modelling football results using machine learning ap-
proach for english premier league. International Jour-
nal of Forecasting, 35(2):741–755.
Bromley, J., Guyon, I., LeCun, Y., S
¨
ackinger, E., and Shah,
R. (1993). Signature verification using a ”siamese”
time delay neural network. Advances in neural infor-
mation processing systems, 6.
Bunker, R. and Susnjak, T. (2022). The application of ma-
chine learning techniques for predicting match results
in team sport: A review. Journal of Artificial Intelli-
gence Research, 73:1285–1322.
Daniel Harraghy (2024). How the Premier League’s
global popularity is driving its revenue growth.
https://www.sportspromedia.com/insights/opinions/
premier-league-tv-rights-revenue-global-popularity-
sponsorship-data-ampere/. Online; accessed 22
October 2024.
Elo, A. E. (1961). New uscf rating system. Chess life,
16:160–161.
Huang, K.-Y. and Chang, W.-L. (2010). A neural net-
work method for prediction of 2006 world cup foot-
ball game. In The 2010 International Joint Conference
on Neural Networks (IJCNN), pages 1–8.
Jain, S., Tiwari, E., and Sardar, P. (2021). Soccer result
prediction using deep learning and neural networks.
In Intelligent Data Communication Technologies and
Internet of Things: Proceedings of ICICI 2020, pages
697–707. Springer.
Muszaidi, M., Mustapha, A. B., Ismail, S., and Razali, N.
(2022). Deep learning approach for football match
classification of english premier league (epl) based on
full-time results. In Proceedings of the 7th Interna-
tional Conference on the Applications of Science and
Mathematics 2021: Sciemathic 2021, pages 339–350.
Springer.
Reep, C. and Benjamin, B. (1968). Skill and chance in as-
sociation football. Journal of the Royal Statistical So-
ciety. Series A (General), 131(4):581–585.
ICAART 2025 - 17th International Conference on Agents and Artificial Intelligence
796
