Optimizing Blood Transfusions and Predicting Shortages in
Resource-Constrained Areas
El Arbi Belfarsi
a
, Sophie Brubaker
b
and Maria Valero
c
Kennesaw State University, 1100 South Marietta Pkwy SE, Marietta, GA 30060, U.S.A.
Keywords:
Artificial Intelligence, Machine Learning, Heuristic Search, Constrained Optimization, NoSQL Databases,
Blood Donation Systems, Healthcare Logistics, Public Health.
Abstract:
Our research addresses the critical challenge of managing blood transfusions and optimizing allocation in
resource-constrained regions. We present heuristic matching algorithms for donor-patient and blood bank se-
lection, alongside machine learning methods to analyze blood transfusion acceptance data and predict potential
shortages. We developed simulations to optimize blood bank operations, progressing from random allocation
to a system incorporating proximity-based selection, blood type compatibility, expiration prioritization, and
rarity scores. Moving from blind matching to a heuristic-based approach yielded a 28.6% marginal improve-
ment in blood request acceptance, while a multi-level heuristic matching resulted in a 47.6% improvement.
For shortage prediction, we compared Long Short-Term Memory (LSTM) networks, Linear Regression, and
AutoRegressive Integrated Moving Average (ARIMA) models, trained on 170 days of historical data. Linear
Regression slightly outperformed others with a 1.40% average absolute percentage difference in predictions.
Our solution leverages a Cassandra NoSQL database, integrating heuristic optimization and shortage pre-
diction to proactively manage blood resources. This scalable approach, designed for resource-constrained
environments, considers factors such as proximity, blood type compatibility, inventory expiration, and rarity.
Future developments will incorporate real-world data and additional variables to improve prediction accuracy
and optimization performance.
1 INTRODUCTION
Blood reserve shortages represent a critical challenge
for healthcare systems worldwide, particularly in low-
income and disaster-prone areas. The World Health
Organization (WHO) recommends that 1% to 3% of
a country’s population should donate blood to meet its
basic healthcare needs (Talie et al., 2020). This guid-
ance emphasizes the importance of regular and vol-
untary blood donations to ensure a consistent and ade-
quate blood supply. However, numerous countries fall
well below this threshold, creating tremendous strain
on their healthcare systems (Kralievits et al., 2015;
Barnes et al., 2022; Roberts et al., 2019).
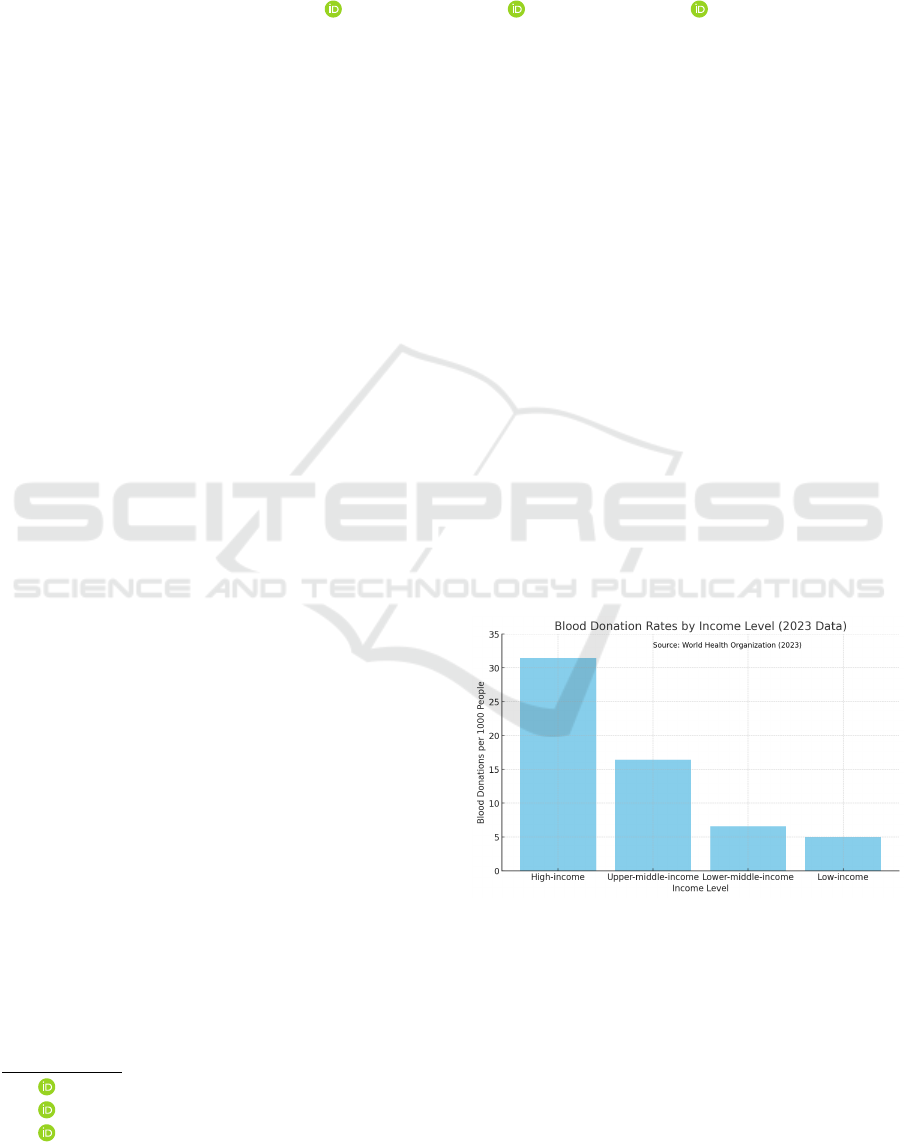
Figure 1 illustrates the significant disparity in
blood donation rates across countries of different in-
come levels. According to the WHO report from
June 2023, these rates vary substantially based on
a country’s economic status (World Health Organi-
a
https://orcid.org/0009-0006-4145-5492
b
https://orcid.org/0009-0000-3708-9000
c
https://orcid.org/0000-0001-8913-9604
Figure 1: Blood donation rates per 1000 people by country
income level (World Health Organization, 2023).
zation, 2023). The data, collected from samples of
1000 people, reveals a clear descending trend from
high- to low-income countries. High-income coun-
tries lead with 31.5 donations, followed by upper-
middle-income countries with 16.4 donations, lower-
middle-income countries with 6.6 donations, and fi-
nally, low-income countries with the lowest rate of
Belfarsi, E. A., Brubaker, S. and Valero, M.
Optimizing Blood Transfusions and Predicting Shortages in Resource-Constrained Areas.
DOI: 10.5220/0013182700003911
Paper published under CC license (CC BY-NC-ND 4.0)
In Proceedings of the 18th International Joint Conference on Biomedical Engineering Systems and Technologies (BIOSTEC 2025) - Volume 2: HEALTHINF, pages 149-160
ISBN: 978-989-758-731-3; ISSN: 2184-4305
Proceedings Copyright © 2025 by SCITEPRESS – Science and Technology Publications, Lda.
149

5.0 donations.
These statistics underscore the disparities in blood
donation rates across global economic divides. In
low-income countries, the rate is as low as 5.0 dona-
tions per 1,000 people, which falls dramatically short
of the World Health Organization’s median recom-
mendation of 10–20 donations per 1,000 people to
meet essential healthcare needs. This gap of approxi-
mately 67% below the recommended levels highlights
the severe challenges these countries face in maintain-
ing adequate blood supplies. Such shortages strain
healthcare systems, especially in responding to medi-
cal emergencies and routine transfusion requirements,
ultimately compromising patient care and increasing
mortality risks (Raykar et al., 2015).
Another critical factor to consider is the height-
ened occurrence of blood shortages in areas affected
by natural disasters or conflict, where the demand for
blood can spike unpredictably, overwhelming already
overburdened healthcare systems. For example, the
COVID-19 pandemic caused significant disruptions
to global blood donations due to lockdowns, fear of
infection, and limited access to blood collection sites.
This led to severe blood shortages in countries like the
United States, resulting in postponed surgeries and
delayed transfusions, which had a serious impact on
patient care (Riley et al., 2021). Similarly, during the
Delta variant surge, the blood supply was critically
low, necessitating rapid inventory management to en-
sure continuity of clinical care (Petersen and Jhala,
2023). These crises highlight the need for robust, eas-
ily deployable systems that can optimize blood trans-
actions and predict shortages in resource-constrained
environments to mitigate the impacts of sudden de-
mand surges (Van Denakker et al., 2023).
Moreover, in many low- and middle-income coun-
tries, blood donation systems heavily depend on fam-
ily or replacement donors, with patients or their fam-
ilies often responsible for transferring blood between
centers. For instance, in regions such as Africa and
Latin America, families frequently coordinate blood
donations and transport due to inadequate centralized
systems (World Health Organization, 2022). Greece,
where family donations are vital for conditions like
thalassemia, also exemplifies how families play a cru-
cial role in managing blood transfers (American So-
ciety of Hematology, 2020).
Given these challenges, there is a pressing need
for innovative strategies to optimize blood supply
management and accurately predict shortages, par-
ticularly in resource-limited areas. The WHO advo-
cates for a transition to 100% voluntary, unpaid dona-
tions as a critical step towards establishing sustainable
blood supplies in these regions. However, achieving
this objective requires more than policy reforms—it
calls for the creation of scalable, reliable systems
capable of functioning effectively even under high-
pressure conditions and resource constraints (Laer-
mans et al., 2022).
This paper introduces a novel approach that ap-
plies heuristic methods and machine learning tech-
niques independently to optimize blood transactions
and predict shortages in resource-constrained areas.
Our system leverages the power of data-driven predic-
tive modeling along with domain-specific heuristics
to create a more efficient and effective blood supply
management solution.
Key features of our proposed system include:
• Heuristic approaches: These approaches include
the utilization of blood compatibility matrices to
maximize the utility of available blood supplies,
the implementation of a rarity score for each
blood group to prioritize scarce resources, consid-
eration of blood product expiration dates to mini-
mize wastage, and optimization of travel distances
to improve logistics and reduce costs.
• Machine learning components: The machine
learning components involve predictive models to
forecast a center’s request acceptance rate over a
10-day period and data-driven algorithms to opti-
mize the direction of blood donations.
• Integration of heuristics and machine learning:
A combined approach leverages the strengths of
both methodologies, employing goal-oriented op-
timization to maximize the percentage of accepted
blood requests.
This system is designed to tackle the significant
disparities in blood donation and distribution, with a
specific emphasis on low-income countries, conflict-
affected areas, and regions vulnerable to natural dis-
asters. Our solution aims to offer a scalable frame-
work that can enhance blood supply management in
these high-need regions, addressing the complex fac-
tors that affect blood donation, storage, and distribu-
tion.
2 BACKGROUND
2.1 Blood Type Distribution and
Compatibility
Understanding the distribution of blood types in a
population and their compatibility is crucial for op-
timizing blood donation and distribution strategies.
This section provides an overview of typical blood
type distribution and compatibility.
HEALTHINF 2025 - 18th International Conference on Health Informatics
150
2.1.1 Blood Type Distribution
The distribution of ABO blood types can vary across
different populations. Table 1 presents a typical dis-
tribution based on data from a large sample:
Table 1: ABO blood types distribution.
Blood Type Abundance
A 33.4%
B 6%
O 56.8%
AB 3.8%
This distribution shows that Types A and O are
the most common, followed closely by Type B, while
Type AB is the least common. These percentages can
inform predictions about blood supply and demand in
a given population (Sarhan et al., 2009).
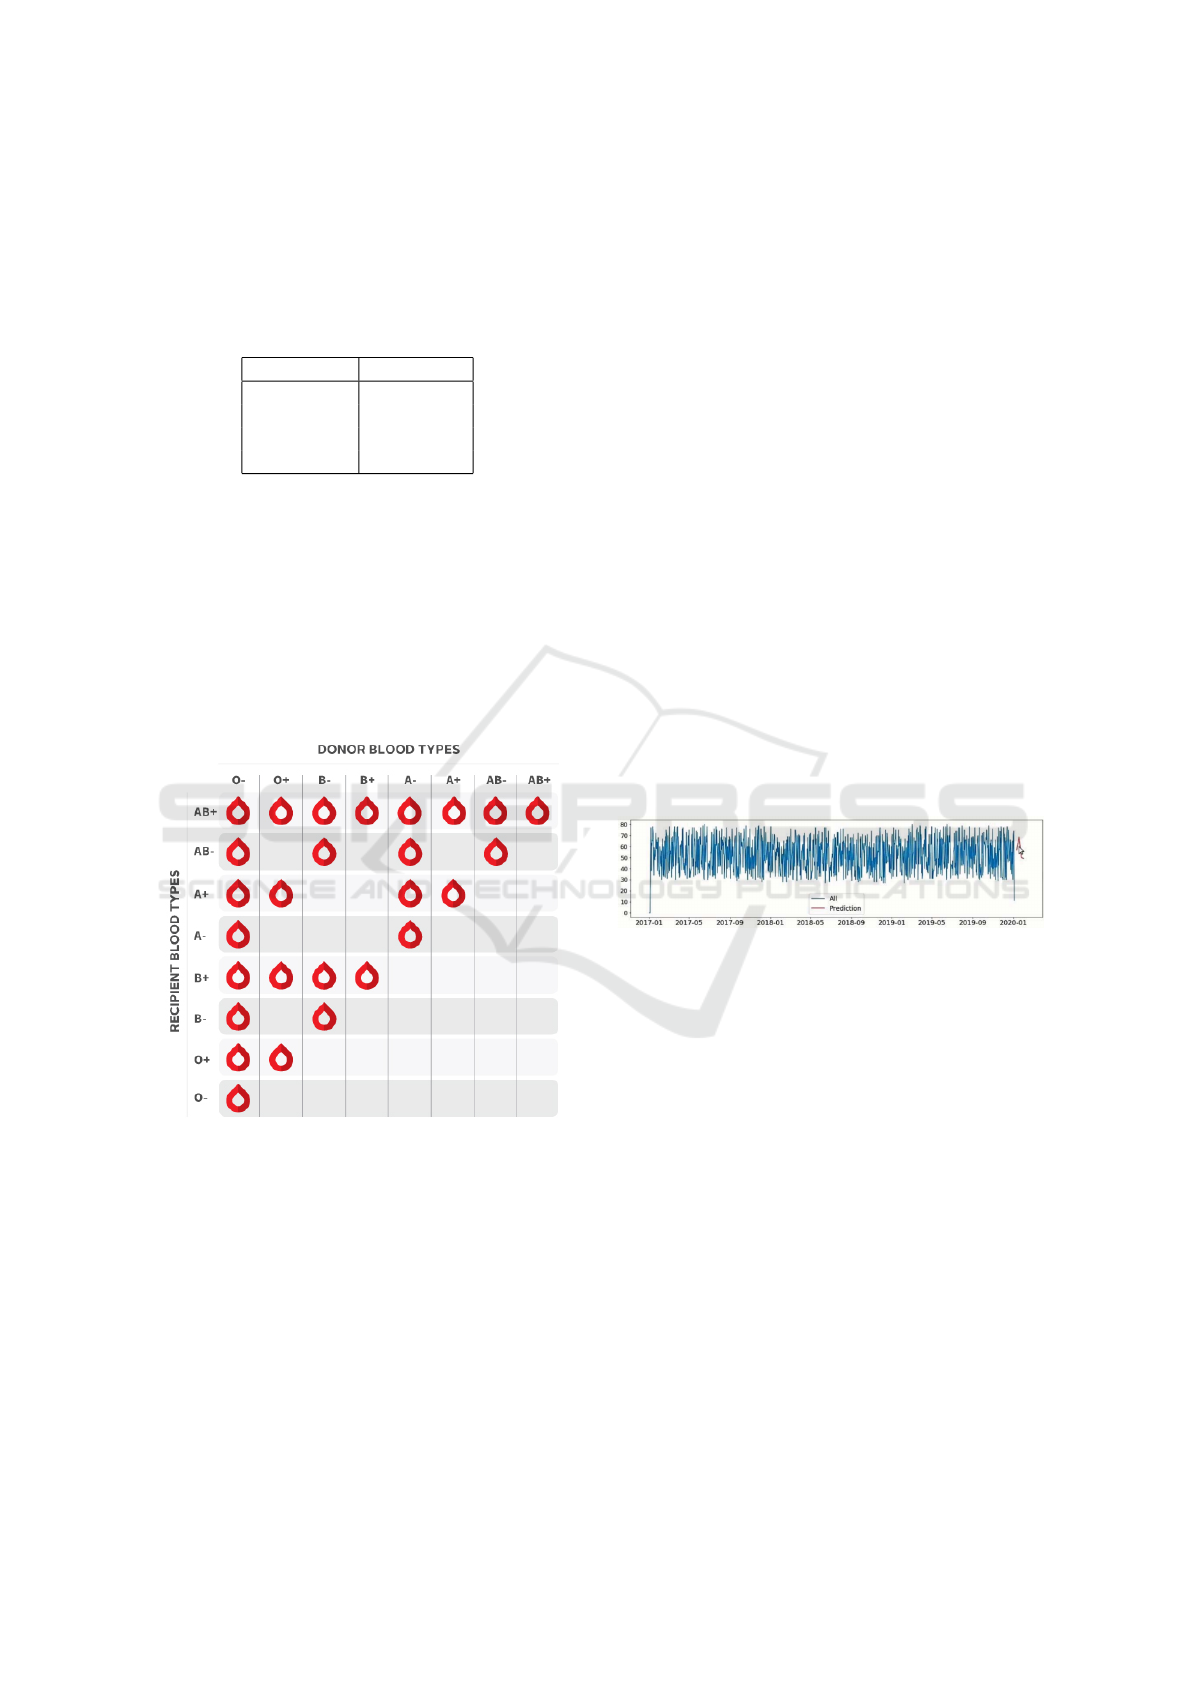
2.1.2 Blood Type Compatibility
Blood type compatibility is a critical factor in transfu-
sions and donation strategies. Figure 2 illustrates the
compatibility matrix between different blood types.
Figure 2: Blood type compatibility matrix (BCS, 2022).
The compatibility matrix illustrates the safe blood
donation and transfusion pathways between different
blood types. Key insights include the following:
• Type O is the universal donor, able to give blood
to all other types.
• Type AB is the universal recipient, able to receive
blood from all other types.
• Types A and B can donate to their own type and
to AB.
The blood type distribution data and compatibility
matrix are integral to our methodology. We use this
information to simulate realistic donor populations
and blood transaction scenarios. Moreover, the com-
patibility matrix informs our heuristic search algo-
rithm, enabling efficient matching of blood requests
with available inventory. Additionally, we assign rar-
ity scores to each blood group based on this data,
which plays a key role in optimizing the allocation
process.
3 RELATED WORK
3.1 Blood Bank Management Systems
Recent advancements in blood bank management
have increasingly focused on leveraging emerging
technologies to address operational inefficiencies. A
significant contribution by (Sandaruwan et al., 2020)
integrates machine learning, data clustering, and
blockchain technologies. A key innovation is the ap-
plication of Long Short-Term Memory (LSTM) net-
works for blood demand forecasting, which optimizes
inventory management by improving demand predic-
tion accuracy and operational efficiency. Figure 3 il-
lustrates the comparison between actual and predicted
blood demand across all blood types.
Figure 3: Blood demand prediction: actual values versus
predicted values (Sandaruwan et al., 2020).
Their system was validated using empirical data
from the Blood Bank of Sri Lanka, with results indi-
cating a strong potential for accurately forecasting fu-
ture blood demand. The incorporation of blockchain
technology enhances the system by introducing an ad-
ditional layer of security, ensuring the integrity, trace-
ability, and transparency of the blood supply chain.
Several critical points warrant consideration re-
garding the methodology and experimental design of
this study: 1) the authors employed a highly imbal-
anced data split (98.2% for training and 0.2% for test-
ing), which may raise concerns about the possibility
of overfitting and could affect the reliability of the re-
ported performance metrics; and 2) while the LSTM
approach is promising, the study does not provide a
comparison with other time series models, making it
difficult to fully evaluate the relative effectiveness of
this method in the context of blood demand forecast-
ing (Sandaruwan et al., 2020).
Optimizing Blood Transfusions and Predicting Shortages in Resource-Constrained Areas
151

Beyond Sandaruwan’s work, (Ben Elmir et al.,
2023) proposed a smart platform that uses machine
learning and time series forecasting models to reduce
blood shortages and waste by balancing blood col-
lection and distribution. Their approach achieved an
11% increase in collected blood volume and a 20%
reduction in inventory wastage compared to histori-
cal data. Moreover, (Shih and Rajendran, 2019) com-
pared machine learning algorithms and traditional
time series methods like ARIMA for forecasting
blood supply in Taiwan’s blood services. Their results
showed that time series methods, particularly sea-
sonal ARIMA, outperformed machine learning mod-
els in predicting blood demand with better accuracy
and lower error rates.
Recent studies also explore blockchain applica-
tions in blood bank management. (Wijayathilaka
et al., 2020) developed the “LifeShare” platform, in-
corporating blockchain technology for secure, trans-
parent tracking of donors and blood supply, coupled
with machine learning algorithms for blood demand
forecasting.
Despite these advancements, challenges remain.
For example, (Farrington et al., 2023) applied deep
reinforcement learning (DRL) to optimize platelet
inventory management. Their results demonstrated
DRL’s effectiveness in reducing wastage while ensur-
ing sufficient supply for hospitals, offering a promis-
ing avenue for future research in optimizing other
blood components.
These studies provide a robust foundation for
further research, particularly in combining machine
learning models with blockchain technologies to en-
hance the security, accuracy, and efficiency of blood
bank operations.
Our work builds upon this concept by:
• Employing a more rigorous model evaluation and
benchmarking methodology to enhance the relia-
bility of results.
• Integrating heuristic optimization techniques that
account for blood type compatibility, rarity
scores, and logistical factors such as distance trav-
eled, in order to improve the blood transfusion ac-
ceptance rate.
• Extending predictive capabilities to forecast a
center’s request acceptance rate over a 10-day
horizon.
• Developing an open-source platform capable of
adapting to real-time fluctuations in blood supply
and demand, facilitating collaboration and seam-
less deployment.
These improvements aim to deliver a more com-
prehensive and practical solution to the challenges
of blood bank management, especially in resource-
limited environments.
4 METHODOLOGY
4.1 Database Schema
To optimize data management and storage within
our blood bank management system, we employed
a Cassandra NoSQL database. The schema design
was carefully structured to represent the key entities
and relationships within the system, enabling efficient
data retrieval and manipulation to support our simula-
tions and predictive models.
Figure 4: Cassandra database schema.
Figure 4 illustrates the database schema, which
consists of four main tables:
1. blood banks: Contains detailed information on
individual blood banks, including contact infor-
mation, geographic location, and relevant opera-
tional data.
2. users: Stores comprehensive data for both donors
and patients, including blood type, contact details,
and associated medical information.
3. blood inventory: Monitors the current inventory
of blood at each bank, tracking quantities, expira-
tion dates, and blood group availability.
4. blood transactions: Logs all blood donation and
request transactions, linking user data, blood bank
operations, and inventory management for a com-
prehensive audit trail.
Our study employed a two-pronged approach to
optimize blood bank management: simulation-based
optimization and shortage prediction modeling.
HEALTHINF 2025 - 18th International Conference on Health Informatics
152

4.2 Simulation-Based Optimization
We developed three progressively advanced simula-
tions to optimize blood bank operations:
1. The initial simulation focused on the fundamental
processes of blood requests and donations. Blood
distribution was performed through random allo-
cation, establishing baseline performance metrics
to serve as a reference for evaluating more ad-
vanced optimization methods.
2. The second simulation incorporated an optimiza-
tion strategy based on geographic proximity, pri-
oritizing blood banks nearest to the point of de-
mand. A blood type compatibility matrix was in-
tegrated, and soon-to-expire blood units were pri-
oritized to reduce wastage and improve resource
utilization efficiency.
3. The final simulation introduced rarity scores for
various blood types to more effectively manage
scarce resources. This simulation balanced prox-
imity, expiration dates, and rarity in its alloca-
tion decisions, while also tracking expired units
to identify areas for further optimization.
Each simulation ran for a 30-day period, process-
ing 40-50 transactions daily. We measured key per-
formance indicators including acceptance ratio, total
distance traveled, and number of expired resources.
4.3 Shortage Prediction Modeling
To forecast potential shortages, we developed and
evaluated three time-series prediction models for
comparative analysis:
1. The first model, linear regression, was imple-
mented as a baseline to capture linear trends in
the acceptance ratios.
2. The second model, Long Short-Term Memory
(LSTM) networks, leveraged deep learning tech-
niques to identify complex temporal patterns. It
was trained on 170 days of historical data to gen-
erate predictive forecasts.
3. Our final model, the Autoregressive Integrated
Moving Average (ARIMA), applied traditional
time-series forecasting techniques, effectively ac-
counting for both trends and seasonality in the
data.
All models were trained to forecast the acceptance
ratio for day 180, using data from the preceding 170
days. Model performance was assessed by calculating
the mean absolute percentage error (MAPE) between
the predicted and actual values.
4.4 Performance Metrics
To evaluate the effectiveness of our optimization
strategies and predictive models, we employed the
following metrics:
1. Acceptance Ratio: Proportion of accepted blood
requests.
2. Total Distance Traveled: Sum of distances for all
transactions.
3. Marginal Performance (MP): Relative improve-
ment in acceptance ratio.
4. Average Absolute Percentage Difference: For as-
sessing prediction accuracy.
This comprehensive methodology enabled itera-
tive improvements in blood bank operations through
simulation, while also facilitating the development of
accurate shortage prediction capabilities.
5 PROPOSED WORK
5.1 Dataset Synthesis and Description
The sensitive nature of healthcare data, coupled with
stringent privacy regulations governing blood dona-
tion records, presented considerable challenges in ob-
taining real-world data for this study. Health Informa-
tion Privacy laws, such as the Health Insurance Porta-
bility and Accountability Act (HIPAA) in the United
States, impose strict controls over the use and dissem-
ination of patient health information, including blood
donation records. Additionally, the cross-institutional
structure of blood supply chains, involving multiple
stakeholders, further complicates the process of com-
prehensive data collection due to logistical and legal
constraints.
To address these limitations while maintaining the
integrity of our analysis, we generated a synthetic
dataset designed to replicate real-world blood bank
operations. This approach enables us to explore a
wide range of scenarios and rigorously test our al-
gorithms, without compromising individual privacy
or breaching data protection regulations. Our dataset
comprises four main components:
1. Blood Banks: A dataset comprising 20 simulated
blood banks, each characterized by unique identi-
fiers, names, geographic locations (represented by
ZIP codes), and associated contact information.
2. Users: A population of 1,000 individuals, catego-
rized as donors, patients, or both. Each user has a
unique identifier, demographic information, blood
type, and ZIP codes.
Optimizing Blood Transfusions and Predicting Shortages in Resource-Constrained Areas
153

3. Blood Inventory: A comprehensive record of
blood components (Red Blood Cells, Whole
Blood, Platelets, and Plasma) available at each
blood bank. Each inventory entry includes details
such as blood type, quantity, expiration date, and
a unique batch identifier.
4. Blood Transactions: 4200 logs of donation events,
linking donors to specific inventory batches. Each
transaction includes information on the donor, re-
cipient blood bank, blood component, quantity,
and date of donation.
To generate realistic user data, we employed the
Faker library in Python (Jokiaho and community con-
tributors, 2023), which offers a comprehensive set of
methods for creating plausible synthetic data, such
as names, addresses, phone numbers, and email ad-
dresses. Utilizing the Faker library allowed us to en-
sure that our synthetic dataset closely replicates real-
world data while preserving anonymity and adhering
to privacy standards.
A key aspect of our dataset is the distribution of
blood types, which we based on global averages. Ta-
ble 2 shows the blood type distribution used in our
simulation:
Table 2: Blood type distribution in synthetic dataset.
Blood Type Probability
O+ 0.38
A+ 0.34
B+ 0.09
O- 0.07
A- 0.06
AB+ 0.03
B- 0.02
AB- 0.01
Other key features of our dataset include the fol-
lowing: 1) Varied expiration dates for different blood
components, accurately reflecting real-world storage
constraints. 2) Simulated geographical distribution of
blood banks and users, represented using ZIP codes
to mimic real-world spatial dispersion. 3) Consistent
linkage between inventory and donation transactions
through unique batch identifiers, ensuring traceability
and integrity of the data.
This synthetic dataset allows us to evaluate and
validate our optimization algorithms under a range of
scenarios, including rare blood type shortages, geo-
graphical constraints, and urgent inventory manage-
ment challenges. While it does not fully capture the
complexities of real-world blood bank operations, it
provides a robust framework for testing and refining
our blood supply chain optimization techniques, serv-
ing as a proof of concept for future development and
more advanced applications.
The synthetic dataset, along with its accompany-
ing schema and documentation, is made available for
use by other researchers to facilitate further explo-
ration and development in the field of blood supply
chain optimization (Belfarsi, 2024).
5.2 System Design
Figure 6 illustrates the high-level architecture of
our blood donation optimization system. At the
core of our design is the Apache Cassandra NoSQL
database (Abramova and Bernardino, 2013), chosen
for its ability to handle large-scale, distributed data
with high availability and partition tolerance.
5.2.1 CAP Theorem and Cassandra
The Consistency, Availability and Partition Tolerance
(CAP) theorem, a fundamental principle in distributed
database systems, states that it is impossible for a
distributed data store to simultaneously provide more
than two out of the following three guarantees:
Figure 5: Visual representation of the CAP Theorem.
As illustrated in Figure 5, the three guarantees are:
• Consistency: Every read receives the most recent
write or an error.
• Availability: Every request receives a response,
without guarantee that it contains the most recent
version of the information.
• Partition tolerance: The system continues to op-
erate despite arbitrary partitioning due to network
failures.
5.2.2 Importance of AP in Blood Donation
Systems
The AP characteristics of Cassandra are vital to our
system for several reasons. High availability is cru-
cial, especially in emergencies, where the system
must remain operational. Cassandra’s multi-master
HEALTHINF 2025 - 18th International Conference on Health Informatics
154
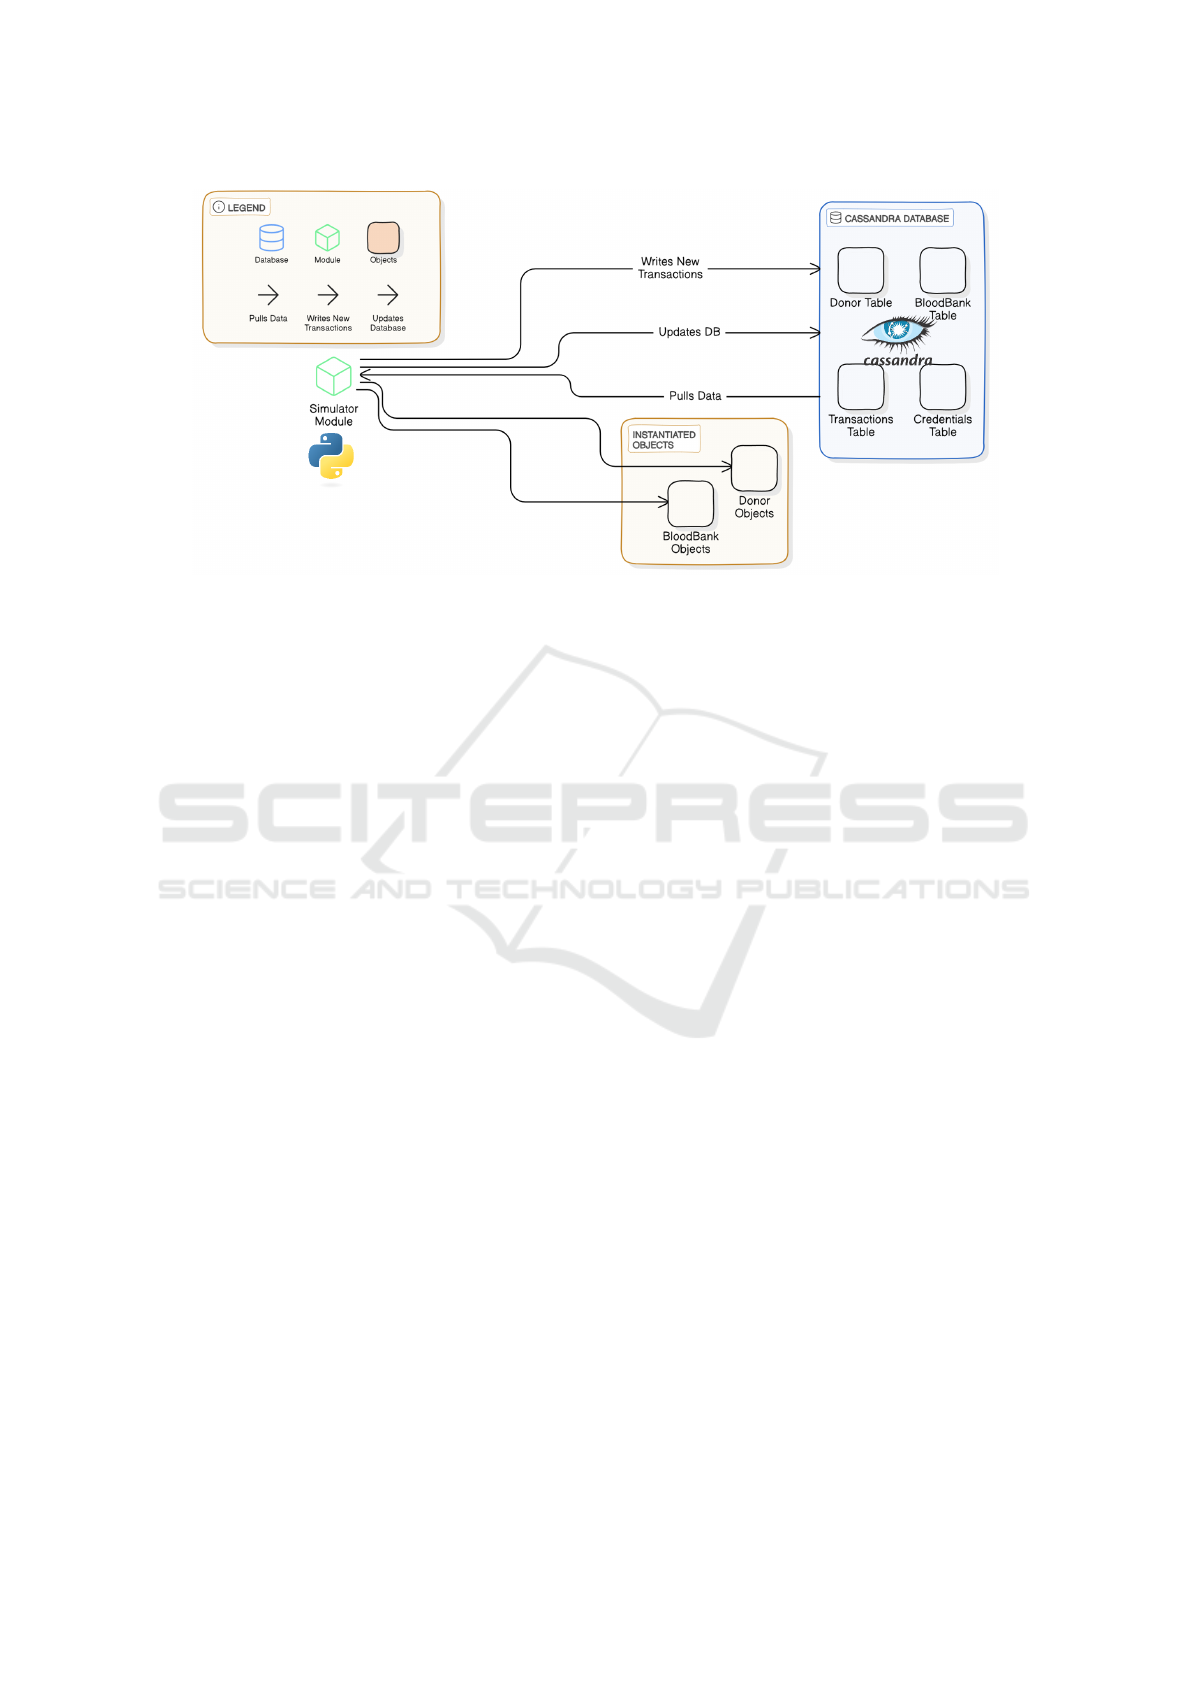
Figure 6: System architecture high-level view.
architecture ensures continued functionality even if
some nodes fail, unlike traditional SQL databases,
which rely on a single master and are vulnerable to
downtime in such cases (Yedilkhan et al., 2023). Scal-
ability is another key factor, as blood donation net-
works span large regions, and Cassandra’s horizon-
tal scaling allows seamless growth—something reg-
ular SQL databases struggle with due to their in-
herent vertical scaling limitations. While we trade
strong consistency for eventual consistency, it suits
most scenarios, and tunable consistency levels offer
flexibility when needed. Cassandra’s partition toler-
ance also ensures the system stays operational dur-
ing network issues. Furthermore, its native query-
ing language, CQL, is powerful and efficient, pro-
viding a robust interface for managing complex data
operations, far beyond the capabilities of traditional
SQL for distributed data environments (Perez-Miguel
et al., 2015).
5.2.3 System Components
As shown in Figure 6, our system comprises the fol-
lowing key components:
• Database: Stores data in four main tables: Donor,
BloodBank, Transactions, and Credentials.
• Simulator Module: Acts as the central process-
ing unit, pulling data from Cassandra, instantiat-
ing Donor and BloodBank objects, and simulating
blood donation transactions.
• Data Flow: The simulator pulls data from Cas-
sandra, processes it, writes new transactions, and
updates the database, creating a continuous cycle
of data management.
This architecture enables efficient data manage-
ment, real-time processing of blood donation transac-
tions, and seamless scalability to support the expan-
sion of donor networks and blood banks. By utiliz-
ing Apache Cassandra as our database solution, we
ensure that the system remains highly available and
partition-tolerant—both of which are essential in the
context of time-sensitive, geographically distributed
blood donation systems. These capabilities are criti-
cal for maintaining uninterrupted operations and reli-
able access to blood inventory data, even in the pres-
ence of network disruptions or expanding system de-
mands.
5.3 Implementation Details
5.3.1 Simulation 1: Randomized Transactions
Our first simulation model, termed “Randomized
Transactions,” is designed to replicate the dynamic
nature of blood donation and request processes within
a network of blood banks. Implemented in Python,
this simulation leverages the pandas library for effi-
cient data manipulation and processing. The key com-
ponents and processes of this simulation are as fol-
lows:
• Our simulation uses two key data structures: the
BloodBank class, which manages inventory, re-
quests, and expired resources, and Pandas data
frames to store and manipulate data for blood
banks, users, inventory, and transactions, ensuring
efficient data management and analysis.
• The simulation parameters span a 30-day period
from January 1 to January 30, 2023, encompass-
ing all eight major blood types (A+, A-, B+, B-,
Optimizing Blood Transfusions and Predicting Shortages in Resource-Constrained Areas
155

AB+, AB-, O+, O-) and four key blood compo-
nents: Red Blood Cells (RBC), Platelets (PLAT),
Plasma (PLAS), and Whole Blood (WB). Each
blood component is assigned a specific expiration
period: 42 days for RBC, 365 days for PLAS, 5
days for PLAT, and 35 days for WB. These ex-
piration parameters closely align with real-world
medical guidelines, ensuring the simulation accu-
rately reflects the constraints of blood component
storage and usage. (Aubron et al., 2018).
• The simulation tracks two key performance met-
rics—acceptance ratio of blood requests and total
distance traveled for donations and requests.
This randomized simulation serves as a baseline for
analyzing the dynamics of blood supply and demand
within a network of blood banks. It provides founda-
tional insights into the variability and flow of dona-
tions and requests, offering a reference point for eval-
uating more advanced optimization techniques.
5.3.2 Simulation 2: Heuristic Approach with
Proximity and Expiration Prioritization
Building on the foundation of Simulation 1, our sec-
ond simulation model incorporates several heuristic
optimizations to enhance blood allocation efficiency
and minimize waste. The key new features introduced
in this model are three heuristic elements to optimize
blood allocation. First, it utilizes proximity-based se-
lection, identifying the closest 15% of blood centers
for each request, thereby reducing transportation time
and enhancing logistical efficiency. Second, the sys-
tem incorporates expiration prioritization, ensuring
that blood units nearing their expiration dates are allo-
cated first, minimizing waste from expired products.
Lastly, blood type compatibility is managed through
a comprehensive compatibility matrix (refer to Figure
2), implemented as a map data structure for efficient
lookup, allowing for flexible and accurate blood type
matching across the network.
5.3.3 Simulation 3: Heuristic Approach with
Rarity Scores
Simulation 3 extends the functionality of Simula-
tion 2 by incorporating a new heuristic: rarity scores
for blood types. This enhancement further opti-
mizes blood allocation by accounting for the relative
scarcity of each blood type. The rarity score system,
where lower scores represent rarer blood types, is im-
plemented using a map data structure to facilitate effi-
cient lookups and decision-making during allocation.
Incorporating scarcity alongside other key factors en-
hances resource utilization, ensuring more effective
allocation, particularly for rare blood types.
Algorithm 1: Simulation for blood bank management with
expiry prioritization and rarity Scores.
Data: Blood banks, users, inventory data,
blood type compatibility matrix,
expiration rules, rarity scores
Result: Updated transactions and inventory
after simulation
Initialize simulation period, blood types,
component expiration rules, and rarity
scores;
Define blood type compatibility matrix;
foreach day in the simulation period do
Remove expired blood based on
expiration rules for each bank’s
inventory;
while daily operations not complete do
if Random event is a request then
Find 15% closest blood banks to
the user;
Check inventory using blood
compatibility matrix and
prioritize soon-to-expire
resources;
if Blood bank can fulfill request
(considering compatibility,
expiration, and rarity) then
Fulfill request and update
inventory;
Track distance, accepted
requests, and selected blood
type based on rarity scores;
else
Deny request and track failed
attempts;
end
else
Select a blood bank for donation;
Add donation to the bank’s
inventory with an expiry date;
Track distance and donation data;
end
end
end
Calculate performance metrics (acceptance
ratio, total distance);
Save updated transactions and inventory data;
The rarity scores are inversely correlated with the
prevalence of each blood type in the general popula-
tion. For example, O+ has the highest score due to
its commonality, while AB- has the lowest score, re-
flecting its rarity. This scoring system enables the al-
gorithm to prioritize the conservation of rarer blood
HEALTHINF 2025 - 18th International Conference on Health Informatics
156
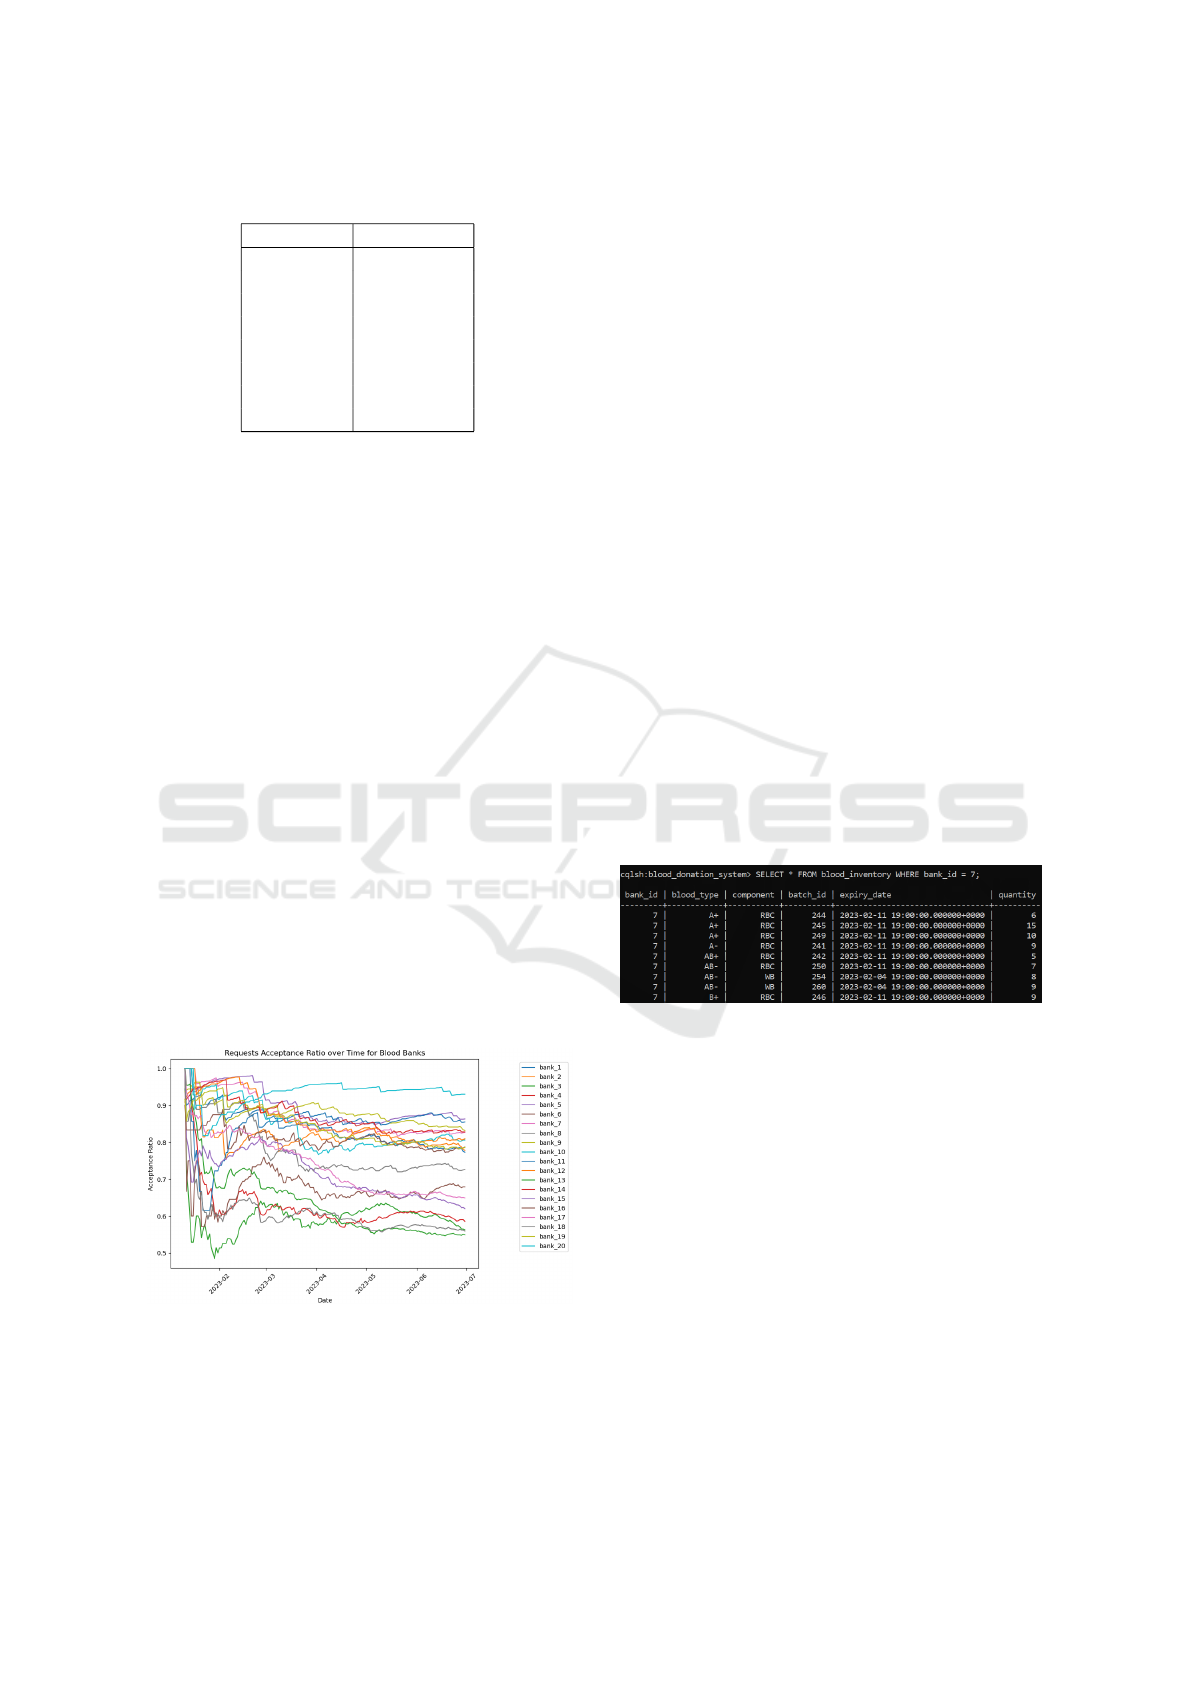
Table 3: Blood type rarity scores.
Blood type Rarity score
O+ 4
A+ 3
O- 3
B+ 2
A- 2
B- 1
AB+ 1
AB- 1
types during allocation decisions, ensuring more effi-
cient management of scarce resources.
This simulation retains the proximity-based selec-
tion, expiration prioritization, and blood type compat-
ibility matrix from Simulation 2 (refer to Figure 2 for
the compatibility matrix). The integration of rarity
scores with these existing heuristics in Algorithm 1
creates a more comprehensive approach to blood bank
management, potentially offering insights into strate-
gies for managing blood inventories more effectively,
especially for rare blood types.
5.3.4 Shortage Prediction Techniques
To further enhance our blood bank management sys-
tem, we implemented a shortage prediction module
designed to forecast the acceptance ratio of blood re-
quests for each blood bank up to 10 days in advance.
This predictive capability provides valuable insights,
enabling proactive donation efforts and more efficient
resource planning.
We collected acceptance ratio data for each blood
bank over a period of 180 days. This time series data
forms the basis of our prediction models. Figure 7
illustrates the variation in acceptance ratios across all
blood banks over this period.
Figure 7: Acceptance ratio changes for blood banks over
180 days.
We implemented and compared three distinct
time series prediction models, each offering unique
strengths in processing time-dependent data:
1. Long Short-Term Memory (LSTM) Networks:
A type of recurrent neural network capable of
learning long-term dependencies, well-suited for
capturing complex patterns in time series data.
2. Linear Regression: A simple yet effective ap-
proach for modeling linear trends in time series,
serving as a baseline for comparison with more
complex models.
3. Autoregressive Integrated Moving Average
(ARIMA): Combines autoregression, differenc-
ing, and moving average components, effective
for capturing various temporal structures in the
data.
Each model was trained on the 170-day historical
data and tasked with predicting the acceptance ratio
10 days into the future for each blood bank.
6 RESULTS AND DISCUSSION
6.1 Database Query Samples
To demonstrate the practical application of a NoSQL
database within the blood donation management sys-
tem, we present two sample queries written in Cas-
sandra Query Language (CQL) along with their cor-
responding results.
Figure 8: Query 1 to retrieve blood inventory for a specific
bank.
Figure 8 illustrates a query that retrieves the com-
plete blood inventory for a specific blood bank (bank
ID = 7). This query efficiently accesses detailed
inventory information, including blood types, com-
ponents, batch IDs, expiration dates, and quantities.
Such queries are essential for our optimization al-
gorithms, enabling precise assessment of blood unit
availability at a given location.
Figure 9 presents a more complex query that ag-
gregates the total quantity of O+ whole blood across
multiple blood banks. This type of query is especially
valuable for our shortage prediction models, enabling
analysis of the distribution and availability of specific
blood types and components across various locations.
These query examples demonstrate the flexibility
and power of our database schema in supporting both
Optimizing Blood Transfusions and Predicting Shortages in Resource-Constrained Areas
157

Figure 9: Query 2 to aggregate O+ whole blood quantities
across banks.
detailed inventory management and high-level analyt-
ics. The ability to efficiently retrieve and aggregate
data in this manner is fundamental to the performance
of our optimization and prediction algorithms.
We conducted three simulations to evaluate the
performance of our blood bank management system
under different optimization strategies. This section
presents the results and analyzes the improvements
achieved with each iteration.
6.2 Simulation Results
Table 4 summarizes the key performance metrics for
each simulation. We will analyze each of those.
Table 4: Performance metrics across the three simulations.
Metric Randomized Heuristic 1 Heuristic 2
Total Accepted Requests 553 679 674
Total Denied Requests 147 123 84
Overall Acceptance Ratio 0.79 0.85 0.89
Total Units Traveled 2,496,171 1,573,463 1,551,953
6.2.1 Acceptance Ratio Analysis
The acceptance ratio demonstrated consistent im-
provement across the three simulations, indicating the
effectiveness of the progressively refined heuristics.
In the first comparison, moving from Simulation 1
to Simulation 2, we observed an increase from 79% to
85%, a change that was statistically significant with a
z-score of 2.79 and a p-value of 0.0026. This marked
an improvement in optimizing blood allocation.
The second comparison, between Simulation 2
and Simulation 3, showed further gains, with the ac-
ceptance ratio rising from 85% to 89%. This improve-
ment, although smaller, remained statistically signifi-
cant, with a z-score of 2.12 and a p-value of 0.0170.
Finally, the cumulative effect from Simulation 1 to
Simulation 3 was even more striking, with the accep-
tance ratio increasing from 79% to 89%. This overall
improvement was highly significant, with a z-score of
4.90 and a p-value of less than 0.00001, underscor-
ing the substantial impact of incorporating additional
heuristic elements.
6.2.2 Distance Optimization
The total distance traveled decreased significantly:
• Sim 1 to Sim 2: Reduced by 922,708 (36.96%
reduction)
• Sim 2 to Sim 3: Further reduced by 21,510
(1.37% reduction)
• Overall reduction (Sim 1 to Sim 3): 944,218
(37.83% reduction)
The distance reduction analysis reveals that the
first heuristic introduced in Simulation 2 was the
most effective in minimizing the distance traveled, ac-
counting for nearly all of the overall gains (36.96%).
The second heuristic, while contributing sightly, re-
sulted in diminishing returns with only 1.37% addi-
tional reduction. Therefore, most of the optimization
occurred during the first transition, indicating that fur-
ther improvements in distance reduction may require
more advanced or different heuritics beyong those ap-
plied in Simulation 3.
6.2.3 Marginal Performance (MP) Analysis
To quantify the incremental benefits of each simula-
tion, we calculate the Marginal Performance (MP) us-
ing equation 1:
∆MP =
Acceptance rate − Baseline acceptance rate
1 − Baseline acceptance rate
(1)
Table 5 presents the results of this analysis:
Table 5: Marginal performance analysis.
Transition ∆MP (Accept ratio) ∆MP (Distance reduced)
S1 to S2 28.8% 37%
S2 to S3 26.7% 1.4%
S1 to S3 47.6% 37.8%
The MP analysis demonstrates that the largest im-
provements in both acceptance ratio and distance trav-
eled occur during the transition from S1 to S2. While
acceptance ratio continues to improve in the transition
S2 to S3, the gains in distance reduction are minimal,
suggesting diminishing returns in this aspect. Over-
all, the analysis shows that applying heuristic meth-
ods substantially improves performance, with nearly
48% improvement in acceptance rate and a 38% re-
duction in total distance traveled when comparing the
final simulation to the baseline.
HEALTHINF 2025 - 18th International Conference on Health Informatics
158

6.3 Shortage Prediction Results
We evaluated three predictive models—Long
Short-Term Memory (LSTM), Linear Regression,
and Autoregressive Integrated Moving Average
(ARIMA)—for forecasting the acceptance ratio of
blood banks. Each model was trained on 170 days
of historical data and tasked with predicting the
acceptance ratio for day 180. The results of each
model’s performance across 20 blood banks are
presented below.
Table 6 summarizes the performance of each
model:
Table 6: Model performance comparison.
Model Mean percent difference
LSTM 1.48%
Linear Regression 1.40%
ARIMA 1.83%
Based on the mean percent difference, both the
LSTM and Linear Regression models performed sim-
ilarly well, with LSTM having a 1.48% difference and
Linear Regression slightly better at 1.40%. ARIMA,
while still performing reasonably, had a higher mean
percent difference of 1.83%. Overall, the results sug-
gest that Linear Regression and LSTM are the most
accurate models for predicting the acceptance ratio,
with Linear Regression showing a slight edge in per-
formance over the other two models.
Tables 7, 8, and 9 show the detailed results for
each model. Due to space constraints, we present re-
sults for a subset of blood banks.
Table 7: LSTM model results subset.
Bank ID Predicted Actual Percent difference
1 0.7816 0.7757 0.7648%
5 0.8771 0.8626 1.6785%
10 0.8184 0.8063 1.5101%
15 0.6610 0.6233 6.0379%
20 0.9465 0.9302 1.7483%
Table 8: Linear regression model results subset.
Bank ID Predicted Actual Percent difference
1 0.7807 0.7731 0.9736%
5 0.8801 0.8634 1.9322%
10 0.8205 0.8063 1.7704%
15 0.6349 0.6201 2.3944%
20 0.9390 0.9302 0.9380%
All three models demonstrate strong performance,
with average absolute percentage differences ranging
from 1.40% to 1.83%. Among them, Linear Regres-
sion ranked the highest with 1.40% difference, fol-
Table 9: ARIMA model results subset.
Bank ID Predicted Actual Percent difference
1 0.7799 0.7731 0.8683%
5 0.8801 0.8634 1.9407%
10 0.8219 0.8063 1.9428%
15 0.6535 0.6201 5.3974%
20 0.9380 0.9302 0.8306%
lowed by LSTM at 1.48%, while ARIMA had the
highest difference at 1.83%.
Despite their overall accuracy, all models
struggled with specific outliers, such as Bank 15,
indicating that certain blood banks may have more
stochastic acceptance ratios. The findings suggest
that simpler models like Linear Regression provide
a good balance between accuracy and computational
efficiency for this task. The results demonstrate the
feasibility of using predictive models to forecast
acceptance ratios, aiding resource allocation and
shortage prevention in blood banks.
7 CONCLUSIONS AND FUTURE
WORK
In conclusion, our approach demonstrates significant
improvements in blood supply management through
the introduction of additional heuristic matching cri-
teria such as proximity, blood compatibility matrix,
rarity scores, and expiration dates. These enhance-
ments led to a 38% reduction in the total distance trav-
eled, which is crucial in emergencies where timely
delivery is essential. Furthermore, our multi-level
heuristic matching strategy resulted in a 48% im-
provement in matching performance ∆MP, highlight-
ing the potential for more efficient resource alloca-
tion.
Predicting blood transfusion acceptance rates over
a 10-day window also played a vital role in optimiz-
ing blood supply usage. Our evaluation shows that
while linear regression, LSTM, and ARIMA models
perform similarly in terms of accuracy, however linear
regression stands out as a simpler statistical predic-
tive approach, offering comparable results with lower
computational complexity.
For future work, we intend to explore the devel-
opment of mobile and web applications designed to
maximize user engagement, focusing on both donor
participation and improving the user experience for
patients, especially those requiring frequent transfu-
sions (Li et al., 2023). Additionally, we aim to cre-
ate an integrated model that combines shortage pre-
diction with heuristic matching. This combined ap-
Optimizing Blood Transfusions and Predicting Shortages in Resource-Constrained Areas
159

proach will be thoroughly assessed to determine its
impact on acceptance rates, comparing it to our cur-
rent system to further enhance efficiency and effec-
tiveness in blood supply management.
REFERENCES
Abramova, V. and Bernardino, J. (2013). Nosql databases:
Mongodb vs cassandra. In Proceedings of the inter-
national C* conference on computer science and soft-
ware engineering, pages 14–22.
American Society of Hematology (2020). Blood services
around the globe. ASH Clinical News.
Aubron, C., Flint, A. W., Ozier, Y., and McQuilten, Z.
(2018). Platelet storage duration and its clinical and
transfusion outcomes: a systematic review. Critical
Care, 22:1–13.
Barnes, L. S., Stanley, J., Bloch, E. M., Pagano, M. B., Ipe,
T. S., Eichbaum, Q., Wendel, S., Indrikovs, A., Cai,
W., and Delaney, M. (2022). Status of hospital-based
blood transfusion services in low-income and middle-
income countries: a cross-sectional international sur-
vey. Bmj Open, 12(2):e055017.
BCS (2022). Blood type compatibility: Which blood types
are compatible with each other? Accessed: 2024-10-
21.
Belfarsi, E. A. (2024). Blood donation/transfusion system.
Accessed: 2024-12-06.
Ben Elmir, W., Hemmak, A., and Senouci, B. (2023). Smart
platform for data blood bank management: forecast-
ing demand in blood supply chain using machine
learning. Information, 14(1):31.
Farrington, J. M., Utley, M., Alimam, S., Wong, W. K.,
and Li, K. (2023). Deep reinforcement learning for
managing platelets in a hospital blood bank. Blood,
142:2311.
Jokiaho, J. and community contributors (2023). Faker:
Python Package for Generating Fake Data. Version
15.3.3.
Kralievits, K. E., Raykar, N. P., Greenberg, S. L., and
Meara, J. G. (2015). The global blood supply: a liter-
ature review. The Lancet, 385:S28.
Laermans, J., O, D., Van den Bosch, E., De Buck, E.,
Compernolle, V., Shinar, E., and Vandekerckhove, P.
(2022). Impact of disasters on blood donation rates
and blood safety: A systematic review and meta-
analysis. Vox Sanguinis, 117(6):769–779.
Li, L., Valero, M., Keyser, R., Ukuku, A. M., and Zheng,
D. (2023). Mobile applications for encouraging blood
donation: A systematic review and case study. Digital
Health, 9:20552076231203603.
Perez-Miguel, C., Mendiburu, A., and Miguel-Alonso, J.
(2015). Modeling the availability of cassandra. Jour-
nal of Parallel and Distributed Computing, 86:29–44.
Petersen, J. and Jhala, D. (2023). Blood shortage moni-
toring: Comparison of the supply situation during the
omicron surge and at the tail end of the covid-19 pan-
demic this year. American Journal of Clinical Pathol-
ogy, 160(Supplement 1):S112–S113.
Raykar, N. P., Kralievits, K., Greenberg, S. L., Gillies,
R. D., Roy, N., and Meara, J. G. (2015). The blood
drought in context. The Lancet Global Health, 3:S4–
S5.
Riley, W., Love, K., and McCullough, J. (2021). Public pol-
icy impact of the covid-19 pandemic on blood supply
in the united states. American journal of public health,
111(5):860–866.
Roberts, N., James, S., Delaney, M., and Fitzmaurice, C.
(2019). The global need and availability of blood
products: a modelling study. The Lancet Haematol-
ogy, 6(12):e606–e615.
Sandaruwan, P., Dolapihilla, U., Karunathilaka, D., Wi-
jayaweera, W., Rankothge, W., and Gamage, N.
(2020). Towards an efficient and secure blood bank
management system. In 2020 IEEE 8th R10 Humani-
tarian Technology Conference (R10-HTC), pages 1–6.
IEEE.
Sarhan, M. A., Saleh, K. A., and Bin-Dajem, S. M. (2009).
Distribution of abo blood groups and rhesus factor in
southwest saudi arabia. Saudi Med J, 30(1):116–119.
Shih, H. and Rajendran, S. (2019). Comparison of
time series methods and machine learning algorithms
for forecasting taiwan blood services foundation’s
blood supply. Journal of healthcare engineering,
2019(1):6123745.
Talie, E., Wondiye, H., Kassie, N., and Gutema, H. (2020).
Voluntary blood donation among bahir dar university
students: application of integrated behavioral model,
bahir dar, northwest ethiopia, 2020. Journal of Blood
Medicine, pages 429–437.
Van Denakker, T. A., Al-Riyami, A. Z., Feghali, R., Gam-
mon, R., So-Osman, C., Crowe, E. P., Goel, R., Rai,
H., Tobian, A. A., and Bloch, E. M. (2023). Manag-
ing blood supplies during natural disasters, humanitar-
ian emergencies, and pandemics: lessons learned from
covid-19. Expert review of hematology, 16(7):501–
514.
Wijayathilaka, P., Gamage, P. P., De Silva, K., Athuko-
rala, A., Kahandawaarachchi, K., and Pulasinghe, K.
(2020). Secured, intelligent blood and organ donation
management system-“lifeshare”. In 2020 2nd Inter-
national Conference on Advancements in Computing
(ICAC), volume 1, pages 374–379. IEEE.
World Health Organization (2022). Blood transfusion: facts
in pictures. World Health Organization.
World Health Organization (2023). Blood safety and avail-
ability. Accessed: 2024-10-21.
Yedilkhan, D., Mukasheva, A., Bissengaliyeva, D., and
Suynullayev, Y. (2023). Performance analysis of scal-
ing nosql vs sql: A comparative study of mongodb,
cassandra, and postgresql. In 2023 IEEE International
Conference on Smart Information Systems and Tech-
nologies (SIST), pages 479–483. IEEE.
HEALTHINF 2025 - 18th International Conference on Health Informatics
160
