
A Comparative and Explainable Study of Machine Learning Models
for Early Detection of Parkinson's Disease Using Spectrograms
Hadjer Zebidi
1a
, Zeineb BenMessaoud
2
and Mondher Frikha
1b
1
Advanced Technologies for Image and Signal Processing ‘ATISP’ Research Lab,
National School of Electronics and Telecommunications of Sfax (ENET’Com), University of Sfax, Sfax, Tunisia
2
Higher Institute of Computer Science and Multimedia of Gabes (ISIMG), Gabes University, Gabes, Tunisia
Keywords: Parkinson’s Disease (PD), Early Detection, Spectrogram, Machine Learning, SMOTE, GridSearchCV, LIME.
Abstract: Parkinson's disease (PD) is a progressive neurodegenerative disorder that originally affects the motor system.
Therefore, early diagnosis is essential for effective intervention. Classic diagnostic approaches heavily rely
on clinical observations and manual feature extraction, limiting the detection of subtle early vocal
impairments. This research examines machine learning (ML) techniques, namely Support Vector Machines
(SVM), Random Forest (RF), and Extreme Gradient Boosting (XGBoost), for early identification of PD
through the analysis of spectrogram images derived from voice recordings. Mel-Frequency Cepstral
Coefficients (MFCC), Short-Time Fourier Transform (STFT), and Mel-Spectrograms were extracted. The
improvement of the model was introduced by the Synthetic Minority Over-sampling Technique (SMOTE)
and hyperparameter tuning using GridSearchCV (Grid Search with Cross-Validation). Implementing the
above methods resulted in significant performance improvements, with XGBoost achieving an accuracy of
95 ± 0.02 on the PC-GITA dataset and SVM attaining 90.74 ± 0.04 on the Neurovoz dataset. Local
Interpretable Model-agnostic Explanations (LIME) enhanced model transparency by identifying the
significant regions in spectrograms that most influence predictions. This analysis illustrates the efficacy of
ML models utilizing SMOTE and GridSearchCV, particularly when augmented by LIME for interpretability,
in improving early detection of PD, thereby presenting a feasible approach for clinical implementation.
1 INTRODUCTION
Parkinson's disease, or PD, is a neurodegenerative
illness that affects about 1% of people over 60 around
the world (Dorsey et al., 2018). The condition is
marked by a group of motor symptoms, such as
tremors, rigidity, and slow movement, as well as a
number of non-motor symptoms, such as cognitive
decline and changes in speech and voice (Bloem et
al., 2021). These symptoms significantly affect the
quality of life for patients with PD and provide
considerable obstacles for healthcare personnel in the
prompt and efficient administration of medication.
Early PD diagnosis is paramount, as it allows for
implementing therapeutic interventions that can
markedly enhance patient outcome (Murman, 2012).
Still, the present diagnostic techniques—which
mostly rely on clinical assessments and patient-
a
https://orcid.org/0009-0003-8204-9712
b
https://orcid.org/0000-0003-2584-5141
reported symptoms—often insufficient short for early
PD (Gullapalli & Mittal, 2022), particularly in cases
of subtle or unrecognized voice impairments.
People with PD show particular changes in their
vocal features, including a decrease in pitch
variability, changes in speech pace, and articulation
problems (Harel et al., 2004). While audio recordings
allow one to record these changes, conventional
analysis techniques may rely on hand feature
extraction, which might not fully capture the intricacy
of voice patterns, therefore restricting their efficacy
in automated assessments (Klempíř & Krupička,
2024).
Due to technological developments, speech
analysis— as a non-invasive and easily available
technique for early disease diagnosis—has been
developed. Analyzing acoustic features including
pitch, jitter, and shimmer shows that it is possible to
272
Zebidi, H., BenMessaoud, Z. and Frikha, M.
A Comparative and Explainable Study of Machine Learning Models for Early Detection of Parkinson’s Disease Using Spectrograms.
DOI: 10.5220/0013183900003905
In Proceedings of the 14th International Conference on Pattern Recognition Applications and Methods (ICPRAM 2025), pages 272-282
ISBN: 978-989-758-730-6; ISSN: 2184-4313
Copyright © 2025 by Paper published under CC license (CC BY-NC-ND 4.0)

distinguish PD patients from healthy people.
However, many research using these features depend
on traditional ML models, which need for hand
feature engineering and might not be sufficient in
capturing the whole spectrum of auditory features
(Badhan & Kaur, 2024).
Building on these developments, researchers aim
to leverage the strengths of ML methods to assess
their performance in identifying early PD signs using
spectrogram images of voice recordings. Optimal for
ML-based analysis, spectrograms graphically depict
audio signals and capture both frequency and time-
domain information.
Using the PC-GITA and Neurovoz datasets, this
work contrasts the performance of several ML
models—including SVM, RF, and XGBoost—to
identify early-stage PD from continuous vowel
recordings of the vowel "a". We used SMOTE and
GridSearchCV hyperparameter adjustment to solve
class imbalance and optimize model performance.
To enhance model interpretability, we employed
LIME in the best-performing ML models. This method
helps to distinguish how ML models interpret speech
data for early PD detection and helps to identify which
areas of the spectrograms most contributed to the
model
's capacity. This understanding is crucial for
identifying the vocal features that separate PD patients
from healthy controls (HC), thus validating the model's
predictive capabilities.
This work attempts to evaluate, using voice
analysis, whether ML techniques are more effective
for early PD identification. This comparison
underscores the potential of ML techniques could
automatically extract complex properties.
The present paper focuses on:
• The utility of spectrogram images for
classification purposes.
• A comparative analysis of ML techniques
for the early detection of PD.
• Model interpretability through LIME.
The framework of this research is presented in the
next parts. With a focus on spectrogram production,
feature extraction, and model training, Section 2
presents the framework for the materials and
methodology. Section 3 offers a comprehensive
review of the evaluation metrics critical for dataset
assessment. Last but not least, Section 4 presents a
thorough examination of the results, contrasting the
performance of ML models and stressing important
results; it also includes the conclusions of the study
and suggestions for next studies.
2 MATERIALS AND METHODS
This paper illustrates the proposed framework, which
employs a systematic methodology for early
classifying PD based on speech datasets, as shown in
Figure 1. It entails gathering voice data from patients
with PD and HC participants for analysis, followed
by data preprocessing. The feature extraction step
commences, extracting attributes such as MFCC,
STFT spectrogram, and Mel-spectrogram from the
audio data, converting them into spectrogram images,
and balancing the dataset utilizing SMOTE.
Following data balancing, the next step is to employ
GridSearchCV to refine the hyperparameters of the
ML models and evaluate their efficacy. We organize
each phase to guarantee that the models can
proficiently discriminate between HC and individuals
with PD utilizing speech data, therefore facilitating
the early detection and diagnosis of the disease.
2.1 Parkinson’s Disease Dataset
Two extensively referenced (PD) datasets were
employed in this study: PC-GITA (Orozco-Arroyave
& Noth, n.d.) and Neurovoz (Mendes-Laureano et
al., 2024). Each database comprises individuals with
PD and HC subjects. Neurologists have employed the
Unified Parkinson's Disease Rating Scale (UPDRS)
and the Hoehn and Yahr scale (H&Y) to identify and
categorize the Patients. The databases exhibit
variations in demographics and sizes, as outlined in
Table 1.
All recordings utilized in this study were at an
early stage (UPDRS stages 1-2). Under controlled
environmental settings, data recordings were
conducted in all instances. The staff instructed each
participant to execute several speech activities. This
study examines sustained phonation of the vowel /a/.
Each patient was recorded three times.
Table 1: Demographic information, including gender and age ranges for the PC-GITA and Neurovoz corpora.
Corpus
Subjects Age (Years)
Female Male Female Male
PD HC PD HC PD HC PD HC
Neurovoz 16 23 15 24 56–86 58–86 41–80 53–77
PC-GITA 17 25 19 25 44–75 43–76 33–77 31–86
A Comparative and Explainable Study of Machine Learning Models for Early Detection of Parkinson’s Disease Using Spectrograms
273
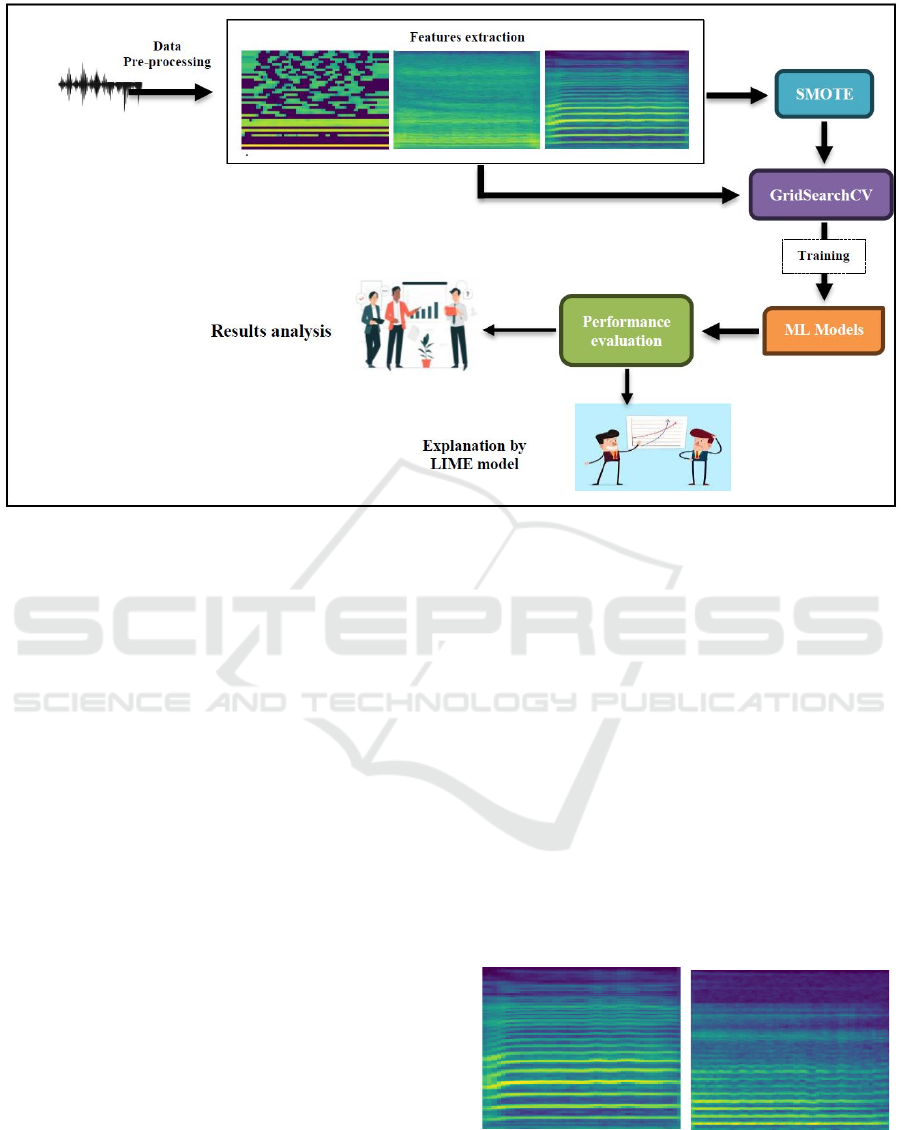
Figure 1: Proposed model for early PD classification.
2.2 Data Pre-Processing
All recordings from the PC-GITA and Neurovoz
datasets were resampled to 16 kHz utilizing the
librosa library to maintain uniformity in the sampling
rate. EBU R128 loudness normalization was
implemented utilizing the ffmpeg-normalize library
(Ffmpeg-Normalize, n.d.) to attain uniform loudness
levels, enhancing conventional peak-based
normalization.
The spectrogram features were retrieved and
saved as 224x224-pixel image files. These images
were organized by class label (HC for healthy
controls, PD for Parkinson's disease) then normalized
to the range [0, 1] by dividing pixel values by 255.
80% of the dataset was used for training, and 20%
was used for testing. The dataset was divided into
training and test sets at random.
2.3 Feature Extraction
2.3.1 MFCC Coefficients
MFCCs were extracted with 13 MFCC coefficients
per frame and their derivatives in order to capture the
envelope of a sound's short-term power spectrum
(Mishra et al., 2024). These factors are perfect for
differentiating between PD patients and HC because
they accurately capture the timbral features of speech.
2.3.2 STFT Spectrograms
The STFT spectrogram is an effective tool for
analyzing and visualizing time-varying frequency
content in audio signals. It converts all recordings into
the time-frequency domain, facilitating the
examination of the dynamic evolution of frequency
content in a given signal (Xuan, 2023). In this work,
windows (n-fft) of 32 milliseconds in length were
computed using STFT representations chosen to
achieve a balance between computing efficiency and
sufficient temporal and frequency precision. To
ensure constant signal length, the hop length was set
at 8 milliseconds and the maximum padding length
(max_pad_len) was changed to 100. The time-
frequency representation extracted was used as input
to feed to the ML model.
a. HC speaker b. PD patient
Figure 2: STFT spectrograms of the vowel /a/speech signal
pronounced by HC speaker (a) and a patient with PD (b).
ICPRAM 2025 - 14th International Conference on Pattern Recognition Applications and Methods
274

2.3.3 Mel-Spectrograms
The Mel-spectrogram is a popular used representation
of audio data that measures the power of a signal on
the Mel scale, which more accurately approximates
the human auditory system's reaction to different
frequencies. This work created Mel-spectrograms
with a filter bank of 40 Mel bands. This method
transforms the power spectrogram to a log scale,
resulting in a reliable representation of audio features
relevant for speech analysis and disease detection.
After extracting features from the MFCC with
their derivatives, STFT and Mel-spectrograms, the
spectrograms were flattened into one-dimensional
vectors, thus ensuring compatibility with ML models.
In this stage, the two-dimensional spectrograms are
converted into a format that numerical array-input
models may use. A full feature set representing each
audio sample was created by merging the resulting
flattened vectors. To make sure that all relevant
auditory features were used for classification, these
feature vectors were fed into the ML pipeline.
2.4 Classification Methods
Following previous stages, we used ML techniques,
including SVM, RF, and XGBoost, to identify early
PD, building on earlier stages. To improve the
performance of the model and find the ideal
hyperparameters, SMOTE and GridsearchCV were
used to all of the ML models. Kernel types, the
number of estimators, and learning rates were
explored to determine the most effective models for
the early detection of PD.
2.4.1 Support Vector Machine (SVM)
A supervised ML algorithm that is widely utilized for
classification tasks. It works by finding a hyperplane
that optimally differentiates data points belonging to
disparate classes within a high-dimensional space.
SVM is efficacious in high-dimensional settings and
exhibits resilience to overfitting, particularly when
the number of features surpasses the number of
observations. Employing an array of kernel functions
(linear, polynomial, radial basis function) can handle
both linear and non-linear classification (Bind et al.,
2015).
2.4.2 Random Forest (RF)
An ensemble learning method based on decision
trees. During the training phase, it builds multiple
trees, each using a random subset of the data. The
outputs of these trees are then combined using
majority voting, resulting in an improved
classification. The method is versatile, capable of
handling large datasets with high dimensionality, and
resistant to noise and overfitting (Breiman, 2001).
2.4.3 Extreme Gradient Boosting (XGBoost)
A robust gradient-boosting algorithm that builds
models stage-wise, with each new tree correcting
errors from the previous ones by focusing on
misclassified examples. It uses regularization to
minimize overfitting and use optimization techniques
such as parallelization and tree pruning to improve
performance and speed. XGBoost excels at processing
structured data and consistently outperforms other
algorithms in ML contests (Wang et al., 2022).
2.4.4 Synthetic Minority Over-sampling
Technique (SMOTE)
There are few PD samples than HC samples in the
dataset, which creates an imbalance. A solution to this
problem is to oversample members of the minority
class in order to achieve distributional parity.
Improving the class distribution is possible via
instance replication, but it does not provide any new
information. SMOTE addresses this issue by
producing new samples using linear interpolation of
existing minority class instances, hence generating
synthetic data points along the trajectory of the
feature space (Brownlee, 2020). For a certain
minority instance 𝑥
a synthetic sample 𝑥
𝒏𝒆𝒘
is
generated by interpolating between 𝑥
𝒊
and one of its
k-nearest neighbors 𝑥
𝐧𝐞𝐢𝐠𝐡𝐛𝐨𝐫
, where λ is a random
value within the interval [0,1].
𝑥
𝒏𝒆𝒘
=𝑥
+𝝀(𝑥
𝐧𝐞𝐢
𝐠
𝐡𝐛𝐨𝐫
−𝑥
𝒊
) (1)
2.4.5 Hyperparameter Tuning
(GridSearchCV)
GridSearchCV is a widely utilized method for
hyperparameter optimization in ML models.
Hyperparameters are predefined configurations set
prior to model training, encompassing the Kernel, C,
gamma, number of estimators, learning rate, and
max_depth. Determining the ideal values for these
parameters can substantially enhance model
performance (Jumanto et al., 2024).
GridSearchCV is a method for systematically
exploring a predefined set of hyperparameter values
to identify the optimal configuration. It requires three
key elements:
The estimator represents the model to be
trained.
A Comparative and Explainable Study of Machine Learning Models for Early Detection of Parkinson’s Disease Using Spectrograms
275

A parameter grid is a list of hyperparameters
and their potential values.
CV: The number of folds in K-fold cross-
validation. We set k = 5.
3 EVALUATION METRICS
The key evaluation metrics for classification models
are accuracy, precision, recall, and F1-score:
Accuracy measures the proportion of correctly
classified instances:
Accurac
y
=
𝑇𝑃 + 𝑇𝑁
𝑇𝑃+𝑇𝑁+𝐹𝑃+𝐹𝑁
(2)
Precision indicates the proportion of predicted
positives that are positive:
Precision =
𝑇𝑃
𝑇𝑃 + 𝐹𝑃
(3)
Recall measures the proportion of actual
positives correctly identified:
Recall =
𝑇𝑃
𝑇𝑃 + 𝐹𝑁
(4)
F1-score balances precision and recall,
particularly for imbalanced datasets:
F1 − score =
2 𝑇𝑃
2 𝑇𝑃 + 𝐹𝑃 + 𝐹𝑁
(5)
4 RESULTS AND DISCUSSION
Tables 2 and 3 present a comparative performance of
ML models for early PD detection from the two
disjoint datasets without and with the application of
SMOTE. The analysis is based on performance
metrics, including accuracy, F1 score, precision, and
recall, all with standard deviation, to highlight the
strengths and weaknesses of the models across these
datasets.
The models showed different success over the
two datasets according to the results acquired
without applying SMOTE (Table 2). The XGBoost
model showed the best level of accuracy in the PC-
GITA dataset—82.85 ± 0.05 Followed by the SVM
(80.77 ± 0.05). While the XGBoost model showed
the highest precision (86.67 ± 0.08), the SVM model
also had the highest F1-score (77.27 ± 0.08) and
recall (73.42 ± 0.09). Its F1-score and recall were,
however, rather lower than those of SVM and RF.
The results imply that XGBoost shows a superior
balance between accuracy and precision. With an
accuracy of 78.85 ± 0.07 and a recall of 59.09 ± 0.14
RF model showed the lowest performance among
the three. The results show that the RF model
showed more trouble than the other models handling
class imbalance.
With an accuracy of 72.09 ± 0.06, an F1 score of
70 ± 0.04, and a recall of 66.67 ± 0.12, SVM displays
the best performance in the Neurovoz dataset. With
XGBoost attaining the lowest accuracy (69.37 ± 0.04)
and recall (52.38 ± 0.10), the results for XGBoost and
RF were inferior; yet, its precision was greater than
those of other models with 78.57 ± 0.04. These results
show that although SVM showed superior
performance in handling data without SMOTE,
XGBoost, and RF showed more amazing difficulty in
addressing the class imbalance, especially with the
recall.
Table 2: Performance results without SMOTE from each dataset using the ML models for the early prediction of PD.
Dataset Model Accuracy F1_score Precision Recall
PC-GITA
SVM 80.77 ± 0.05 77.27 ± 0.08 79.86 ± 0.11 73.42 ± 0.09
RF 78.85 ± 0.07 70.27 ± 0.13 85.91 ± 0.09 59.09 ± 0.14
XGBoost 82.85 ± 0.04 70.27 ± 0.08 86.67 ± 0.08 59.68 ± 0.06
Neurovoz
SVM 72.09 ± 0.06 70 ± 0.04 73.68 ± 0.03 66.67 ± 0.08
RF 70.79 ± 0.05 66.67 ±0.05 72.22 ± 0.07 61.90 ±0.12
XGBoost 69.37 ± 0.04 62.86 ± 0.07 78.57 ± 0.04 52.38 ± 0.10
Table 3: Performance results with SMOTE from each dataset using the ML models for the early prediction of PD.
Dataset Model Accuracy F1_score Precision Recall
PC-GITA
SVM 90 ± 0.03 89.60 ± 0.04 96.30 ± 0.05 83.87 ± 0.06
RF 86.66 ± 0.05 86.14 ± 0.06 96 ± 0.03 77.42 ± 0.07
XGBoost 95 ± 0.02 95.08 ± 0.03 96.67 ± 0.02 93.55 ± 0.04
Neurovoz
SVM 90.74 ± 0.04 90.71 ± 0.05 96.15 ± 0.04 86.21 ± 0.05
RF 83.33 ± 0.06 84.21 ± 0.07 85.71 ± 0.05 82.76 ± 0.06
XGBoost 80.62 ± 0.07 81.36 ± 0.06 80 ± 0.08 82.76 ± 0.03
ICPRAM 2025 - 14th International Conference on Pattern Recognition Applications and Methods
276
When SMOTE (Table 3) was used, the
performance of all models improved, especially SVM
and XGBoost, across both datasets. When tested on
the PC-GITA dataset, the SVM was enhanced. Its
accuracy went from 80.77 ± 0.05 to 90 ± 0.03 and its
F1 score went from 77.27 ± 0.08 to 89.60 ± 0.04. The
accuracy went up a lot, from 79.86 ± 0.08 to 96.30 ±
0.05, and the recall went up a lot, too, from 73.42 ±
0.09 to 83.87 ± 0.06. It's clear from these results that
SMOTE facilitated enhanced the SVM's performance
by reducing class mismatch, which is a key part of
finding rare PD cases in the dataset.
XGBoost significantly improved performance,
with accuracy increasing from 82.85 ± 0.04 to 95 ±
0.02, F1 score went from 70.27 ± 0.08 to 95.08 ± 0.03,
and recall went from 59.68 ± 0.06 to 93.55 ± 0.04.
Based on these results, it looks like the synthetic data
that SMOTE created helped XGBoost a lot,
especially when it came to memory. This means that
the model became better at finding positive cases of
PD. Even though RF's accuracy went up from 78.85
± 0.07 to 86.66 ± 0.05, its F1 score and recall went up
less than those of SVM and XGBoost. As expected,
the recall went up from 59.09 ± 0.14 to 77.42 ± 0.07.
This indicates that SMOTE enhanced performance
for RF, albeit not to the same extent as for SVM and
XGBoost.
The enhancements on the Neurovoz dataset were
more modest but still significant. The SVM's recall
improved from 66.67 ± 0.08 to 86.21 ± 0.05, and its
accuracy increased from 72.09 ± 0.06 to 90.74 ± 0.04.
These results indicate that SVM experienced
substantial benefits from SMOTE, as evidenced by its
improved generalization across the entire dataset and
significant increases in recall. In addition, XGBoost
exhibited an increase, with accuracy increasing from
69.37 ± 0.04 to 80.62 ± 0.07 and recall increasing
from 52.38 ± 0.10 to 82.76 ± 0.03. However, the
model's susceptibility to the challenge was suggested
by the fact that the XGBoost enhancement was less
pronounced on Neurovoz than on PC-GITA.
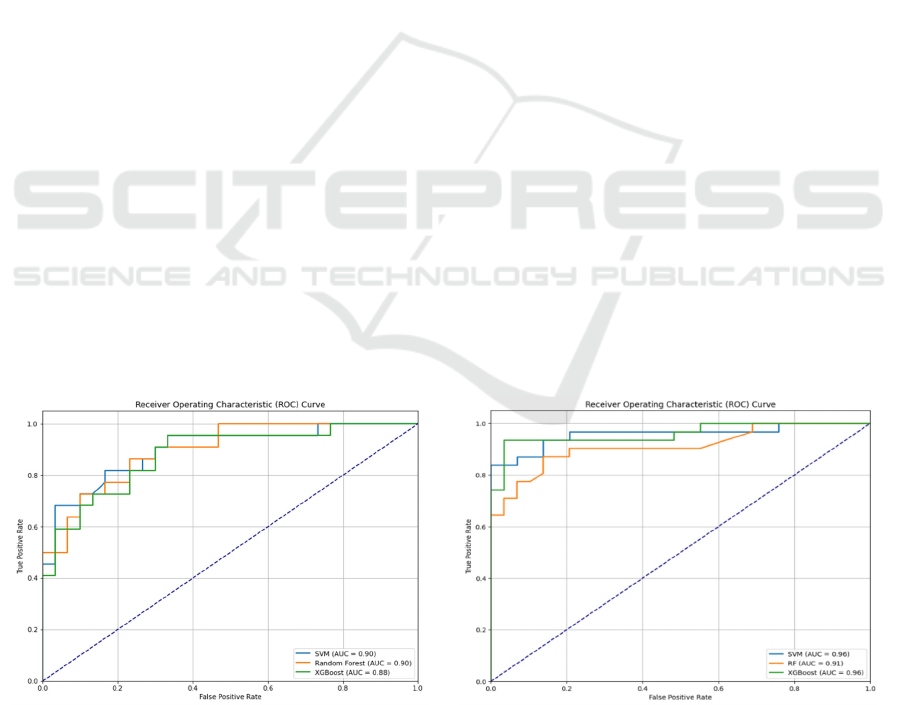
Figure 3 illustrates the ROC-AUC curves of the
three ML models—SVM, RF, and XGBoost—
generated on the PC-GITA dataset. In subplot (a), the
AUCs for SVM and XGBoost are 0.90 and 0.88,
respectively, indicating excellent discriminatory
performance without SMOTE. Nevertheless, the RF
model exhibits slightly superior predictive capacity,
with an AUC of 0.90. These findings show that all
three models can efficiently identify PD patients from
HC, with RF doing the best without SMOTE. In
subplot (b), the use of SMOTE improved the
performance of all three models. The SVM and
XGBoost models both have a good AUC of 0.96,
suggesting exceptional classification skill across
thresholds.
Moreover, RF has superior performance, with an
AUC of 0.91, highlighting its capacity to tackle class
imbalance via SMOTE. The observed enhancement
across models demonstrates that oversampling using
SMOTE significantly improves the model's
robustness, especially in datasets with class
imbalance. Both SVM and XGBoost exhibit
exceptional and consistent performance on the PC-
GITA dataset, rendering them optimal choices for
early PD identification.
Figure 3: AUC-ROC curve of the three ML models in PC-GITA dataset without and with SMOTE.
(
a
)
Without SMOTE
(
b
)
With SMOTE
A Comparative and Explainable Study of Machine Learning Models for Early Detection of Parkinson’s Disease Using Spectrograms
277
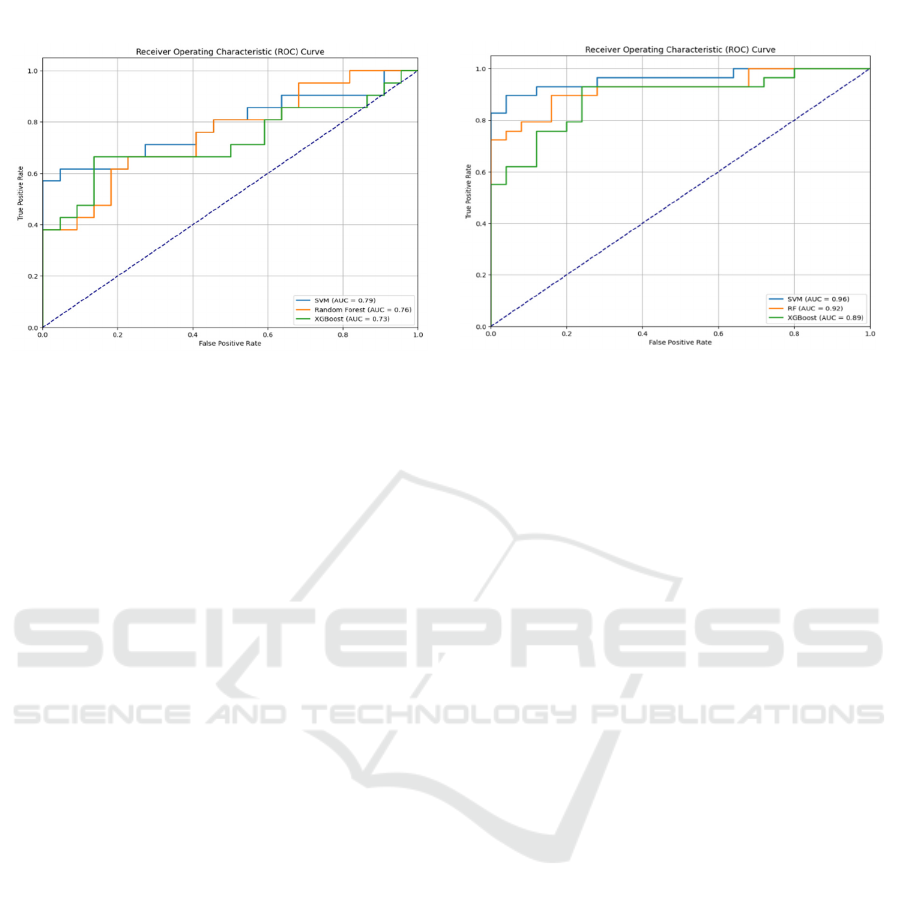
Figure 4: AUC-ROC curve of the three ML models in Neurovoz dataset without and with SMOTE.
Figure 4 demonstrates the effectiveness of the
models on the Neurovoz dataset, as evidenced by the
AUC-ROC curves. In subplot (a), before to the
application of SMOTE, the SVM attains a maximum
AUC of 0.79, which, although satisfactory, indicates
a reduction in performance relative to PC-GITA.
XGBoost achieves an AUC of 0.73, whereas RF has
the lowest performance at 0.70. These findings
indicate that the Neurovoz dataset poses additional
hurdles, most likely due to variability and underlying
characteristics in patient data. Subplot (b) shows that
applying SMOTE improves AUC scores significantly
across all models, illustrating the relevance of
resolving class imbalance. SVM once again earns the
highest AUC (0.96), demonstrating its resilience and
reliability. The RF model shows a significant
improvement, with an AUC of 0.92, demonstrating
that it can adjust to class-balanced data. XGBoost has
an AUC of 0.89, which indicates improved
performance in this context.
The importance of SMOTE in addressing class
imbalance is emphasized by these findings,
particularly in the context of the Neurovoz dataset.
GridSearchCV was also instrumental in the
optimization of hyperparameters for all models,
which exacerbated the performance enhancements
observed with SMOTE. Furthermore, fine-tuning
parameters such as kernel type and regularization
strength improved SVM's capacity to generalize,
contributing to the model's consistently high AUC.
Similarly, with XGBoost, GridSearchCV enhanced
the learning rate and maximum tree depth, allowing
the model to catch more complicated patterns in the
data. After applying SMOTE, RF gained much
improved performance from optimal tree depth and
the number of estimators. These hyperparameter
adjustments highlighted the joint effectiveness of
SMOTE and GridSearchCV by helping the models
match their performance with the features of every
dataset. Several significant observations arise from
results analysis. The application of SMOTE,
illustrated in subplot (b), significantly enhanced AUC
values for all models and datasets, thereby addressing
class imbalance concerns. Second, SVM's
dependability for early PD identification was
confirmed by its consistent achievement of the
greatest AUC across datasets (0.96). XGBoost
demonstrated exceptional efficacy, particularly on
PC-GITA, despite minor performance fluctuations.
RF, despite its initial subpar performance,
successfully adjusted to SMOTE and achieved
impressive results on the Neurovoz dataset.
Nonetheless, SMOTE facilitated the recovery of all
models, resulting in robust outcomes.
In summary, the SVM model proves to be the
most resilient and reliable across both datasets and
situations, positioning it as a formidable candidate for
clinical applications. XGBoost and RF exhibit
potential, especially when customized to the distinct
features of certain datasets. The synergistic effect of
SMOTE and GridSearchCV underscores their
significance in improving model efficacy for
unbalanced datasets, especially with early PD
detection.
4.1 Local Interpretable
Model-Agnostic Explanations
(LIME)
In this study, we employed LIME to interpret the best
model, XGBoost, predictions in classifying PD in
early-stage and HC patients. A post-hoc
interpretability method was developed to explain
(
a
)
Without SMOTE
(
b
)
With SMOTE
ICPRAM 2025 - 14th International Conference on Pattern Recognition Applications and Methods
278
every prediction complex and black-box model. It
achieves this by constructing local, interpretable
models that approximate the behavior of the black-
box ML models within some small neighborhood
around the data point being explained (Molnar, 2020).
LIME was selected for this work because it is a
model-agnostic technique. Hence, it can be easily
applied to any ML algorithm (e.g. XGBoost, SVM).
It will also provide local explanations that will enable
the analysis of exactly which features of the input
data- namely, Mel-spectrograms- the model is
considered most influential for classifying each
patient as either PD or HC. This capability is critical
when applied clinically, for which there is an urgent
need to understand the underlying decision-making
process of ML models to build trust among health
professionals and ensure the validity of model
outputs.
LIME works by perturbing the input data, slightly
modifying the spectrogram, and observing how the
model's prediction changes. Then, it builds a more
straightforward interpretable model example; a linear
model approximates the decision boundary of the
complex model in the vicinity of the input data point.
Formally, this can be presented as:
ξ
(x)
=
𝑎𝑟
𝑔
𝑚𝑖𝑛 L
(
f,
g
,
+Ω
(
g
(6)
Where :
• f is the original black-box model (XGBoost in
our study).
• g is the interpretable local surrogate model.
•
is a proximity measure that assigns higher
weights to data points close to the instance
x.
• L (f, g, π
x
) ensures that the local surrogate
model g approximates the complex model f
behavior.
• Ω(g) enforces interpretability by ensuring the
surrogate model remains simple.
In our analysis, LIME has been applied to explain
the predictions made through XGBoost upon
spectrograms from PC-GITA and Neurovoz datasets.
The spectrograms represent time-frequency
representations of speech recordings, where XGBoost
was tasked with classifying the spectrograms as
belonging to either PD or HC patients. With LIME,
we can visualize those regions within the Mel-
spectrograms that contribute the most toward model
predictions and, in turn, provide an interpretable
explanation for each decision made by this class.
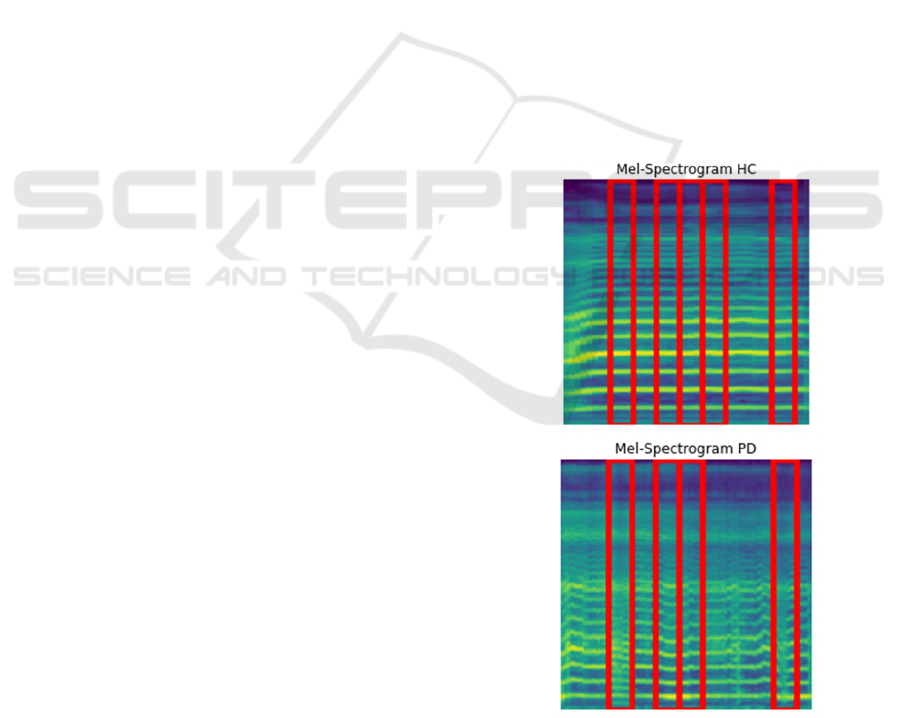
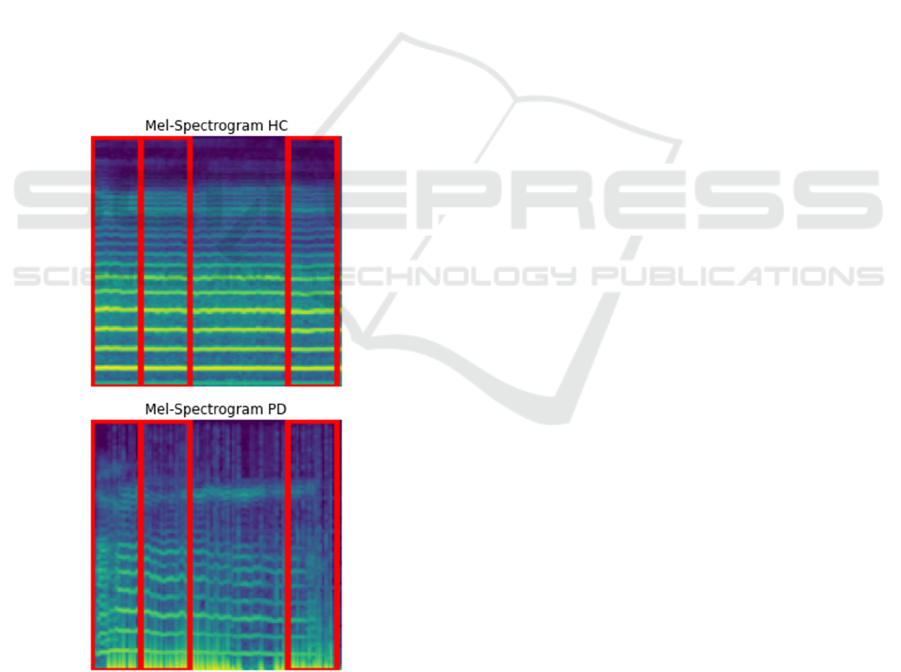
Figures 5 and 6 present LIME explanations for PD
and HC patients of the PC-GITA and Neurovoz
datasets, respectively.
Figure 5 illustrates that the XGBoost model
utilized four essential regions inside the Mel-
spectrogram to categorize PD patients in the PC-
GITA dataset. The locations marked in red signify
areas where the model identified auditory traits
indicative of PD, including diminished frequency
variability, lower vocal intensity, and delayed speech.
These features signify vocal abnormalities typically
linked to PD, such as monotone speech and
dysarthria. The localized features of these
emphasized regions indicate that the model
concentrates on distinct portions of the spectrogram
to discern PD-specific speech patterns.
Furthermore, the model found five separate areas
that assisted with sort the PC-GITA dataset into
groups of HC patients. The red areas show the sound
features that show a healthy vocal system. These
include changing pitches quickly and clearly, and
regular speech. These traits show normal speaking
range and flow, which is very different from the stiff
and repetitive speech patterns seen in people with PD.
Focusing on these key areas shows that the model
uses variations in frequency and intensity to tell the
difference between normal and Parkinsonian
speaking.
Figure 5: LIME explanations for both PD and HC from PC-
GITA dataset.
A Comparative and Explainable Study of Machine Learning Models for Early Detection of Parkinson’s Disease Using Spectrograms
279
By contrast, in the case of the Neurovoz dataset,
XGBoost depended on a broader set of regions in both
PD and HC Mel-spectrograms. In the case of the HC
patients from this dataset, three regions were
underlined by the model within the spectrogram. This
wider distribution of salient regions reflects the
greater complexity and variability inherent in healthy
speech patterns. Healthy subjects thus had dynamic
pitch modulation, more variance over time, and a
wider range of vocal frequencies, while the
dependence of the model on several regions indicates
that this is a level at which complexity needs to be
captured for accurate classification.
The model also focused on three salient regions in
the Mel-spectrogram for PD patients in the Neurovoz
dataset. These will highlight the spectrogram parts
that the model focused on because of speech features
typical for a PD, such as reduced tempo and
frequency modulation. More regions suggest that
Neurovoz contains more subtle or dispersed
Parkinsonian features, and the model needs to
consider more significant parts of the spectrograms to
make a more confident classification.
Figure 6: LIME explanations for both PD and HC from
Neurovoz dataset.
Comparing the results from the PC-GITA with the
Neurovoz datasets, it is apparent that this model
requires fewer regions in the dataset on which it was
trained to differentiate between PD and HC patients.
This fact could support the claim that the acoustic
features are more salient in the PC-GITA dataset;
therefore, the model can rely on fewer key areas for
classification. In contrast, the intensive distribution of
important regions in the Neurovoz dataset suggests
that more dispersed and subtle features need to be
captured by the model. These differences are likely
attributable to variations in the demographics of
speakers, languages, or recording conditions between
the two datasets.
LIME has provided much more insight for the
clinician into the model's decision-making process,
and the highlighted regions in the Mel-spectrograms
point to specific vocal features relevant in a clinical
sense for distinguishing PD from HC patients. For
instance, monotonic speech, reduced articulation, or
slowed speech are well-established indicators of PD
and parameters that the model has paid much
attention to agree with the clinical expectation. With
interpretable explanations, LIME ensures the
XGBoost model provides transparent predictions that
the patient can clinically validate. This
interpretability is necessary for embedding the ML
model into clinical decision-making to enable early
detection of PD.
4.2 Comparative Analysis with
Previous Studies
Results obtained with the proposed model are
compared to several recent related works on the early
detection of PD using ML models and speech
features, focusing on the accuracy achieved in
detecting PD from the sustained phonation of the
vowel /a/ across different models and datasets
outlined in Table 4. During the last few years, various
studies have investigated the potential of ML models
in diagnosing PD through speech signal processing.
These works have extracted different acoustic
features from voice records and applied various ML
techniques to attain higher diagnostic accuracy.
Recently, Wodzinski et al. (Wodzinski et al.,
2019) conducted a serious study on the use of MFCC
features that were then converted into spectrogram
images for analysis. The method was based on a
ResNet convolutional neural network model, which
treated the problem as an image classification task.
This research utilized the PC-GITA dataset for its
study and powered an accuracy of 91.7% regarding
detecting PD on the sustained phonation of the vowel
sound /a/. They have used deep learning techniques to
show how voice data can generally be analyzed to
detect diseases.
ICPRAM 2025 - 14th International Conference on Pattern Recognition Applications and Methods
280

Table 4: Comparison of performance of the proposed model with previous studies.
References Input Model Dataset
Accurac
y
Wodzinski M. et
al.
MFCCs transforming them into
S
p
ectrogram images
ResNet PC-GITA 91.7%
Nayak S. S. et al.
MFCC + Mel-
spectrogram + Spectralcontrast +
Chroma
g
ram + Tonnetz with GA
SVM PC-GITA 94%
Ibarra E. J. et al. Mel-scale spectrograms 2D-CNN
N
eurovoz 74.9%
Our work
MFCCs with their derivatives+ STFT
spectrograms + Mel-spectrograms
transforming them into Spectrogram
images
XGBoost PC_GITA 95%
SVM Neurovoz 90.74%
Similarly, another work by Nayak et al. (Nayak et
al., 2023) featured a much higher dimensionality
feature set upon combining MFCC, Mel-
spectrogram, Spectral Contrast, Chromagram, and
Tonnetz features. These features were optimized by
GA so that the features traits of voice signals would
not go unnoticed. For this ML model, SVM was
applied with an accuracy as high as 94% on the PC-
GITA dataset. The current study underlined the
effectiveness of conventional ML models once
combined with optimized feature selection methods.
Meanwhile, Ibarra et al. (Ibarra et al., 2023)
applied deep learning by using Mel-spectrograms as
the input to the 2D CNN model. Their research was
done with the Neurovoz dataset, which has voice
recordings in many different languages; thus, it is
more diverse than PC-GITA on the one hand. The
model, however, performed worse, with a
performance accuracy of 74.9%. This decrease in the
accuracy could be due to difficulties the model has
faced with generalizing due to the various languages
and features of the voices. Nevertheless, the presented
study gave insight into the perspective of performing
a language-independent PD screening.
This work adopted a representation combining
MFCCs with their derivatives, STFT spectrograms,
and Mel-spectrograms. Adopting the SMOTE
technique to overcome the data imbalance and
GridSearch for hyperparameter tuning resulted in the
proposed XGBoost, trained on PC-GITA, reaching an
accuracy of 95%, outperforming the state-of-the-art
ML algorithms. On the other hand, our SVM model,
trained on Neurovoz, yielded an accuracy of 90.74%,
proving the benefits of using intense feature
extraction and balancing techniques.
Our approach tends to outperform other types in
the proposed PC-GITA dataset, showing the
effectiveness of incorporating ML with rich acoustic
features and a strong preprocessing technique. This
comparison underlines our approach's potential for
enhancing early PD detection by voice analysis and
ML.
5 CONCLUSION
The examination performed in this paper outlines the
capability of ML algorithms focused on SVM and
XGBoost for early detection of PD by analyzing
spectrograms extracted from speech recordings.
Feature extraction techniques were enhanced based
on MFCCs with their derivatives, STFT, and Mel-
Spectrograms combined with class balancing through
SMOTE and hyperparameter tuning via
GridSearchCV, allowing our models to produce
promising results for two datasets. XGBoost was the
top classifier with an AUC of 95% in the PC-GITA
dataset. On no account did SVM fail to prove its
worth in both datasets and qualify as one of the ideal
candidates for clinical usage. By applying LIME, the
interpretability of the models was advanced and
provided helpful insight into the most predictive
vocal features, catering to a significant requirement
for the model
's clinical deployment. Nonetheless,
variations in model performance across different
datasets outline the necessity of optimization for
particular datasets and further exploration of feature
extraction techniques. Subsequent efforts should
prioritize enhancing dataset variety, refining models,
and including more acoustic cues to augment
generalization and the precision of early PD detection
systems. These discoveries will facilitate the
development of non-invasive diagnostic instruments
that allow for early identification and prompt
intervention in PD.
A Comparative and Explainable Study of Machine Learning Models for Early Detection of Parkinson’s Disease Using Spectrograms
281

DATA AVAIBILITY STATEMENT
The PC-GITA and Neurovoz datasets are available
from the authors upon request.
REFERENCES
Badhan, P. K., & Kaur, M. (2024). Early Detection of
Parkinson Disease Throughbiomedical Speech and
Voice Analysis. International Journal on Soft
Computing, Artificial Intelligence and Applications,
13(1), 11–22. https://doi.org/10.5121/ijscai.2024.13102
Bind, S., Tiwari, A. K., & Sahani, A. K. (2015). A Survey of
Machine Learning Based Approaches for Parkinson
Disease Prediction. 6.
Bloem, B. R., Okun, M. S., & Klein, C. (2021). Parkinson’s
disease. The Lancet, 397(10291), 2284–2303.
https://doi.org/10.1016/S0140-6736(21)00218-X
Breiman, L. (2001). Random Forests. Machine Learning,
45(1), 5–32. https://doi.org/10.1023/A:1010933404324
Brownlee, J. (2020). Imbalanced Classification with
Python: Better Metrics, Balance Skewed Classes, Cost-
Sensitive Learning. Machine Learning Mastery.
Dorsey, E. R., Elbaz, A., Nichols, E., Abbasi, N., Abd-
Allah, F., Abdelalim, A., Adsuar, J. C., Ansha, M. G.,
Brayne, C., Choi, J.-Y. J., Collado-Mateo, D.,
Dahodwala, N., Do, H. P., Edessa, D., Endres, M.,
Fereshtehnejad, S.-M., Foreman, K. J., Gankpe, F. G.,
Gupta, R., … Murray, C. J. L. (2018). Global, regional,
and national burden of Parkinson’s disease, 1990–2016:
A systematic analysis for the Global Burden of Disease
Study 2016. The Lancet Neurology, 17(11), 939–953.
https://doi.org/10.1016/S1474-4422(18)30295-3
ffmpeg-normalize: Normalize audio via ffmpeg (Version
1.28.3). (n.d.). [Python]. Retrieved August 28, 2024,
from https://github.com/slhck/ffmpeg-normalize
Gullapalli, A. S., & Mittal, V. K. (2022). Early Detection of
Parkinson’s Disease Through Speech Features and
Machine Learning: A Review. In T. Senjyu, P. N.
Mahalle, T. Perumal, & A. Joshi (Eds.), ICT with
Intelligent Applications (pp. 203–212). Springer
Singapore.
Harel, B., Cannizzaro, M., & Snyder, P. J. (2004).
Variability in fundamental frequency during speech in
prodromal and incipient Parkinson’s disease: A
longitudinal case study. Brain and Cognition, 56(1),
24–29. https://doi.org/10.1016/j.bandc.2004.05.002
Ibarra, E. J., Arias-Londoño, J. D., Zañartu, M., & Godino-
Llorente, J. I. (2023). Towards a Corpus (and
Language)-Independent Screening of Parkinson’s
Disease from Voice and Speech through Domain
Adaptation. Bioengineering, 10(11), 1316.
https://doi.org/10.3390/bioengineering10111316
Jumanto, J., Rofik, R., Sugiharti, E., Alamsyah, A.,
Arifudin, R., Prasetiyo, B., & Muslim, M. A. (2024).
Optimizing Support Vector Machine Performance for
Parkinson’s Disease Diagnosis Using GridSearchCV
and PCA-Based Feature Extraction. Journal of
Information Systems Engineering and Business
Intelligence, 10(1), 38–50. https://doi.org/10.
20473/jisebi.10.1.38-50
Klempíř, O., & Krupička, R. (2024). Analyzing Wav2Vec
1.0 Embeddings for Cross-Database Parkinson’s
Disease Detection and Speech Features Extraction.
Sensors, 24(17), Article 17. https://doi.org/10.
3390/s24175520
Mendes-Laureano, J., Gómez-García, J. A., Guerrero-
López, A., Luque-Buzo, E., Arias-Londoño, J. D.,
Grandas-Pérez, F. J., & Godino-Llorente, J. I. (2024).
NeuroVoz: A Castillian Spanish corpus of parkinsonian
speech (arXiv:2403.02371). arXiv. http://arxiv.
org/abs/2403.02371
Mishra, S. P., Warule, P., & Deb, S. (2024). Speech emotion
recognition using MFCC-based entropy feature. Signal,
Image and Video Processing, 18(1), 153–161.
https://doi.org/10.1007/s11760-023-02716-7
Molnar, C. (2020). Interpretable Machine Learning.
Lulu.com.
Murman, D. (2012). Early treatment of Parkinson’s disease:
Opportunities for managed care. The American Journal
of Managed Care, 18, s183-8.
Nayak, S. S., Darji, A. D., & Shah, P. K. (2023).
Identification of Parkinson’s disease from speech signal
using machine learning approach. International
Journal of Speech Technology, 26(4), 981–990.
https://doi.org/10.1007/s10772-023-10068-3
Orozco-Arroyave, J. R., & Noth, E. (n.d.). New Spanish
speech corpus database for the analysis of people
suffering from Parkinson’s disease.
Wang, X., Chen, X., Wang, Q., & Chen, G. (2022). Early
Diagnosis of Parkinson’s Disease with Speech
Pronunciation Features Based on XGBoost Model.
2022 IEEE 2nd International Conference on Software
Engineering and Artificial Intelligence (SEAI), 209–
213. https://doi.org/10.1109/SEAI55746.2022.9832191
Wodzinski, M., Skalski, A., Hemmerling, D., Orozco-
Arroyave, J. R., & Nöth, E. (2019). Deep Learning
Approach to Parkinson’s Disease Detection Using
Voice Recordings and Convolutional Neural Network
Dedicated to Image Classification. 2019 41st Annual
International Conference of the IEEE Engineering in
Medicine and Biology Society (EMBC), 717–720.
https://doi.org/10.1109/EMBC.2019.8856972
Xuan, O. Z. (2023, April 24). Exploring the Short-Time
Fourier Transform: Analyzing Time-Varying
Audio Signals. Medium. https://medium.com/
@ongzhixuan/exploring-the-short-time-fourier-
transform-analyzing-time-varying-audio-signals-
98157d1b9a12.
ICPRAM 2025 - 14th International Conference on Pattern Recognition Applications and Methods
282
