
Comprehensive Evaluation of Regression and Classification Models on
Brain Stroke Datasets
Dimitar Trajkov, Ana Kostovska
a
, Pan
ˇ
ce Panov
b
and Dragi Kocev
c
Department of Knowledge Technologies, Jo
ˇ
zef Stefan Institute, Jamova cesta 39, Ljubljana, Slovenia
Keywords:
Brain Stroke, Scientific Benchmarking Study, Stroke Outcome Prediction, Data Quality in AI, AI
Transparency and Reproducibility.
Abstract:
This paper investigates the application of machine learning models for predicting brain stroke outcomes, lever-
aging publicly available datasets. We evaluate the performance of various classification and regression models,
including ensemble methods such as AdaBoost, Gradient Boosting, and Random Forest, across eight datasets
related to stroke prediction. Our results show that data quality and dataset characteristics have a more signifi-
cant impact on model performance than the choice of algorithm, underscoring the importance of high-quality,
well-curated data in achieving accurate and reliable predictions. Additionally, we emphasize the need for
transparency, reproducibility, and traceability in AI research, highlighting the challenges associated with the
scarcity of publicly available stroke datasets. This study provides a foundation for developing more trustwor-
thy AI tools for stroke prediction and encourages further efforts in data sharing and model validation.
1 INTRODUCTION
Brain stroke is a significant global health challenge,
ranking as one of the leading causes of mortality and
long-term disability. The World Stroke Organiza-
tion–Lancet Neurology Commission Stroke Collabo-
ration Group (Feigin et al., 2023) has projected that
the mortality will increase from 6.6 million people
worldwide in 2020 up to 9.7 million in 2050. Beyond
the mortality statistics, brain stroke leaves survivors
with debilitating effects (with disability-adjusted life
years rising from 144.8 millions to 189.3 millions),
severely impacting their quality of life. The ability to
accurately predict and prevent brain strokes through
accessible and straightforward measures can revolu-
tionize public health strategies, especially in low- and
middle-income regions where healthcare resources
are often limited and the burden of stroke is most pro-
nounced.
In today’s data-driven era, the scarcity of publicly
available clinical datasets on brain stroke presents a
critical barrier to advancing research and developing
effective predictive models. Hospitals and medical
institutions, governed by privacy regulations and the
a
https://orcid.org/0000-0002-5983-7169
b
https://orcid.org/0000-0002-7685-9140
c
https://orcid.org/0000-0003-0687-0878
imperative to protect patient confidentiality, are often
hesitant to share datasets, even in anonymized forms.
Therefore, even the few publicly available datasets are
from unknown and unverified sources with no possi-
bility to check their validity.
Brain stroke (Zheng et al., 2022) is influenced by
both non-modifiable factors, such as age, genetic pre-
disposition, and gender, with men generally at higher
risk and women more vulnerable during pregnancy
and postpartum, and modifiable factors that can be
managed through lifestyle changes and medical inter-
ventions. Key modifiable risk factors include hyper-
tension, high cholesterol, diabetes, obesity, smoking,
atrial fibrillation, and heart-related issues, which can
lead to ischemic strokes. Physical inactivity, exces-
sive alcohol consumption, and poor diet further ele-
vate stroke risk, making prevention through lifestyle
modification essential for reducing the overall stroke
burden.
The need for the use of AI in analyzing brain
stroke data is highlighted by its ability to handle the
complexity and volume of medical data, including
clinical and imaging data, that traditional methods
cannot efficiently process (Zheng et al., 2022; Colan-
gelo et al., 2024; Wang et al., 2020; Feigin et al.,
2023; Romoli and Caliandro, 2024). AI models, par-
ticularly machine learning (ML), are being used to
predict stroke outcomes by processing large datasets
Trajkov, D., Kostovska, A., Panov, P. and Kocev, D.
Comprehensive Evaluation of Regression and Classification Models on Brain Stroke Datasets.
DOI: 10.5220/0013184800003911
Paper published under CC license (CC BY-NC-ND 4.0)
In Proceedings of the 18th International Joint Conference on Biomedical Engineering Systems and Technologies (BIOSTEC 2025) - Volume 2: HEALTHINF, pages 631-638
ISBN: 978-989-758-731-3; ISSN: 2184-4305
Proceedings Copyright © 2025 by SCITEPRESS – Science and Technology Publications, Lda.
631

with precision, which can help clinicians make more
informed decisions. AI aids in diagnosing and pre-
dicting the progression of stroke, improving treatment
response predictions, and supporting early interven-
tions that are crucial for stroke recovery and preven-
tion.
AI-driven predictive models have been designed
to learn from stroke data to forecast outcomes such
as mortality, functional impairment, and recovery po-
tential. ML models like support vector machines, ran-
dom forests, and neural networks have been employed
to predict key outcomes using structured clinical data.
These models not only provide personalized prog-
noses but also have the potential to improve patient
care by identifying high-risk individuals early. How-
ever, challenges remain in integrating these models
into clinical practice due to issues like small datasets
and poor reporting standards in existing studies.
For AI to become a trustworthy resource in stroke
care, transparency, reproducibility, and traceability
are essential. There is a growing demand for the
reproducibility of AI-based research, which is nec-
essary to ensure that models can be independently
validated and applied to different patient populations.
In this work, we are making the first step towards
providing such trustworthy resources for brain stroke
data.
Data and Code Availability: To ensure repro-
ducibility, we have made both the data and the code
used in our experiments publicly accessible., which
can be found at: https://github.com/DimitarTrajkov/
DataModel-Analyzer.
2 DATA AND METHOD
DESCRIPTION
In our study, we collected a total of 8 publicly avail-
able (tabular) datasets related to brain stroke: four
regression datasets and four classification datasets.
Of the classification datasets, two are binary classi-
fication datasets, and two address multi-class classi-
fication problems. Five of the datasets were found
at the repository Data.World, and 3 at the reposi-
tory Kaggle. Table 1 provides an overview of the
datasets used in this study. It includes the names of
the datasets, the number of instances, the number of
features, and specifies whether each dataset is used
for a classification (C) or regression (R) task.
We evaluated the performance of a broad spec-
trum of models implemented in the scikit-learn
toolbox (Pedregosa et al., 2011) to explore differ-
ent approaches to prediction and analysis. For the
classification datsets, we utilized the following dif-
ferent methods. First, we used ensemble meth-
ods, such as AdaBoostClassifier, BaggingClassi-
fier, RandomForestClassifier, GradientBoosting-
Classifier, XGBClassifier (from the XGBoost li-
brary), and LightGBMClassifier, for their ability
to improve predictive accuracy by combining mul-
tiple weak learners. These models are particularly
effective in capturing complex, non-linear relation-
ships in the data. We also incorporated linear models
like LogisticRegression, which are valued for their
interpretability and simplicity. Other classifiers in-
cluded DecisionTreeClassifier, KNeighborsClassi-
fier, MLPClassifier, QuadraticDiscriminantAnal-
ysis, RadiusNeighborsClassifier, SGDClassifier,
and SupportVectorClassifier (SVC), each contribut-
ing unique strengths to the classification tasks.
For the regression datasets, we also evalu-
ated a variety of models. Similarly as for the
classification datasets, we used different ensem-
ble methods such as AdaBoostRegressor, Baggin-
gRegressor, RandomForestRegressor, Gradient-
BoostingRegressor, HistGradientBoostingRegres-
sor, LightGBMRegressor, and XGBoostRegres-
sor (from the XGBoost library). Linear mod-
els, including LinearRegression, RidgeRegression,
LassoRegression, LassoLars, ElasticNetRegres-
sion, BayesianRidgeRegression, TheilSenRegres-
sor, HuberRegressor, RAN-SACRegressor, Pas-
siveAggressiveRegressor, SGDRegressor, Least-
AngleRegression, and OrthogonalMatchingPur-
suit, were employed for their simplicity and effec-
tiveness in datasets with linear relationships. Ad-
ditionally, GaussianProcessRegressor and KNeigh-
borsRegressor were included to capture local data
structures and model complex relationships, while
MLPRegressor was used for its deep learning capa-
bilities. Finally, we explored the performance some
specific regressors such as OrdinalRegression (from
the mord library) and TweedieRegressor.
3 DESIGN OF THE
EXPERIMENTAL STUDY
Figure 1 illustrates the design of the executed exper-
imental study. After identification and categorization
of relevant datasets and separating them into regres-
sion and classification tasks based on the target vari-
able, we manually examined each dataset to identify
those that required manual preprocessing. The pre-
processing steps included several standard procedures
applied across all datasets: removal of features with
constant values for all examples or missing values for
HEALTHINF 2025 - 18th International Conference on Health Informatics
632
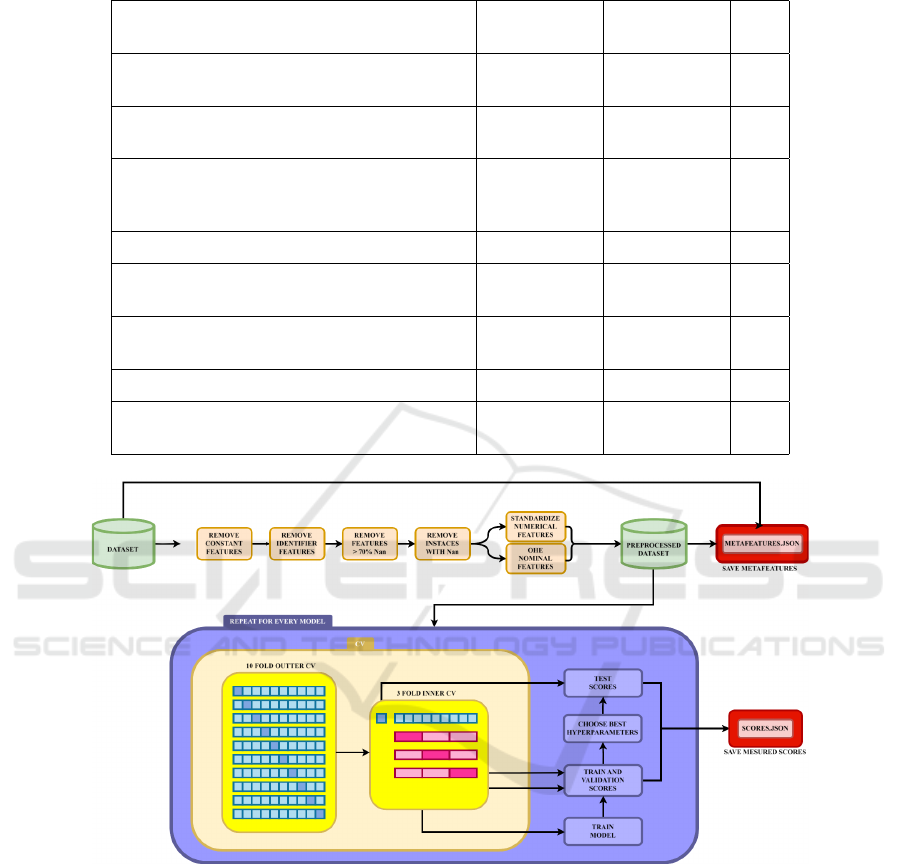
Table 1: Datasets used in the study with hyperlinks, number of instances, features, and task type regression (R) and classifi-
cation (C).
Dataset Name
Num. of
Instances
Num. of
Features
Task
Ischemic Stroke 30-Day Mortality and 30-Day
Readmission Rates(Health and Services, 2018)
2188 10 R
Stockport Local Health
Characteristics(data.world’s Admin, 2021)
190 18 R
All Payer In-Hospital/30-Day Acute Stroke
Mortality Rates by Hospital
(SPARCS)(health.data.ny.gov, 2019)
137 14 R
Brain Stroke Dataset(Md, 2022) 600 9 C
Brain stroke prediction dataset(Pathan et al.,
2020)
4981 11 C
Cerebral Stroke Prediction-Imbalanced
Dataset(Liu et al., 2019)
43400 12 C
Mortality from Stroke(England, 2022) 231 9 R
Prognostication of Recovery from Acute
Stroke (PRAS Dataset)(Statsenko et al., 2022)
161 110 C
Figure 1: An overview of the procedures used to execute the experimental study including the preprocessing steps, hyperpa-
rameter optimization with nested cross-validation, and the calculation of the meta-features of the datasets.
more than 70% of the examples, removal of identi-
fiers, standardization of the numeric features (to mean
values zero with standard deviation of one), one-hot
encoding for nominal features, and mapping of val-
ues for the ordinal features.
Following the data preprocessing, we executed an
exhaustive grid search across a broad spectrum of hy-
perparameter values, using nested 3-cross-validation
to select the optimal parameter configurations (using
the mean squared error for the regression datasets, and
the F1 score for the classification datasets). Nested
cross-validation was chosen for its ability to provide
an unbiased evaluation of the model’s performance by
incorporating both an inner loop (3-fold) for hyperpa-
rameter tuning and an outer loop (10-fold) for model
evaluation. The performance of the models was as-
sessed using a variety of evaluation measures such as
accuracy, balanced accuracy, precision, average pre-
cision, recall, F1 score, jaccard score, fowlkes mal-
lows score, cohen kappa score, matthews correlation
coefictien and others for clasification tasks and mean
absolute error, mean squared error, median absolute
Comprehensive Evaluation of Regression and Classification Models on Brain Stroke Datasets
633
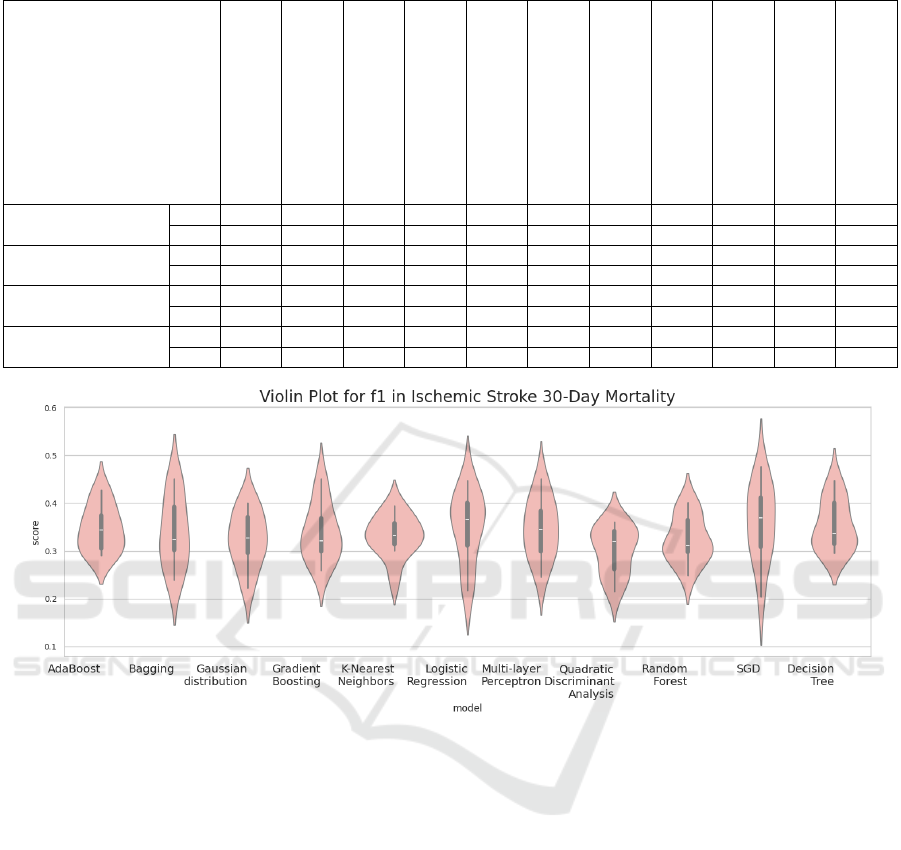
Table 2: Mean and standard deviation of F1 scores for each model across classification datasets.
Dataset
AdaBoost
Bagging
Decision Tree
Gaussian distribution
Gradient Boosting
KNN
Logistic Regression
Multi-layer Perceptron
Quadratic Discriminant Analysis
Random Forest
SGD
Brain Stroke Dataset
Mean 1.000 0.986 0.736 0.470 1.000 0.395 0.773 0.732 0.430 1.000 0.951
Std 0.000 0.042 0.127 0.117 0.000 0.130 0.121 0.093 0.090 0.000 0.101
Brain stroke predictic..
Mean 0.347 0.340 0.354 0.324 0.339 0.332 0.349 0.347 0.301 0.324 0.359
Std 0.053 0.042 0.049 0.036 0.048 0.037 0.048 0.047 0.045 0.041 0.057
Cerebral Stroke Pred..
Mean 0.246 0.229 0.207 0.172 0.248 0.096 0.233 0.129 0.129 0.252 0.215
Std 0.074 0.041 0.054 0.038 0.073 0.026 0.089 0.066 0.066 0.073 0.097
Prognostication of..
Mean 0.097 0.089 0.090 0.037 0.101 0.048 0.080 0.016 0.030 0.105 0.078
Std 0.018 0.014 0.017 0.007 0.018 0.014 0.017 0.019 0.010 0.023 0.020
Figure 2: Violin plot of the F1 scores from the Brain Stroke Dataset.
error, mean percentage error, relative squared error,
theil’s u statistic and much more for the regression
tasks.
Furthermore, to facilitate deeper insights into the
data and model performance, we calculated a vari-
ety of meta-features describing the datasets. These
included basic features such as the number of in-
stances, features, and the proportion of numeric, nom-
inal, binary, and constant features, then also statisti-
cal meta-features like geometric, harmonic, and arith-
metic means, median, standard deviation, as well as
theoretical meta-features such as entropy, correlation,
principal component analysis (PCA), and mutual in-
formation and more.
All of the information about the experimental pro-
cedures and the specific experiments on the datasets
using the selected methods are diligently documented
in a JSON file. This facilitates traceability and repro-
ducibility of the executed experiments.
4 RESULTS AND DISCUSSION
Table 2 lists the performance of all models on the
classification datasets, as measured by the F1 score.
The overall impression is that the obtained perfor-
mances are comparable, with only marginal differ-
ences observed. Ensemble models generally per-
formed slightly better, with AdaBoost and Gradi-
ent Boosting leading the way in terms of F1 score.
Conversely, K-Nearest Neighbors (KNN) showed the
lowest performance in this regard. In addition to the
F1 score, other evaluation metrics exhibit similar pat-
terns, highlighting their high correlation with each
other (as illustrated in Figure 3). This correlation sug-
gests that if a model excels in one metric, it is likely
to perform consistently well across other metrics as
well. Figure 2 presents a violin plot of the F1 scores
evaluated on the test data from the Brain Stroke
Dataset (Md, 2022), providing a visual representa-
HEALTHINF 2025 - 18th International Conference on Health Informatics
634
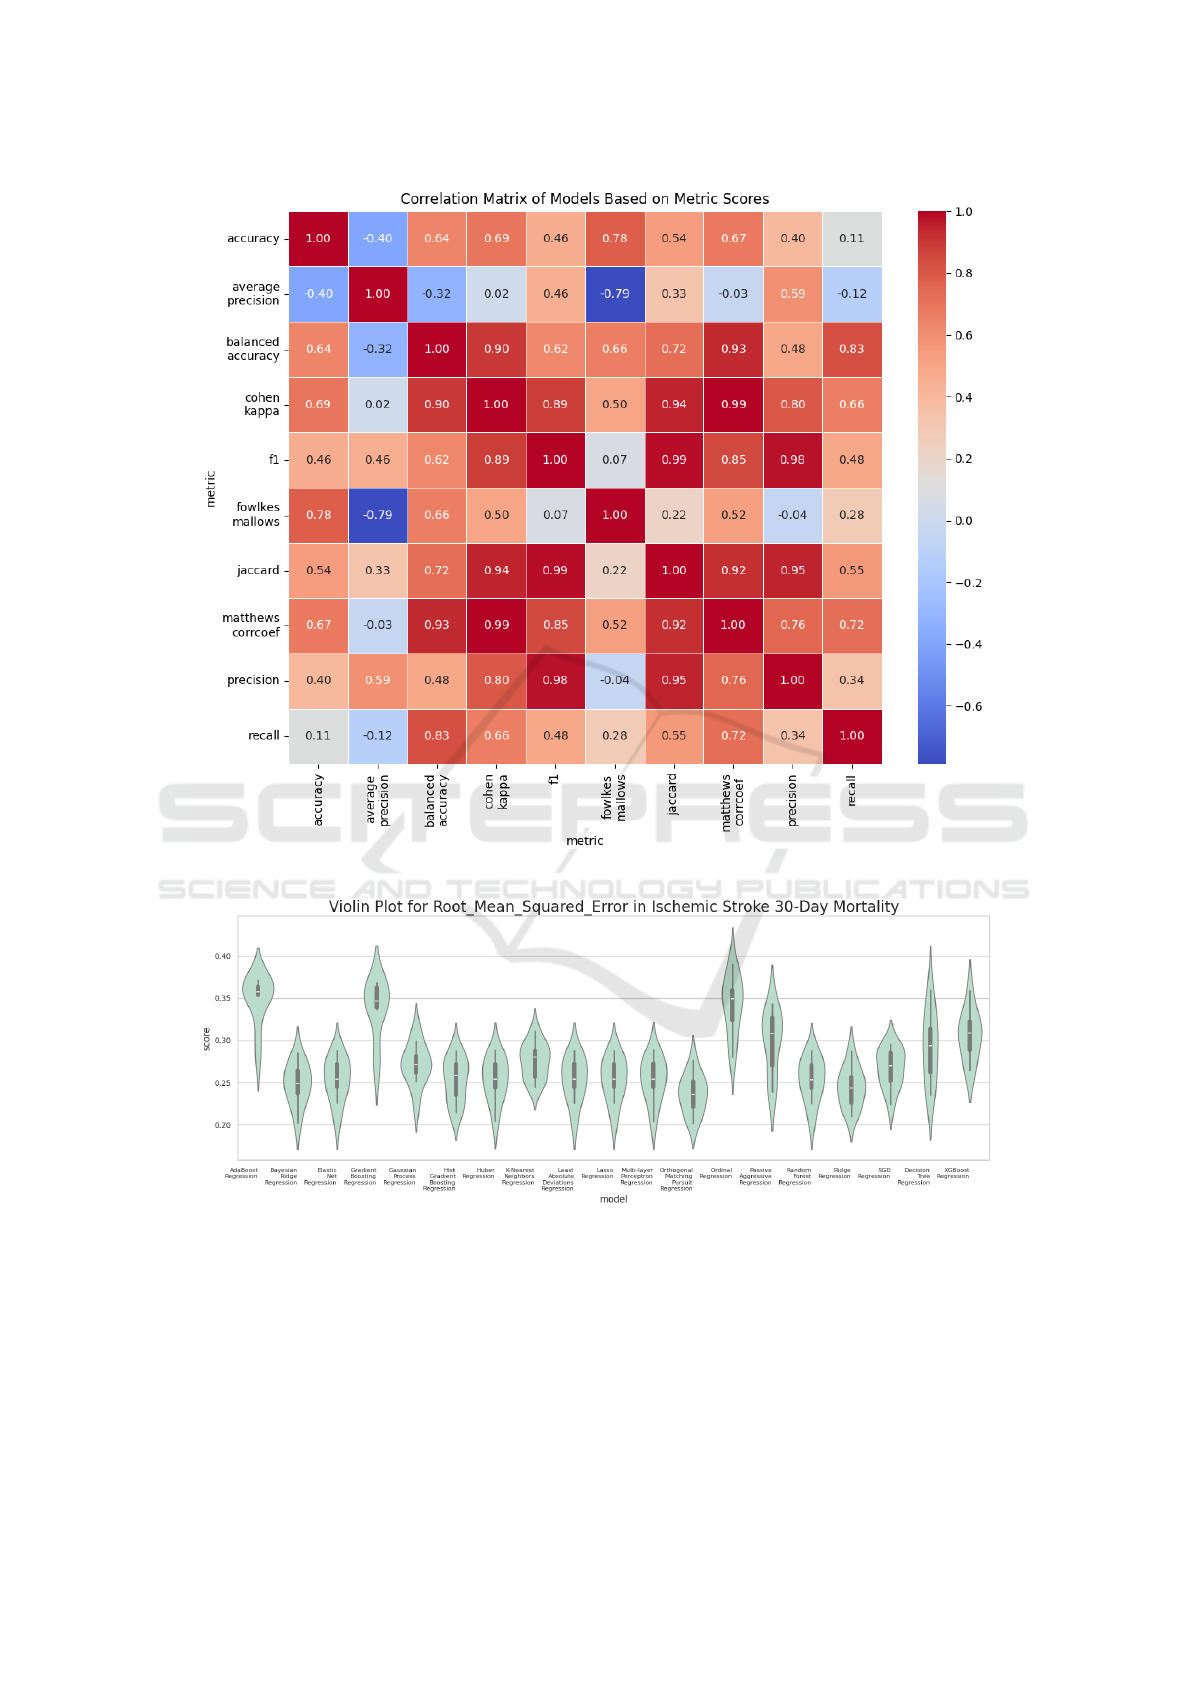
Figure 3: Correlation matrix between classification metrics.
Figure 4: Violin plot of the RMSE scores from Ischemic Stroke 30-Day Mortality.
tion of the distribution and variability in model perfor-
mance. Visualizations of additional performance met-
rics are available on Figshare (Trajkov et al., 2024).
Table 3 presents the results obtained for the re-
gression tasks using the Root Mean Squared Error
(RMSE). We can observe that Huber Regression and
Bayesian Ridge Regression emerged as the top per-
formers, achieving the lowest RMSE values. In con-
trast, SGD Regression exhibited the weakest perfor-
mance, with the highest RMSE score. Unlike the clas-
sification tasks, where the models showed more uni-
formity, the regression models were more dispersed
in their performance – Figure 4 presents a violin plot
of the RMSE scores evaluated on the test data from
Comprehensive Evaluation of Regression and Classification Models on Brain Stroke Datasets
635
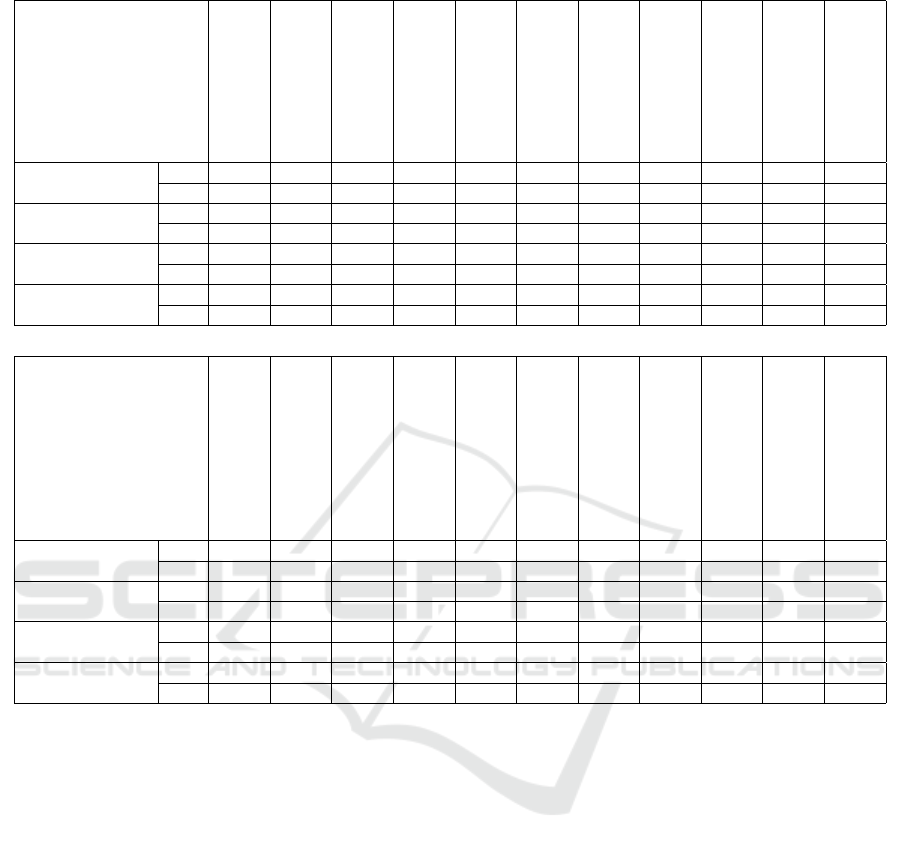
Table 3: Mean and standard deviation of RMSE for each model across regression datasets.
Dataset
AdaBoost
Bayesian Ridge
Decision Tree
Elastic Net
Gaussian Process
Gradient Boosting
Hist Gradient Boosting
Huber
KNN
Lasso
Least Absolute Deviations
Ischemic Stroke 30-D..
mean 0.348 0.248 0.292 0.254 0.271 0.338 0.253 0.254 0.276 0.254 0.254
std 0.030 0.025 0.042 0.026 0.025 0.035 0.026 0.026 0.021 0.026 0.026
Stockport Local Heal..
mean 9.920 7.718 12.300 11.725 13.724 13.838 11.301 8.131 11.178 11.725 11.725
std 1.903 1.121 2.232 2.573 3.813 2.694 2.443 1.071 2.679 2.573 2.573
All Payer In-Hospita..
mean 3.074 0.689 3.437 4.233 0.793 3.762 3.254 0.678 2.034 4.233 4.233
std 0.705 0.314 0.760 0.784 0.734 0.897 0.722 0.293 0.408 0.784 0.784
Mortality from Stroke
mean 30.701 14.626 1.68e2 1.52e2 22.877 1.85e2 1.58e2 13.772 1.89e2 1.54e2 1.54e2
std 3.980 6.519 2.98e1 3.06e1 13.947 5.06e1 5.68e1 7.553 5.10e1 3.08e1 3.08e1
Dataset
Linear
Multi-layer Perceptron
Ordinal
Orthogonal Matching Pursuit
Passive Aggressive
Random Forest
Ridge
SGD
Support Vector
TheilSen
XGBoost
Ischemic Stroke 30-D..
mean 9.28e10 0.253 0.342 0.237 0.298 0.253 0.244 0.267 2.33e4 2.15e9 0.306
std 8.46e10 0.026 0.035 0.023 0.037 0.026 0.024 0.023 1.15e3 7.41e8 0.030
Stockport Local Heal..
mean 35.438 33.213 7.936 8.450 13.051 10.498 7.906 33.241 2.49e3 7.963 12.659
std 2.859 3.168 1.103 1.388 2.910 2.249 1.074 3.703 3.67e2 1.088 2.095
All Payer In-Hospita..
mean 0.793 13.401 0.813 0.691 0.743 4.044 0.723 14.325 1.41e3 0.731 4.441
std 0.222 1.399 0.323 0.517 0.253 0.752 0.344 1.516 2.62e2 0.265 0.793
Mortality from Stroke
mean 14.681 169.666 43.139 15.334 22.506 141.612 43.129 172.469 1.47e3 14.578 156.072
std 6.479 41.681 15.817 7.799 3.022 29.203 15.853 42.031 3.57e2 6.624 38.728
the Ischemic Stroke 30-Day Mortality and 30-Day
Readmission Rates (Health and Services, 2018), pro-
viding a visual representation of the distribution and
variability in model performance. There is a greater
variation between models and metrics, with less cor-
relation between them (as shown in Figure 5). This in-
dicates that certain models may perform significantly
better than others depending on the data and the eval-
uation metric used. Violin plot visualizations of ad-
ditional regression performance metrics are available
on Figshare (Trajkov et al., 2024).
5 CONCLUSIONS
In conclusion, our study demonstrates that the perfor-
mance of AI models in predicting brain stroke out-
comes is highly dependent on the quality and charac-
teristics of the datasets used, rather than the choice of
the model itself. Through the evaluation of multiple
classification and regression models, we observed that
while ensemble methods like AdaBoost and Gradient
Boosting tended to perform slightly better in classifi-
cation tasks, the variability between models was min-
imal across most metrics. However, in the regression
tasks, there was a more significant performance dis-
persion among the models, with some, like Huber Re-
gression and Bayesian Ridge Regression, outperform-
ing others, such as SGD Regression. This suggests
that for brain stroke prediction, focusing on the se-
lection of high-quality datasets is essential to enhance
model accuracy and reliability.
Furthermore, the study highlights the importance
of transparency, reproducibility, and traceability in AI
model development for brain stroke analysis. By doc-
umenting experimental procedures and datasets in a
structured, reproducible format, we can ensure that
future research in this area can be independently val-
idated and applied across different patient popula-
tions. Our findings emphasize the need for trustwor-
thy, well-curated datasets and standardized method-
HEALTHINF 2025 - 18th International Conference on Health Informatics
636
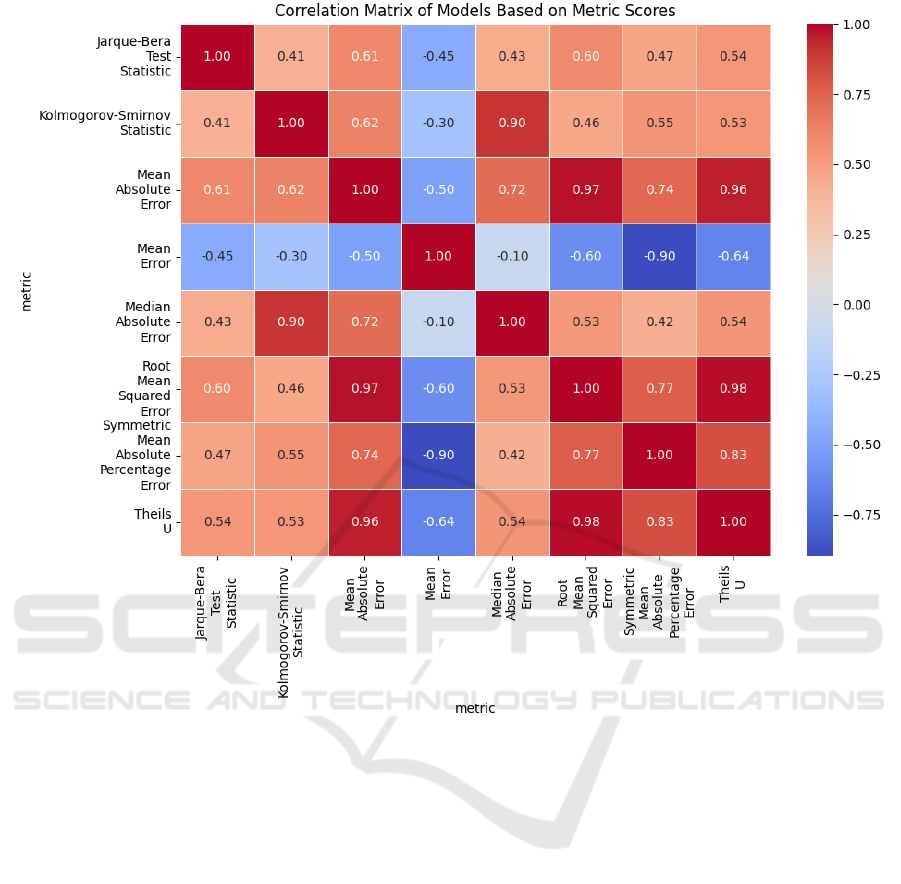
Figure 5: Correlation matrix between regression metrics.
ologies to ensure that AI models in stroke prediction
can achieve real-world clinical impact, ultimately im-
proving public health strategies aimed at stroke pre-
vention and recovery.
ACKNOWLEDGEMENTS
This work was suported by HE TRUSTroke project.
This project is funded by the European Union
in the call HORIZON-HLTH-2022-STAYHLTH-01-
two-stage under grant agreement No 101080564.
REFERENCES
Colangelo, G., Ribo, M., Montiel, E., Dominguez, D.,
Oliv
´
e-Gadea, M., Muchada, M.,
´
Alvaro Garcia-
Tornel, Requena, M., Pagola, J., Juega, J., Rodriguez-
Luna, D., Rodriguez-Villatoro, N., Rizzo, F., Taborda,
B., Molina, C. A., and Rubiera, M. (2024). Prerisk: A
personalized, artificial intelligence–based and statisti-
cally–based stroke recurrence predictor for recurrent
stroke. Stroke, 55(5):1200–1209.
data.world’s Admin (2021). Stockport local health char-
acteristics. https://data.world/datagov-uk/0cb6045e-
f44f-4dcb-814b-b97840cc80c3.
England, N. (2022). Mortality from stroke:
crude death rate, by age group, 3-year av-
erage, mfp. https://digital.nhs.uk/data-and-
information/publications/statistical/compendium-
mortality/current/mortality-from-stroke/mortality-
from-stroke-crude-death-rate-by-age-group-3-year-
average-mfp.
Feigin, V. L., Owolabi, M. O., and on behalf of the
World Stroke Organization–Lancet Neurology Com-
mission Stroke Collaboration Group (2023). Prag-
matic solutions to reduce the global burden of stroke:
a world stroke organization–¡em¿lancet neu-
rology¡/em¿ commission. The Lancet Neurology,
22(12):1160–1206.
Health, C. and Services, H. (2018). Ischemic
stroke 30-day mortality and 30-day readmis-
Comprehensive Evaluation of Regression and Classification Models on Brain Stroke Datasets
637

sion rates and quality ratings for ca hospitals.
https://data.world/chhs/06ed38d3-b047-4ae2-aa00-
2e43b5491d6e.
health.data.ny.gov (2019). All payer in-hospital/30-day
acute stroke mortality rates by hospital (sparcs): Be-
ginning 2013. https://data.world/healthdatany/r29i-
yr49.
Liu, T., Fan, W., and Wu, C. (2019). Data for a hybrid
machine learning approach to cerebral stroke predic-
tion based on imbalanced medical-datasets. Mendeley
Data, V1.
Md, S. (2022). Brain stroke dataset.
https://data.world/researchersj/brain-stroke-dataset.
Pathan, M. S., Jianbiao, Z., John, D., Nag, A., and Dev, S.
(2020). Identifying stroke indicators using rough sets.
IEEE Access, 8:210318–210327.
Pedregosa, F., Varoquaux, G., Gramfort, A., Michel, V.,
Thirion, B., Grisel, O., Blondel, M., Prettenhofer,
P., Weiss, R., Dubourg, V., Vanderplas, J., Passos,
A., Cournapeau, D., Brucher, M., Perrot, M., and
Duchesnay, E. (2011). Scikit-learn: Machine learning
in Python. Journal of Machine Learning Research,
12:2825–2830.
Romoli, M. and Caliandro, P. (2024). Artificial intelli-
gence, machine learning, and reproducibility in stroke
research. European Stroke Journal, 9(3):518–520.
Statsenko, Y., Zahmi, F. A., Szolics, M., and Ko-
teesh, J. A. (2022). Prognostication of re-
covery from acute stroke (pras dataset).
https://data.mendeley.com/datasets/y86srgks26/1.
Trajkov, D., Kostovska, A., Panov, P., and Kocev, D.
(2024). Violin plots showcasing various metrics for
different models applied to the classification and
regression tasks on ”brain stroke dataset”. Available
at: https://figshare.com/articles/figure/Violin plot
of the Accuracy scores from Brain Stroke Dataset/
28070000/3.
Wang, W., Kiik, M., Peek, N., Curcin, V., Marshall, I. J.,
Rudd, A. G., Wang, Y., Douiri, A., Wolfe, C. D., and
Bray, B. (2020). A systematic review of machine
learning models for predicting outcomes of stroke
with structured data. PLOS ONE, 15(6):1–16.
Zheng, Y., Guo, Z., Zhang, Y., Shang, J., Yu, L., Fu, P., Liu,
Y., Li, X., Wang, H., Ren, L., et al. (2022). Rapid
triage for ischemic stroke: a machine learning-driven
approach in the context of predictive, preventive and
personalised medicine. EPMA Journal, 13(2):285–
298.
HEALTHINF 2025 - 18th International Conference on Health Informatics
638
