
ASTELCO: An Augmented Sparse Time Series Dataset with Generative
Models
Manuel S
´
anchez-Laguardia
a
, Gast
´
on Garc
´
ıa Gonz
´
alez, Emilio Martinez
b
, Sergio Martinez,
Alicia Fern
´
andez
c
and Gabriel G
´
omez
d
Facultad de Ingenier
´
ıa, Universidad de la Rep
´
ublica, Uruguay
fi
Keywords:
Sparse Time Series, GAN, VAE, Data Augmentation.
Abstract:
In recent years, there has been significant growth in the application of deep learning methods for classification,
anomaly detection, and forecasting of time series. However, only some studies address problems involving
sparse or intermittent demand time series, since the availability of sparse databases is scarce. This work
compares the performance of three data augmentation approaches based on generative models and provides
the code used to generate synthetic sparse and non-sparse time series. The experiments are carried out us-
ing a newly created sparse time series database, ASTELCO, which is generated from real e-commerce data
(STELCO) supplied by a mobile Internet Service Provider. For the sake of reproducibility and as an additional
contribution to the community, we make both the STELCO and ASTELCO datasets publicly available, and
openly release the implemented code.
1 INTRODUCTION
Data augmentation has shown to be a helpful strat-
egy for obtaining deep learning models with greater
generalization capacity. This is especially crucial
when tackling classification, anomaly detection, or
forecasting problems involving time series (Iglesias
et al., 2023; Wen et al., 2020). Efficient model
design requires datasets with appropriate granularity
and history to accurately capture distributions, tempo-
ral correlations, and relationships between univariate
series in the context of multiple time series (Iglesias
et al., 2023). The availability of varied databases, has
been especially useful for training foundation models,
which benefit from diverse datasets from domains,
and achieve the capacity to perform well in zero-shot
prediction scenarios (Gonz
´
alez et al., 2024).
Despite the recent increase in research on time se-
ries analysis, public access to databases derived from
monitoring the operation of real systems, with labeled
data, is not so frequent, particularly when addressing
the detection of anomalies in sparse or intermittent
demand series.
a
https://orcid.org/0009-0005-0149-2726
b
https://orcid.org/0009-0005-8418-0006
c
https://orcid.org/0000-0003-2905-2210
d
https://orcid.org/0000-0002-4213-8791
Sparse time series are characterized by non-zero
values that appear sporadically in time, with the re-
maining of the values being 0. This inherent prop-
erty, coupled with the variability in the occurrence
patterns across different series, poses significant chal-
lenges for forecasting (Makridakis et al., 2022). In
anomaly detection, such series present an additional
difficulty for detection algorithms, which often ex-
hibit reduced performance compared to more active
series (Renz et al., 2023).
The lack of more research focusing on this type of
data is likely due to the limited availability of such
data for training and evaluating models. Previous
studies have demonstrated the effectiveness of Gener-
ative Adversarial Networks (GANs) and Variational
Auto-Encoders (VAEs) in generating synthetic data
from real data. For instance, (Yoon et al., 2019) pro-
posed a GAN-based architecture and a comprehen-
sive performance evaluation method, which we will
consider as a primary reference for our work. The
study evaluated performance using four metrics. Sim-
ilarly, (Desai et al., 2021) introduced a VAE-based ar-
chitecture, which is compared with previous metrics
and other architectures (Esteban et al., 2017), show-
ing comparable quantitative performance.
This work addresses the challenge of generating
a synthetic sparse dataset through data augmentation
techniques, with the aim of providing a novel dataset
Sánchez-Laguardia, M., García González, G., Martinez, E., Martinez, S., Fernández, A. and Gómez, G.
ASTELCO: An Augmented Sparse Time Series Dataset with Generative Models.
DOI: 10.5220/0013185900003905
In Proceedings of the 14th International Conference on Pattern Recognition Applications and Methods (ICPRAM 2025), pages 283-290
ISBN: 978-989-758-730-6; ISSN: 2184-4313
Copyright © 2025 by Paper published under CC license (CC BY-NC-ND 4.0)
283
to the academic community.
This research benefited from the collaboration
with the e-commerce division of a mobile Internet
Service Provider (ISP), which supplied a real diverse
dataset, STELCO, employed in the synthetic genera-
tion process.
In this work, we contribute with the publication
of a database with sparse intermittent demand se-
ries, ASTELCO, generated from real data, STELCO,
using TimeGAN (Yoon et al., 2019) and DC-VAE
(Garc
´
ıa Gonz
´
alez et al., 2022). The latter is a model
that has shown good performance in continuous series
reconstruction and the application of anomaly detec-
tion in continuous data. The following sections de-
scribe and compare the STELCO database with other
available databases. Then, the characteristics and
configurations of the models used to generate the data
augmentation based on TimeGAN and DC-VAE are
briefly described. Finally, the performance of the gen-
erated databases is evaluated.
2 SPARSE STELCO DATASET
This section describes STELCO, a new open sparse
dataset released to the community.
This dataset comprises records of invoices gener-
ated through the ISP’s online commerce platform, en-
compassing various payment methods. Notably, cer-
tain payment methods show high levels of activity,
whereas others show very little, thereby introducing
a diverse range of behaviors to the whole.
In Table 1, a comparison between a set of pub-
licly available databases (Fan et al., 2023) and our
STELCO database is presented. The measure pre-
sented in Equation (1) was employed to assess the
sparsity of the series.
sparsity = 1 −
count nonzero(A)
total elements(A)
. (1)
Given the nature of the data in STELCO, which
reflects transactions conducted at an online commerce
platform, in instances where no transactions occur, no
records are generated. As a result, there is an absence
of null values within the dataset.
To address this issue, a resampling procedure, us-
ing the mean time difference between samples, was
implemented prior to the computation of sparsity for
datasets exhibiting this characteristic.
This approach effectively introduced null values
into the dataset, allowing for a more meaningful cal-
culation of sparsity.
In Table 1, it can be noted that the STELCO
dataset has the shortest time interval and the largest
number of samples.
To facilitate the subsequent analysis of our data,
three groups of series were formed, defining them
from the lowest to the highest volume of transactions.
The first group (low) contains the series with the low-
est number of transactions, the second group (mid)
series with an average volume of transactions and the
third group (high) series with the highest volume of
transactions. To match the number of values in each
group with an appropriate sampling frequency, we
chose to resample the groups at intervals of 1 hour,
5 minutes and 1 minute, respectively. Thus, the num-
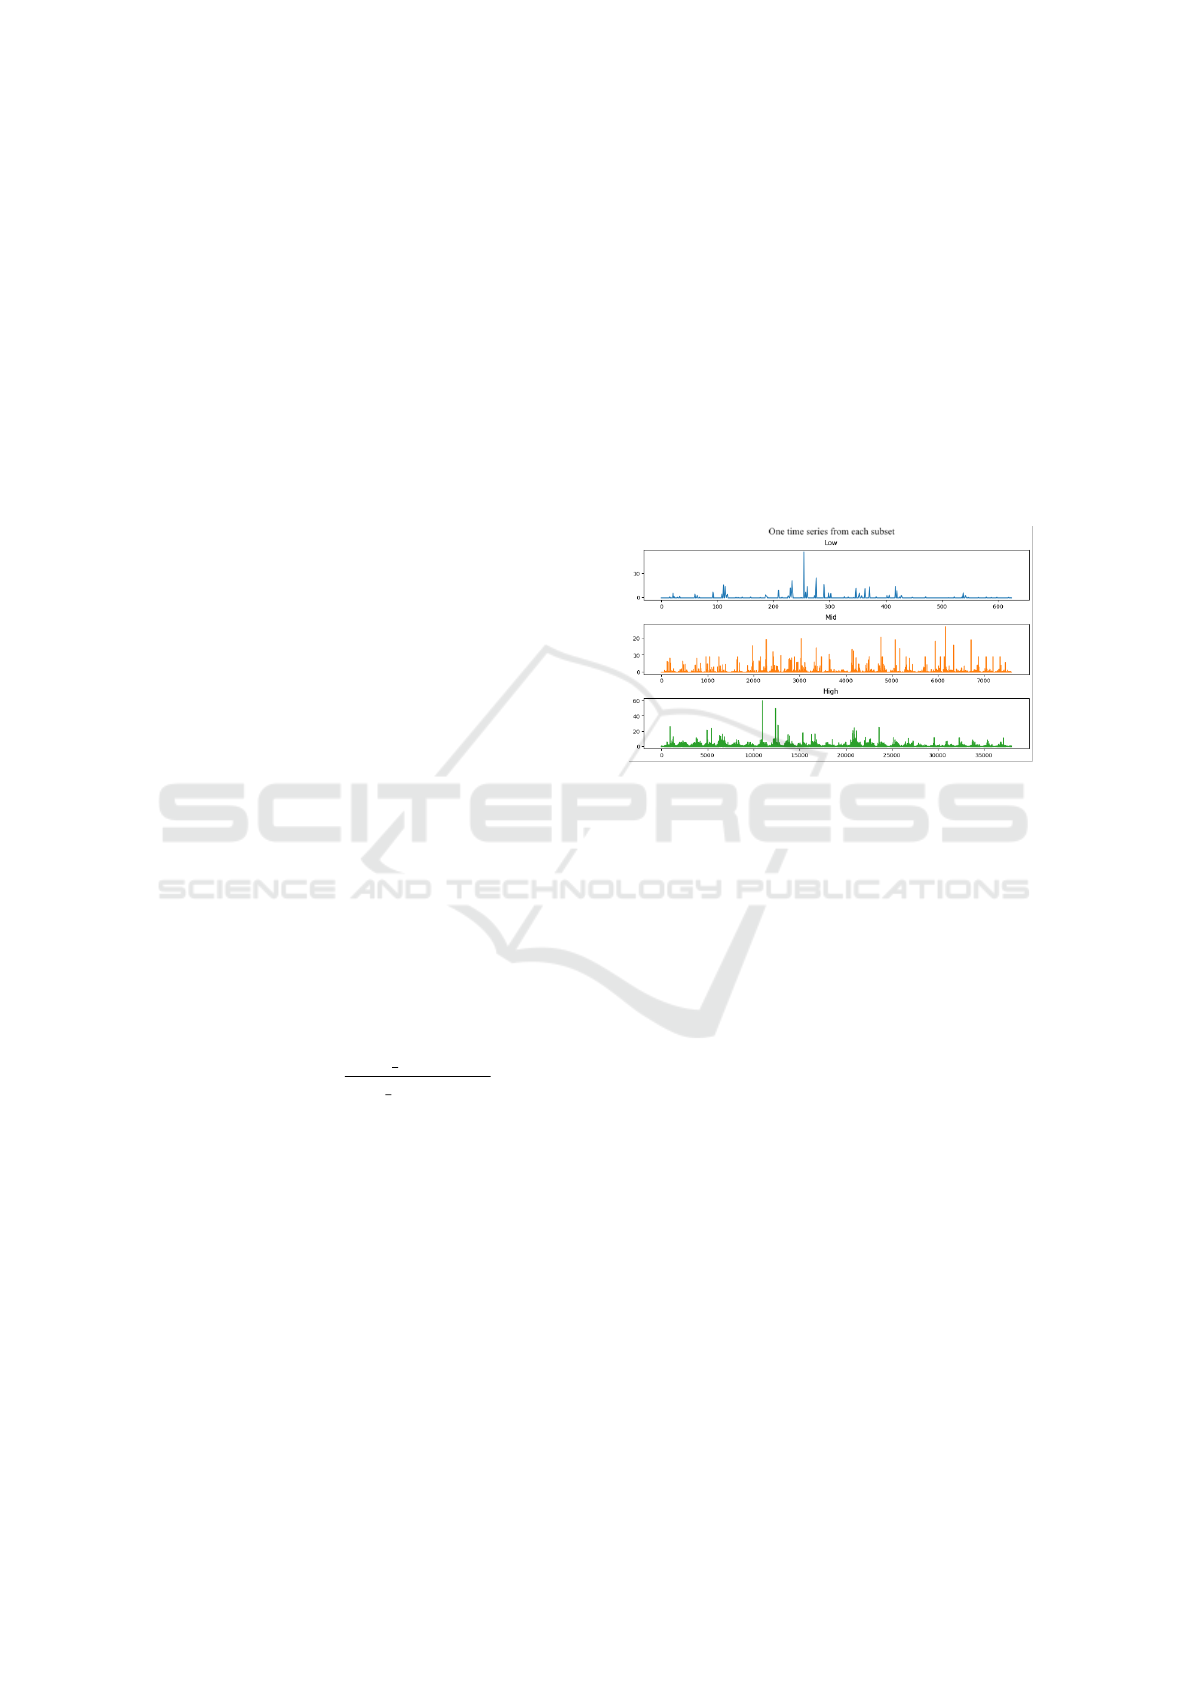
ber of values varied for each group accordingly: 625
values for the low dataset, 7,600 values for the mid
dataset and 38,000 values for the high dataset.
Figure 1: Example of three different time series from our
dataset, sampled at different frequencies: 1 hour, 5 min and
1 min, respectively.
All the series in our set were standardized in order
to preserve the confidentiality of the data. With these
three sub-groups of series, the analyses presented be-
low were carried out. An example of a series from
each group is shown in Figure 1.
3 DATA AUGMENTATION
To generate synthetic data from the utilized dataset,
a comprehensive analysis of various existing methods
was conducted, with the objective of implementing
these techniques in the context of sparse time series
(Iglesias et al., 2023)(Wang et al., 2022). Among the
methods employed in this study were TimeGAN and
DC-VAE.
3.1 GAN-Based Generation
3.1.1 TimeGAN
TimeGAN (Yoon et al., 2019) is a method rooted
in Generative Adversarial Networks (GANs), specif-
ically designed for the generation of time series data.
This model comprises a generator tasked with pro-
ICPRAM 2025 - 14th International Conference on Pattern Recognition Applications and Methods
284

Table 1: Comparative table of databases with sparse series.
Database name Time Interval
Number
of series
Total number
of samples
Sparsity Description
Online Retail
1 min to 11 days
Mean = 30 min
1 17,914 70.30%
Transactions for an
online retail business
in the UK.
Car Parts 1 month 2,674 136,374 75.90%
Demand for vehicle
spare parts.
Entropy 1 1 day to 15 days 1,200 132,579 35.65 %
Demand for heavy
machinery spare parts
in China.
Entropy 2 1 month 57 1,938 41.90 %
Demand for parts from a
vehicle manufacturing
company in China.
STELCO
(ours)
10 ns to 3 days
Mean = 2 min
18 287,734 67.42 %
Invoicing amount
in e-commerce
platform.
ducing new synthetic data, which attempts to deceive
a discriminator that functions to distinguish between
real and fictitious data. GANs have demonstrated
strong performance not only in time series generation
(Brophy et al., 2023) but also in other domains, such
as image generation.
A distinctive feature of TimeGAN is its incorpo-
ration of an additional embedding network that fa-
cilitates a reversible mapping between features and
latent representations, thereby addressing the chal-
lenges posed by the high dimensionality of the GAN’s
latent space. The model employs three loss functions:
one unsupervised loss associated with the GAN, an-
other associated with the embedding network, and a
supervised step-wise loss. The supervised step-wise
loss utilizes real data as a reference, promoting the
model’s ability to capture the temporal sequential dy-
namics inherent in the data. This loss is minimized
through the joint training of the generation and em-
bedding networks.
The initial results using TimeGAN were obtained
for the subset designated as low employing model pa-
rameters of 10,000 epochs and a sequence length of
24. Figures 2a and 2d illustrate windows of the time
series over a specified period of time, along with his-
tograms depicting the distributions of both the orig-
inal and synthetic data. The synthetic data demon-
strates a distribution that closely resembles that of the
real data; however, comprehensive performance eval-
uations will be conducted below.
The second experiment employing TimeGAN was
conducted on the subset designated as mid, maintain-
ing a sequence length of 24 while increasing the num-
ber of epochs to 30,000, due to the larger volume of
input data. Figures 2b and 2e show the plots and
histograms of the original and synthetic data, respec-
tively. In this case, it is seen that some of the peaks
of higher values are lost and are not generated in the
synthetic data.
The third experiment using TimeGAN was con-
ducted on the high subset, employing the same se-
quence length of 24 but 50,000 epochs, given the
larger volume of input data compared to the other sub-
sets. The window plots and histograms of both the
original and synthetic data are illustrated in Figures
2c and 2f, respectively. Although the generated win-
dows appear to align closely with the original data, the
histograms reveal a higher density of non-zero values
in the synthetic data than in the original. Furthermore,
the largest values are completely absent in the gener-
ated dataset. Future investigations could benefit from
a hyperparameter search to explore the effects of vary-
ing window lengths and the number of iterations on
the generation process.
3.2 VAE-Based Generation
3.2.1 TimeVAE
TimeVAE(Desai et al., 2021) is a method used for
synthetic generation of time-series based on Varia-
tional Auto-Encoders (VAEs). They propose an in-
terpretable VAE architecture where they present two
blocks: Trend and Seasonality, that get added to the
decoder in order to add specific temporal structures
to the decoding process. Thus, the output from the
decoder results in the element-wise summation of the
trend block output, seasonality block outputs and the
residual base decoder output.
To perform our tests, we used the interpretable
TimeVAE architecture with one Trend block, one sea-
sonality block and the base residual decoder. The
ASTELCO: An Augmented Sparse Time Series Dataset with Generative Models
285
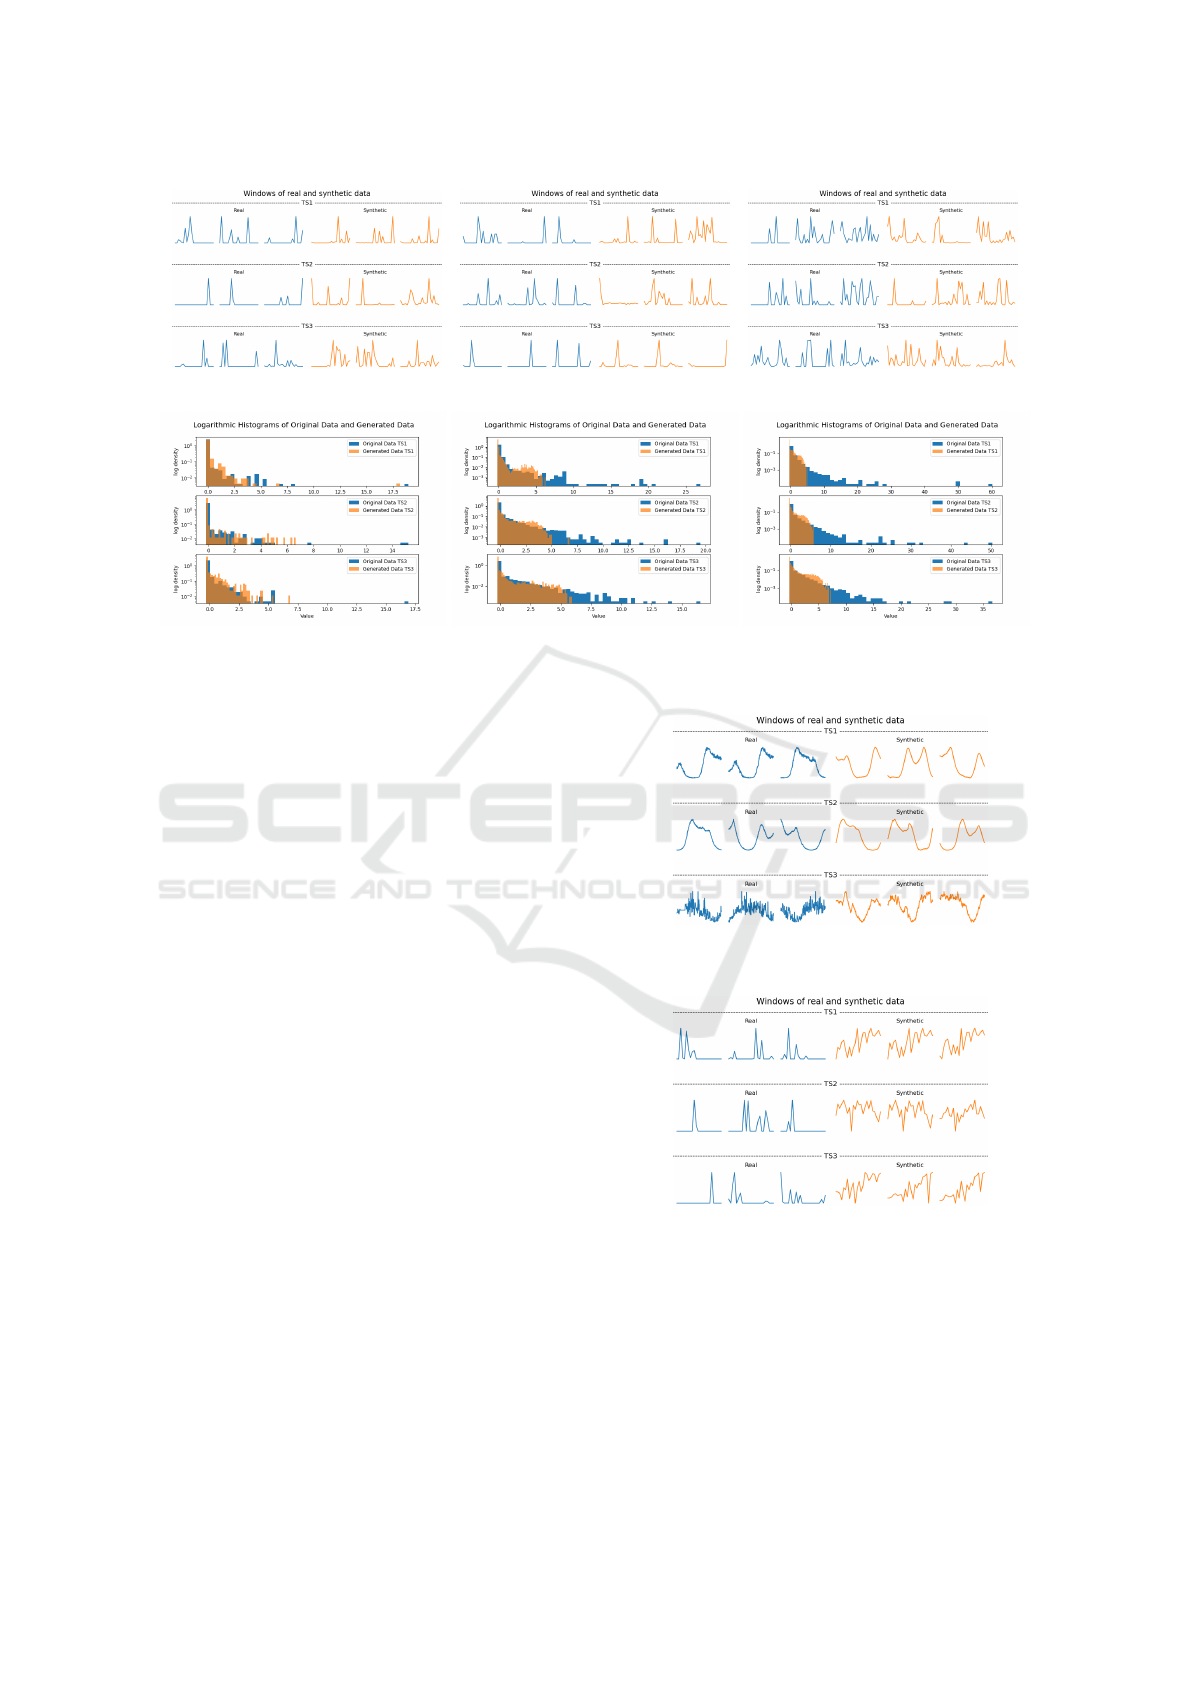
(a) Windows for low subset. (b) Windows for mid subset. (c) Windows for high subset.
(d) Histogram for low subset. (e) Histogram for mid subset. (f) Histogram for high subset.
Figure 2: Visual comparison of original and generated data across different subsets (low, mid, and high) using TimeGAN.
trend block was selected with 4 trend polynomials
(p = 4). The seasonality block varied for each dataset:
with m = 7 and d equal to the duration of a day (24 in
the case of the low subset, 288 for the mid subset, and
1440 for the high subset); where m is the number of
seasons, and d is the duration of each season.
The results obtained with this configuration are il-
lustrated in Figure 3b, and show a difficulty in captur-
ing the temporal dynamics of our data. This is not in
accordance with the good results obtained with con-
tinuous data, with daily seasonality like TELCO, as
seen in Figure 3a.
3.2.2 DC-VAE
DC-VAE (Garc
´
ıa Gonz
´
alez et al., 2022) is a method
used for anomaly detection in time series, which takes
advantage of convolutional neural networks (CNN)
and variational auto-encoders (VAE). DC-VAE de-
tects anomalies in time series data by exploiting tem-
poral information without sacrificing computational
and memory resources. In particular, instead of us-
ing recursive neural networks, large causal filters or
many layers, DC-VAE relies on dilated convolutions
(DC) to capture long- and short-term phenomena in
the data, avoiding complex and less efficient deep
architectures, simplifying learning. This method is
based on the reconstruction of time series and is not
used as a generative method like TimeGAN. How-
ever, we wanted to test its performance in generative
tasks such as this one.
In the initial approach, the model was used to re-
(a) TELCO windows.
(b) STELCO windows.
Figure 3: TimeVAE: Real and synthetic windows for
TELCO (top) and STELCO (bottom).
construct the input series to evaluate its performance.
The reconstruction of the three series of the low sub-
group are depicted in Figure 4. A window length
of 24 points was selected, corresponding to one day
ICPRAM 2025 - 14th International Conference on Pattern Recognition Applications and Methods
286
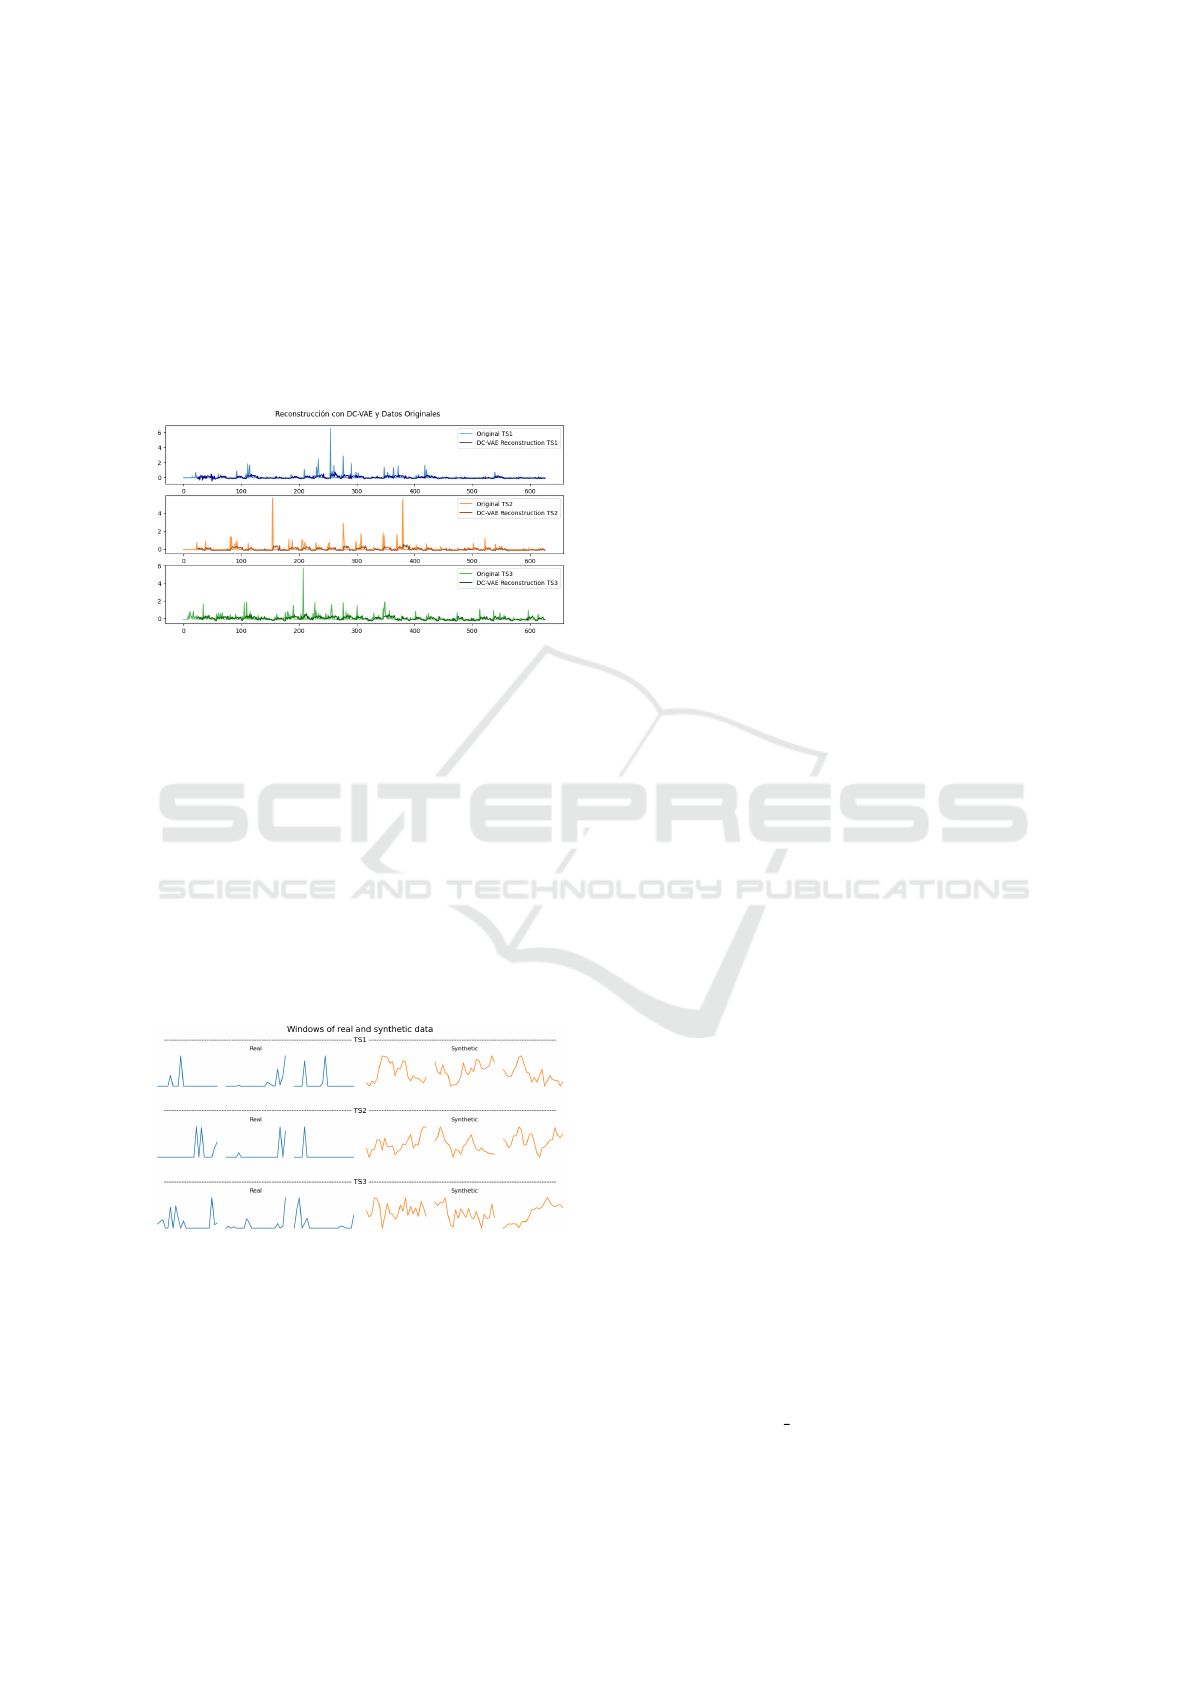
of activity. The model and its training process were
slightly modified to shift from a multivariate approach
to a global one. In this global mode, each input se-
ries was processed independently, without utilizing
information from the other series for reconstruction.
As illustrated in the plots, the model demonstrates a
certain difficulty in reconstructing the highest activity
peaks, instead primarily reflecting the mean value of
each window.
Figure 4: Reconstruction of the low subgroup series with
DC-VAE.
The next step was to try to generate synthetic data
from the original data. For this purpose, the already
trained model was used, in this case with the low sub-
group. Vectors with a uniform distribution (0,1), of
dimension equal to the dimension of the latency space
of the model, were generated and passed through the
decoder. Thus, a window of T = 24 samples is ob-
tained at the output of the decoder. For each uniform
sample of the latency space, a window is generated,
which are comparable with the windows of the origi-
nal series. This procedure was repeated for each sub-
set, and Figure 5 shows the comparison of real and
synthetic windows for the subset low.
Figure 5: Comparison of windows between original data
(blue color) and synthetic data (orange color), generated
from the DC-VAE decoder trained with the low subgroup
series.
It was observed that the DC-VAE inadequately
captured the dynamics of the original data, resulting
in generated data that lacked resemblance to the orig-
inals and exhibited a certain degree of noise. This is-
sue may arise from several factors. Firstly, the dimen-
sionality reduction inherent in auto-encoders tends to
prioritize lower frequency data, which can lead to the
loss of higher frequency components. Consequently,
this results in the omission of significant peaks in our
sparse data, which are crucial for our analysis.
Finally, a review of both reconstruction (4) and
generation (5) results suggests that the DC-VAE is
more suited for time series that exhibit higher activ-
ity levels and periodic dynamics. This is likely due
to the Gaussian distribution of the DC-VAE output,
which smooths the reconstruction process. In con-
trast, the original data does not exhibit such a distribu-
tion; rather, its values are predominantly zero, result-
ing in a distribution that aligns more closely with a
Laplacian model. We have discussed the potential for
future adaptations of the network to produce an out-
put distribution that better fits the data, although this
endeavor will require significant time and resources,
and thus will be left for subsequent research.
4 PERFORMANCE EVALUATION
The metrics used to evaluate the performance of the
different generative methods were inspired by RC-
GAN (Esteban et al., 2017) and TimeGAN (Yoon
et al., 2019). These articles present methodologies to
assess the quality of the generated data based on three
criteria: diversity: samples should be distributed in
such a way that they cover the actual data; fidelity:
the samples should be indistinguishable from the real
data; and usefulness: the samples should be as useful
as the actual data when used for the same predictive
purposes.
Initially, two visual analysis methods—Principal
Component Analysis (PCA) and t-distributed
Stochastic Neighbor Embedding (t-SNE)—are em-
ployed. These techniques allow for the visualization
of the extent to which the distribution of the gen-
erated samples resembles that of the original data
within a two-dimensional space. This approach
facilitates a qualitative assessment of the diversity of
the generated samples.
Secondly, a time series classification model was
developed, utilizing a 2-layer LSTM RNN to differen-
tiate between real and generated data sequences. This
training is conducted in a supervised manner, with the
original and generated data labeled beforehand. Then,
the classification error is used as a quantitative evalu-
ation of fidelity. The metric defined as discriminative
score is presented in Equation (2).
discriminative score = |0.5 − accuracy|, (2)
ASTELCO: An Augmented Sparse Time Series Dataset with Generative Models
287
The ideal scenario, which would minimize the dis-
criminative score, occurs when the classification ac-
curacy is 0.5. In this case, the classifier would per-
ceive all incoming real data as genuine and all syn-
thetic data also as real. Therefore, half of the data
would be accurately classified (the real instances) and
the other half would be misclassified (the synthetic
instances). This outcome suggests that the synthetic
data is indistinguishable from the real data.
Finally, a sequence prediction model was trained
using a 2-layer LSTM RNN to forecast the time vec-
tors of the next step in each input sequence. Specifi-
cally, for a sequence of data ranging from 0 to T, the
objective is to predict the value of the series at time
T+1. This model was trained on the generated data
and evaluated on the original data. Its performance
is quantified using the mean absolute error (MAE) as
defined in Equation (3), thereby providing a quantita-
tive assessment of usefulness.
MAE =
D
∑
i=1
|x
i
− y
i
| (3)
where x and y are series of dimension D, correspond-
ing to the predictions and the real data. For both the
fidelity and utility metrics, the procedure is repeated
10 times, with the average of all iterations presented
as the predictive score in Table 2 for each subset.
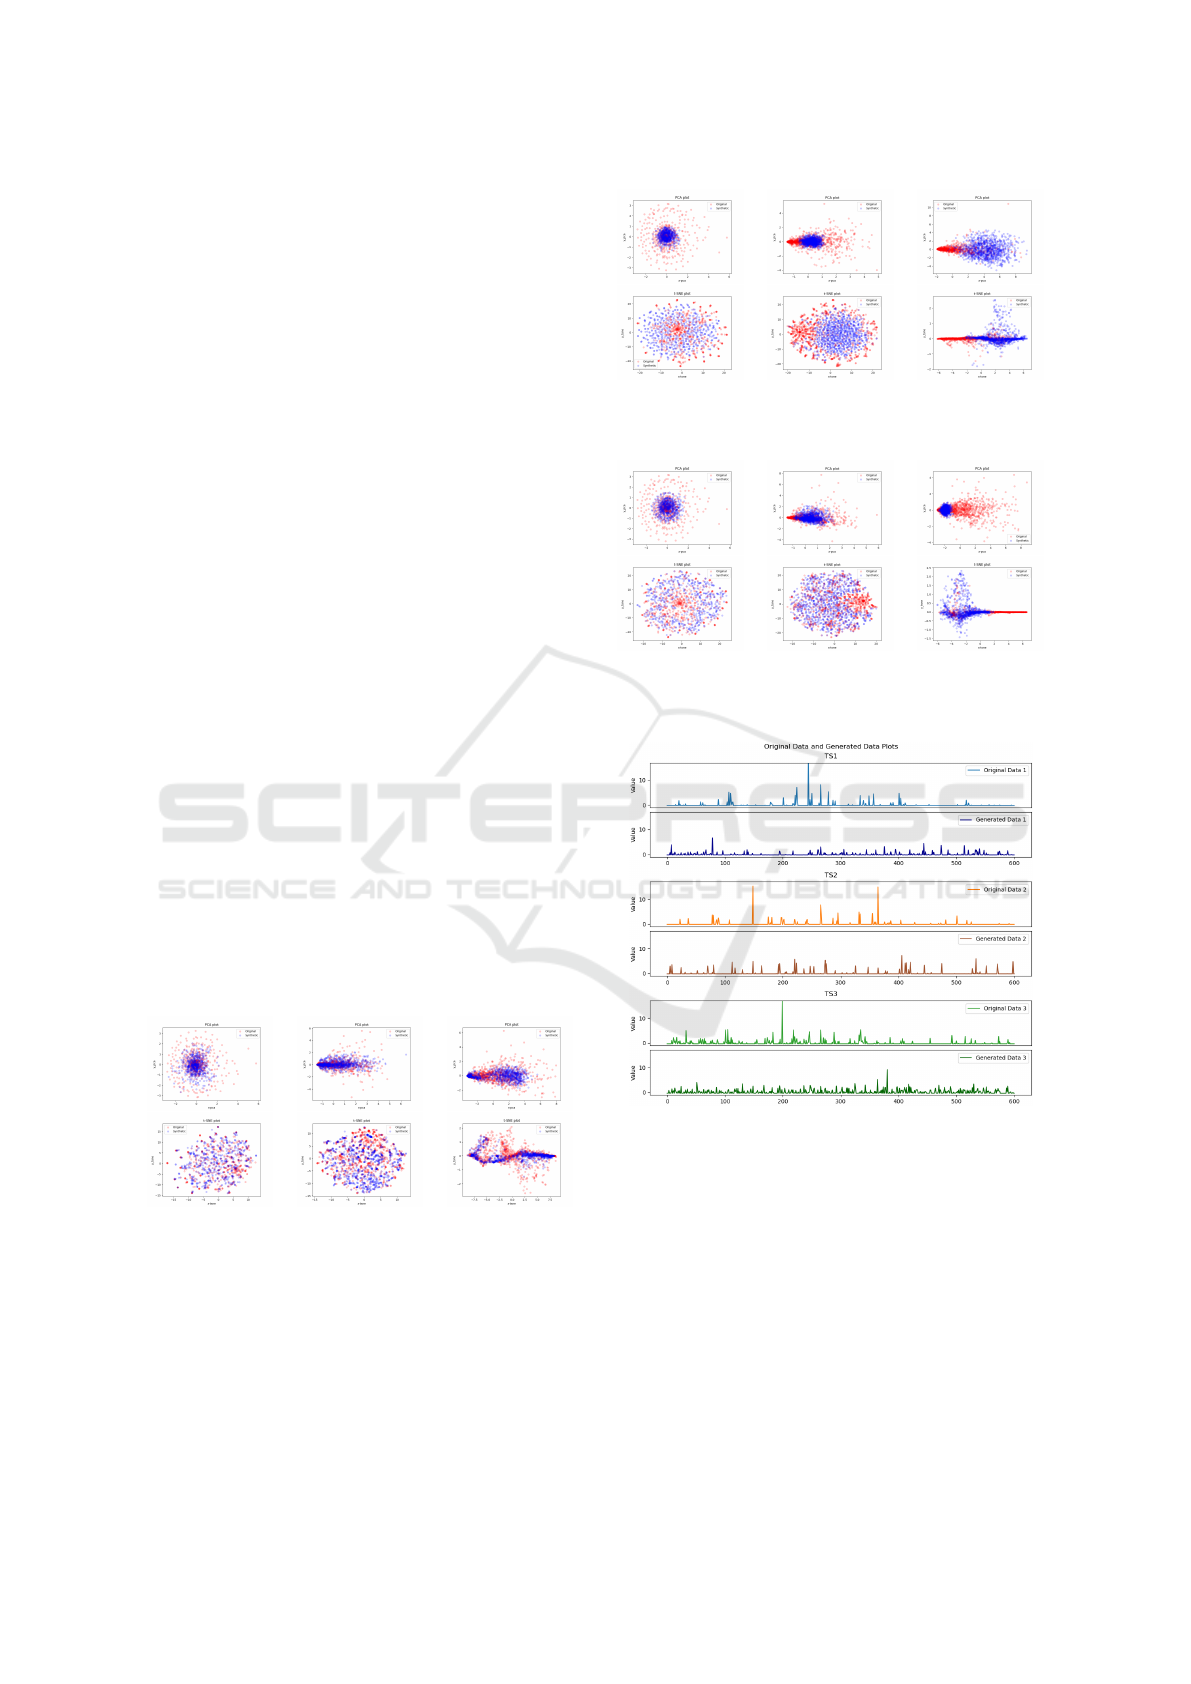
Figure 6 shows the PCA and t-SNE plots for the
experiments performed with TimeGAN on the sub-
sets low, mid and high, respectively. It illustrates that
the generated data (blue) closely ressembles the real
data (red), as evidenced by the similar spatial distri-
butions observed in their PCA and t-SNE plots. This
similarity is particularly notable for the low and mid
subsets.
(a) low. (b) mid. (c) high.
Figure 6: TimeGAN: PCA (top) and t-SNE (bottom) plots.
Additionally, to facilitate a comparison between
the synthetic data generated by DC-VAE and the orig-
inal data, the PCA and t-SNE plots for this model are
presented in Figure 7.
Another factor that should be taken into account
when comparing methods is the time they take to train
(a) low. (b) mid. (c) high.
Figure 7: DC-VAE: PCA (top) and t-SNE (bottom) plots.
(a) low. (b) mid. (c) high.
Figure 8: TimeGAN concatenated windows: PCA (top) and
t-SNE (bottom) plots.
Figure 9: TimeGAN: concatenated windows for the low
subgroup.
and generate the synthetic data. This is where DC-
VAE excells, since its VAE architecture is quite small
and presents fast computing times. TimeGAN, on the
other hand, is quite slow, performing at its worst with
large amounts of data and large window sizes. In
Table 2, the elapsed training time is shown for each
method using an NVIDIA GeForce RTX 3090 with
24.5GB of GPU memory.
ICPRAM 2025 - 14th International Conference on Pattern Recognition Applications and Methods
288

Table 2: Comparison of model performance for the 3 subsets of data evaluated.
Metric Method
Data subset
low mid higih
Discriminative
Score
DC-VAE 0.2496 ± 0.0256 0.2644 ± 0.0193 0.2497 ± 0.0239
TimeGAN 0.2678 ± 0.0828 0.2486 ± 0.1307 0.2694 ± 0.0447
Predictive
Score
DC-VAE 0.5254 ± 0.0059 0.6871 ± 0.1036 0.5541 ± 0.0042
TimeGAN 0.5186 ± 0.001 0.5204 ± 0.0017 0.7377 ± 0.0043
Time to train
and generate
DC-VAE 79 s 678 s 1,634 s
TimeGAN 5,624 s 30,494 s 65,220 s
Table 3: Comparison of window concatenation performance for the 3 subsets of data evaluated.
Metric Method
Data subset
low mid high
Discriminative
Score
TimeGAN 0.2678 ± 0.0828 0.2486 ± 0.1307 0.2694 ± 0.0447
TimeGAN-concat 0.219 ± 0.101 0.2466 ± 0.0654 0.3341 ± 0.1234
Predictive
Score
TimeGAN 0.5186 ± 0.001 0.5204 ± 0.0017 0.7377 ± 0.0043
TimeGAN-concat 0.5239 ± 0.0004 0.5197 ± 0.0005 0.7373 ± 0.0006
5 COMPLETE TIME SERIES
SYNTHESIS
A common factor with the models evaluated is that the
generation of data is done on a window-by-window
basis. This inhibits the models ability to reconstruct
the dynamics of the original series sample by sample.
The lack of temporal coherence between windows un-
dermines their concatenation, making it challenging
to establish continuity. The correlation between one
window and the next depends on the relationship be-
tween one random uniform vector and another, which
are not necessarily close to one another.
In this case, given the sparsity of the time series
analyzed in this study, it would be worthwhile to in-
vestigate whether retaining only the last value from
each window and concatenating them could yield an
entire synthetic time series, that not only matches the
input data in length, but also in its temporal dynamics.
This approach would not work for continuous
time-series since each window presents a specific
dynamic that would not be so easily concatenated.
An example of windows from a continuous time se-
ries from the TELCO(Garc
´
ıa Gonz
´
alez et al., 2023)
dataset is illustrated in Figure 3a. However, in sparse
series such as STELCO, given the low probability of
occurrence of peaks, it could be argued that their con-
catenation could yield an entirely new time series that
preserves the original distribution of the data.
In order to assess this aspect, the same perfor-
mance evaluation procedure was applied to the con-
catenated windows generated using TimeGAN, and
the results are presented both in Table 3 and in Fig-
ure 8. As we can see in this results, it seems to be
possible to generate an entire time series, when they
are sparse enough. So that is what we did for the low
subgroup, giving the result illustrated in Figure 9. An
issue still persists with the less frequent high value
peaks, that are not represented in the generated series.
Future work will focus on adapting the concatenation
method to effectively capture these dynamics and fa-
cilitate appropriate complete series generation.
6 CONCLUSIONS AND FUTURE
WORK
One of the main conclusions of our work is that it
was possible to successfully generate a new synthetic
sparse dataset through the augmentation of our real
dataset using generative methods.
In contrast to previous works that restrict the gen-
eration to limited windows, this study demonstrates
the capability to generate complete synthetic sparse
time series that match the size of the original series.
Notably, the performance scores achieved are compa-
rable to those obtained from individual windows.
In the comparison of the methods based on GAN
with those based on VAE, it is observed that while the
performance metrics are similar, the visual analysis
of the generated series indicates superior performance
from TimeGAN relative to VAE-based methods. In
the case of DC-VAE similar prediction, discrimina-
tion, PCA and t-SNE scores are obtained, with no-
toriously lower execution times. However, across all
methods, a common challenge is the difficulty in ac-
ASTELCO: An Augmented Sparse Time Series Dataset with Generative Models
289

curately reproducing the most prominent peaks in the
data.
Future lines of work include lifting the Gaussian
assumption in VAE-based models. This would in-
volve, for example, a detailed examination of the
model architecture to assess possible modifications
aimed at better aligning the output distribution with
the characteristics of our data.
Additionally, introducing conditioning mecha-
nisms in the generation of consecutive windows
would be extremely valuable. This could involve im-
plementing a more sophisticated method for concate-
nating windows that preserves the temporal correla-
tion between them.
Finally, it is important to emphasize that we make
the STELCO dataset and the generation procedure for
ASTELCO publicly available, along with the accom-
panying code.
7 CODE AND DATASETS
We provide access to all materials utilized for con-
ducting the experiments, including both the real and
generated datasets: the code used to run the experi-
ments with TimeGAN
1
and DC-VAE
2
, the metrics
used to evaluate the performance of the models
3
, and
both STELCO and ASTELCO datasets
4
.
ACKNOWLEDGEMENTS
This work has been partially supported by the
Uruguayan CSIC project with reference CSIC-I+D-
22520220100371UD “Generalization and Domain
Adaptation in Time-Series Anomaly Detection”, and
by Telef
´
onica. Manuel S
´
anchez-Laguardia expresses
his gratitude to ITC (consulting company of Antel)
for the support received to attend the conference.
REFERENCES
Brophy, E., Wand, Z., She, Q., and Ward, T. (2023). Gener-
ative adversarial networks in time series: A systematic
literature review. In ACM Computing Surveys, Volume
55, Issue 10, pages Article No.: 199, Pages 1 – 31.
1
https://github.com/ydataai/ydata-synthetic
2
https://github.com/GastonGarciaGonzalez/DC-VAE
3
https://github.com/manu3z/
data-augmentation-evaluation-metrics
4
https://iie.fing.edu.uy/investigacion/grupos/anomalias/
stelco-dataset/
Desai, A., Freeman, C., Wang, Z., and Beaver, I.
(2021). Timevae: A variational auto-encoder for
multivariate time series generation. arXiv preprint
arXiv:2111.08095.
Esteban, C., Hyland, S. L., and R
¨
atsch, G. (2017). Real-
valued (medical) time series generation with recurrent
conditional gans.
Fan, L., Zhang, J., Mao, W., and Cao, F. (2023). Unsu-
pervised anomaly detection for intermittent sequences
based on multi-granularity abnormal pattern mining.
In Entropy, pages 25, 123.
Garc
´
ıa Gonz
´
alez, G., Martinez Tagliafico, S., Fern
´
andez,
A., G
´
omez, G., Acu
˜
na, J., and Casas, P. (2022). Dc-
vae, fine-grained anomaly detection in multivariate
time-series with dilated convolutions and variational
auto encoders. In IEEE European Symposium on Se-
curity and Privacy Workshops (EuroS&PW), pages
287–293.
Garc
´
ıa Gonz
´
alez, G., Mart
´
ınez Tagliafico, S., Fern
´
andez,
A., G
´
omez, G., Acu
˜
na, J., and Casas, P. (2023). Telco.
IEEE Dataport. https://dx.doi.org/10.21227/skpg-
0539.
Gonz
´
alez, G. G., Casas, P., Mart
´
ınez, E., and Fern
´
andez,
A. (2024). On the quest for foundation generative-ai
models for anomaly detection in time-series data. In
2024 IEEE European Symposium on Security and Pri-
vacy Workshops (EuroS&PW), pages 252–260. IEEE.
Iglesias, G., Talavera, E., Gonz
´
alez-Prieto, A., Mozo1, A.,
and G
´
omez-Canaval1, S. (2023). Data augmentation
techniques in time series domain: a survey and tax-
onomy. In Neural Computing and Applications, page
10123–10145.
Makridakis, S., Spiliotis, E., and Assimakopoulos, V.
(2022). M5 accuracy competition: Results, findings,
and conclusions. International Journal of Forecasting,
38(4):1346–1364. Special Issue: M5 competition.
Renz, P., Cutajar, K., Twomey, N., Cheung, G. K. C., and
Xie, H. (2023). Low-count time series anomaly de-
tection. In 2023 IEEE 33rd International Workshop
on Machine Learning for Signal Processing (MLSP),
pages 1–6.
Wang, C., Wu, K., Zhou, T., Yu, G., and Cai, Z. (2022).
Tsagen: Synthetic time series generation for kpi
anomaly detection. IEEE Transactions on Network
and Service Management, 19(1):130–145.
Wen, Q., Sun, L., Yang, F., Song, X., Gao, J., Wang, X., and
Xu, H. (2020). Time series data augmentation for deep
learning: A survey. arXiv preprint arXiv:2002.12478.
Yoon, J., Jarrett, D., and van der Schaar, M. (2019). Time-
series generative adversarial networks. In Advances in
Neural Information Processing Systems 32 (NeurIPS
2019), pages 5508–5518.
ICPRAM 2025 - 14th International Conference on Pattern Recognition Applications and Methods
290
