
PPG Signal Quality Classification Using STFT and CNN with the BUT
PPG Database
Leandro Duque Mussio
a
and Maria Claudia F. Castro
b
Department of Electrical Engineering, Centro Universit
´
ario FEI, Brazil
Keywords:
PPG, Photoplethysmography, Signal Quality, Artifact, STFT, Deep Learning, CNN, Public Dataset, Small
Sample Size, Biomedical Signal Analysis.
Abstract:
Photoplethysmography (PPG) signal analysis has the potential for various medical applications, such as heart
rate monitoring, blood pressure estimation, and emerging techniques like diagnosing diabetes and glucose level
estimation. However, noise and artifacts, especially motion artifacts, can degrade the quality of PPG signals,
making it difficult to extract meaningful features. This research addresses this challenge by investigating the
quality of photoplethysmography (PPG) signals using the Short-Time Fourier Transform (STFT) and a deep
learning model. The objective is to classify PPG signals as good or bad to eliminate bad signals and increase
the accuracy of subsequently derived features. The signals were pre-processed using the publicly available
BUT PPG database, consisting of a limited number of smartphone PPG recordings with a low sampling rate
(30 Hz), generating spectrographic images used in training a Convolutional Neural Network (CNN) to classify
the quality of the signals. Nested cross-validation with five external folds and two internal stratified folds was
applied to optimize hyperparameters and assess the model’s performance. The results show the effectiveness
of the proposed approach, improving the extraction of features from PPG signals by collecting 94.29% (±
7.82%) of good signals and filtering 80% (± 12.78%) of bad signals.
1 INTRODUCTION
Photoplethysmography (PPG) is a noninvasive opti-
cal technique used to detect changes in blood volume
within the microvascular bed of tissue. It is typically
applied to the finger and wrist but can also be applied
to the forehead or arm (Attivissimo et al., 2023). It is
commonly used for measuring heart rate, oxygen sat-
uration (SpO2), and blood pressure through hospital
equipment or even smartwatches that enable continu-
ous measurements (Chettri et al., 2024).
Recent studies suggest its use for diagnosing di-
abetes and estimating glucose levels (Zanelli et al.,
2022). To achieve this purpose, models are trained
to identify specific PPG signal features that allow for
clinically acceptable estimation or diagnosis (Monte-
Moreno, 2011; Avram et al., 2020). However, arti-
facts in the signal, particularly motion artifacts, distort
the signal cycles, making their removal through digi-
tal filters challenging (Park et al., 2023), thereby com-
plicating the precise extraction of features and con-
a
https://orcid.org/0009-0001-8606-0105
b
https://orcid.org/0000-0002-2751-0014
sequently affecting the training of models to extract
information from the collected signals (Polak et al.,
2022).
Therefore, developing a model capable of classi-
fying the quality of the collected PPG signals is nec-
essary, discarding poor-quality signals and ensuring
the extraction of genuine features from the signals for
subsequent use in training classification or regression
models.
In Chen et al. (2021) study, the use of STFT
was proposed for extracting spectrogram images from
PPG signal samples, using the VitalDB database,
which contains 5804 10-second segments from 102
subjects, including 3969 of good quality and 1835 of
poor quality. Other related studies have used varying
dataset sizes and durations. For example, Sukor et al.
(2011) utilized 104 60-second segments from 13 sub-
jects with a decision-tree classifier that categorized
PPG pulses based on waveform morphology analysis.
In comparison, Li and Clifford (2012) used a much
larger dataset of 1055 6-second segments from 104
subjects using dynamic time-warping (DTW) com-
bined with a multi-layer perceptron (MLP) neural net-
work, providing more significant variability among
Mussio, L. D. and Castro, M. C. F.
PPG Signal Quality Classification Using STFT and CNN with the BUT PPG Database.
DOI: 10.5220/0013186000003911
Paper published under CC license (CC BY-NC-ND 4.0)
In Proceedings of the 18th International Joint Conference on Biomedical Engineering Systems and Technologies (BIOSTEC 2025) - Volume 1, pages 921-927
ISBN: 978-989-758-731-3; ISSN: 2184-4305
Proceedings Copyright © 2025 by SCITEPRESS – Science and Technology Publications, Lda.
921
participants, which can enhance the model’s ability to
generalize across different individual characteristics.
In contrast, Liu et al. (2020) used a large dataset of
12876 7-second segments utilizing both SVM, which
classified PPG segments based on statistical features,
and CNN, using VGG-19 to analyze PPG signal im-
ages for quality assessment, but with a limited number
of 20 subjects which may restrict the model’s ability
to generalize across diverse physiological variations.
Couceiro et al. (2014) used a C-SVC SVM model
with features selected through the NMIFS algorithm,
training on PPG signals collected from 15 subjects,
resulting in 22 records of 60 seconds per subject as
they performed various guided movements to gener-
ate motion artifacts. Lastly, Cherif et al. (2016) intro-
duced a method based on waveform morphology with
adaptive thresholding using Random Distortion Test-
ing (RDT) to detect artifacts in PPG signals applied
to 104 60-second segments.
Despite the promising results of previous studies,
many have relied on datasets with large sample sizes,
higher sampling rates, and a greater number of sub-
jects. For instance, Chen et al. (2021) used a dataset
with a sampling rate of 100 Hz and a significantly
larger sample size. These conditions may not reflect
the challenges posed by datasets with fewer samples,
lower sampling frequencies, and a limited number
of subjects. Testing methodologies under such con-
strained conditions is essential to assess their robust-
ness and applicability to real-world scenarios, such as
wearable devices, where data collection is often re-
stricted by hardware capabilities and participant avail-
ability (Ronca et al., 2023).
This study applies the method proposed by Chen
et al. (2021), which utilizes STFT for spectrogram ex-
traction and CNNs for signal quality classification, to
a public dataset with fewer samples, fewer subjects,
and a lower sampling rate. The goal is to evaluate the
model’s ability to classify good and poor-quality sig-
nals under these constraints, highlighting its potential
applicability to similar scenarios.
2 METHODOLOGY
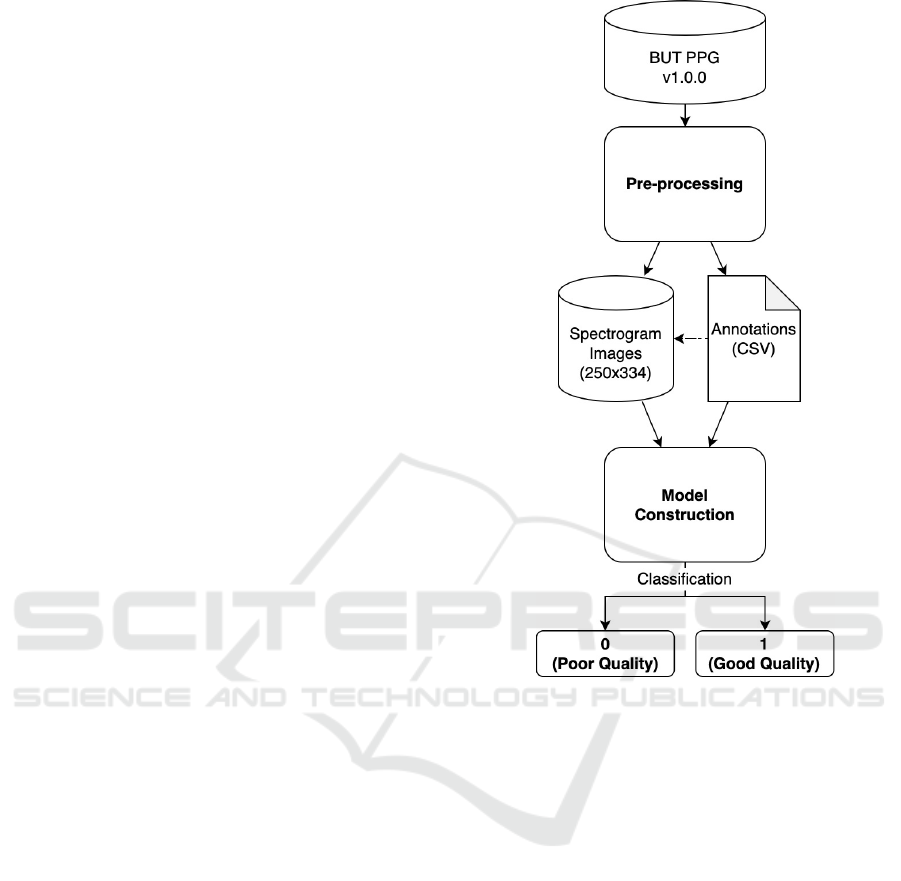
Figure 1 presents the proposed methodology. The
PPG data, consisting of signals from 12 distinct in-
dividuals (six men and six women), were obtained
from the publicly available BUT PPG database ver-
sion 1.0.0 (Nemcova et al., 2021a,b), available on
PhysioNet (Al et al., 2000).
Figure 1: Steps for building the classifier model.
2.1 Data
The dataset includes 48 PPG signals extracted from
12 volunteers. Each participant contributed four
recordings: three during rest periods and one during
instances of movement. The researchers recorded the
signals at a sampling rate of 30 Hz, with each record-
ing lasting 10 seconds.
2.2 Extraction
During the initial pre-processing phase, illustrated in
Figure 2, a Pandas DataFrame was generated by cor-
relating the PPG signal data with their respective an-
notations. Each segment of the PPG signal was asso-
ciated with an identifier, from which the signal quality
annotations were extracted: 0 indicating poor quality
and 1 indicating good quality. The original PPG sig-
nal data was recovered from the WFDB format (Xie
et al., 2023) and converted into the Pandas series.
BIOSIGNALS 2025 - 18th International Conference on Bio-inspired Systems and Signal Processing
922
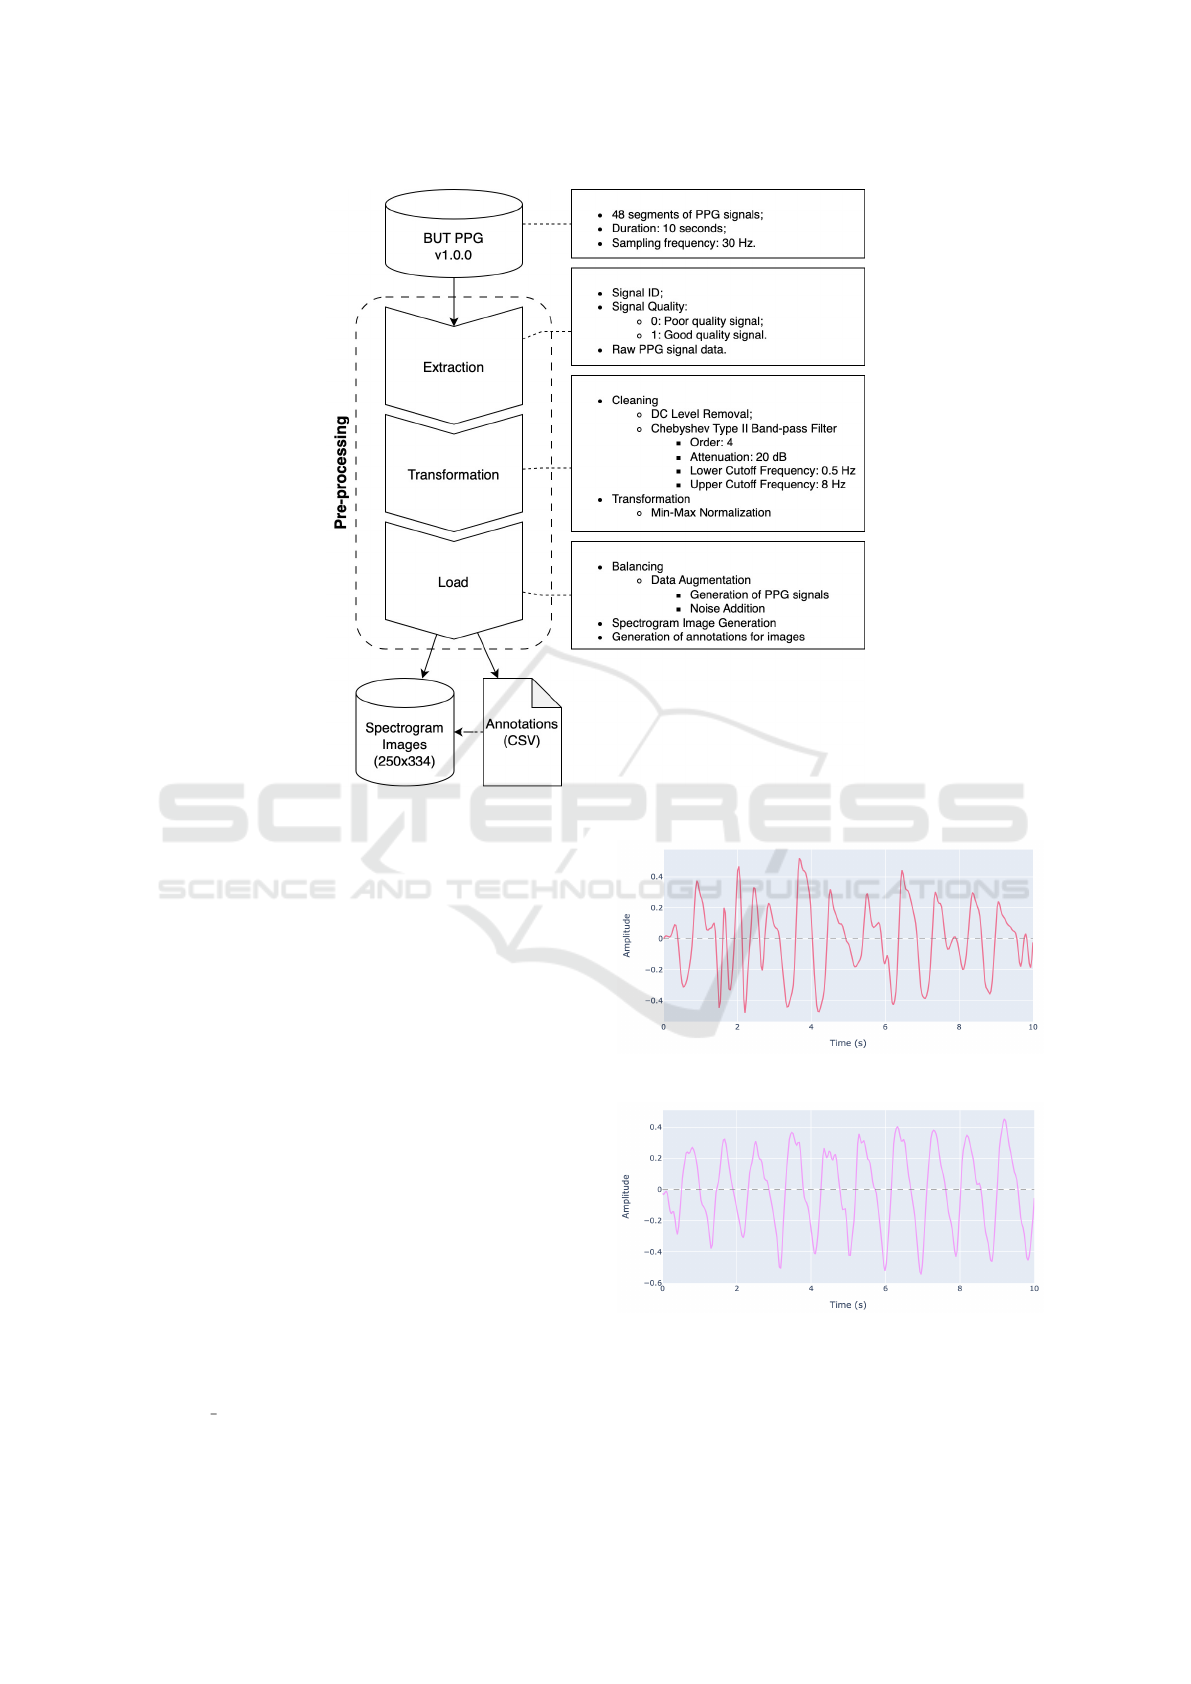
Figure 2: Pre-processing Steps.
2.3 Transformation
In the second stage of pre-processing, as illustrated in
Figure 2, the PPG signals underwent an initial clean-
ing process involving the removal of the direct current
(DC) component and the application of a fourth-order
Chebyshev Type II band-pass filter, with a 20 dB at-
tenuation and lower and upper cutoff frequencies of
0.5 Hz and 8 Hz, respectively (Suboh et al., 2022).
The results of this process can be seen in Figures 3
and 4, which show the filtered poor-quality and good-
quality PPG signals, respectively.
Min-max normalization was applied to the PPG
signals to standardize signal amplitudes, preserving
the overall signal structure and making variations in
intensity between different frequencies more visible
and uniform (Islam et al., 2022).
2.4 Load
In the final stage of pre-processing, as shown in Fig-
ure 2, the database was balanced using data aug-
mentation to match the number of good-quality signal
samples (35) with poor-quality samples (13). Using
the ppg simulate function from the Python library
neurokit2 (Makowski et al., 2021), 22 new PPG sig-
Figure 3: Filtered poor-quality PPG signal.
Figure 4: Filtered good-quality PPG signal.
nals containing noise and distortions were generated,
each with a duration of 10 seconds and a sampling
rate of 30 Hz. Subsequently, filters and normalization
PPG Signal Quality Classification Using STFT and CNN with the BUT PPG Database
923

techniques, presented in Section 2.3, were applied to
the newly generated signals.
Spectrographic representation was obtained us-
ing the STFT to analyze each PPG signal and in-
vestigate the temporal evolution of frequency com-
ponents. Each representation was stored in the
designated folder of the corresponding signal in
the original database, following the naming con-
vention “<Signal ID>/<Signal ID> STFT.png”
with dimensions of 250 × 334 pixels, as exemplified
by Figure 5 and Figure 6.
Figure 5: Spectrogram of a poor-quality PPG signal.
Figure 6: Spectrogram of a good-quality PPG signal.
Subsequently, a CSV file named
but-ppg-dataset.csv was produced, covering
the initial annotations of each signal, gathered and
consolidated by the identification number. This file
also includes the PPG STFT column, indicating the
location of the created spectrogram image intended
for use in the Model Construction phase.
2.5 Model Construction
The CNN architecture proposed in (Chen et al., 2021),
illustrated in Figure 7, was applied using the dataset
produced in Section 2.4 for training, validation, and
testing purposes.
Figure 7: Machine Learning Model Training.
The model was built using Python 3.9.6,
TensorFlow 2.16.1, and Keras 3.1.1 in a Jupyter
notebook, running on a Darwin 23.4.0 operating
system. The computational setup included an 8-core
processor (4 physical cores) and 32 GB of RAM with-
out GPU utilization.
The nested cross-validation method was imple-
mented to enhance the precision and reliability of the
BIOSIGNALS 2025 - 18th International Conference on Bio-inspired Systems and Signal Processing
924

model evaluation process. The dataset was partitioned
into five external and two internal folds, both strati-
fied, to ensure a balanced representation of classes in
each split.
During the nested cross-validation, the eval-
uated hyperparameters include the model’s
input shape (model input shape), the opti-
mizer (model optimizer), the dropout rate
(model dropout rate), the number of epochs
(epochs), the batch size (batch size), and the
learning rate (model learning rate). The fol-
lowing hyperparameters were tested to identify the
combination that maximizes model performance
while maintaining robustness and generalization:
input shape (250, 334, 3), optimizer Adam, a
dropout rate of 0.5, 90 training epochs, batch sizes
of 10 and 15, and learning rates of 0.00005 and
0.0001, with a binary cross-entropy loss function.
2.6 Evaluation Metrics
The accuracy, precision, recall, specificity, and F1-
Score metrics are calculated using equations (1) - (5).
Acc =
T P + T N
T P + T N + FP + FN
(1)
Pre =
T P
T P + FP
(2)
Rec =
T P
T P + FN
(3)
Sp =
T N
T N + FP
(4)
F1 = 2 ×
Precision × Recall
Precision + Recall
(5)
TP indicates true positive; TN indicates true neg-
ative; FP indicates false positive; FN indicates false
negative.
3 RESULTS AND DISCUSSION
The test results, presented in Table 1, show the eval-
uation metrics for each of the five external folds and
the mean and the standard deviation for each metric.
Table 2 presents the best hyperparameters for training
each external fold during nested cross-validation.
The accuracy of 87.14% (± 7.82%) reflects the
model’s ability to distinguish between good and bad
signals reliably. It indicates that most of its predic-
tions are correct and allows us to apply it effectively
as a PPG signal filter.
The precision of 83.25% (± 10.18%) indicates that
among all signals classified as good by the model,
Table 1: Results per External Fold with Mean and Standard
Deviation (SD=Standard Deviation).
Fold Acc Pre Rec Sp F1
1 85.71% 85.71% 85.71% 85.71% 85.71%
2 85.71% 77.78% 100.00% 71.43% 87.50%
3 85.71% 77.78% 100.00% 71.43% 87.50%
4 78.57% 75.00% 85.71% 71.43% 80.00%
5 100.00% 100.00% 100.00% 100.00% 100.00%
Mean 87.14% 83.25% 94.29% 80.00% 88.14%
SD ±7.82% ±10.18% ±7.82% ±12.78% ±7.31%
Table 2: Best Hyperparameters per External Fold.
Fold Hyperparameters
1, 3, 4, and 5
batch size: 10
epochs: 90
model dropout rate: 0.5
model input shape: (250, 334, 3)
model learning rate: 0.0001
model optimizer: adam
2
batch size: 10
epochs: 90
model dropout rate: 0.5
model input shape: (250, 334, 3)
model learning rate: 0.00005
model optimizer: adam
83.25% were indeed good. However, the relatively
high standard deviation of 10.18% suggests consid-
erable variability in precision across different folds.
In some cases, bad signals may be classified as good,
negatively impacting the quality of subsequently de-
rived features and potentially leading to inaccurate di-
agnoses or measurements.
The recall of 94.29% (± 7.82%) demonstrates that
the model is highly effective in identifying good sig-
nals, capturing most true positive signals. High recall
is essential to prevent lost good-quality signals, re-
sulting in poor feature extraction.
The specificity of 80.00% (± 12.78%) reveals the
proportion of bad signals correctly identified by the
model. A low value indicates potential inconsisten-
cies in identifying bad signals, likely due to an unbal-
anced dataset and the applied data augmentation.
Finally, the F1-Score of 88.14% (± 7.31%) offers
a balanced measure between precision and recall, pro-
viding an overall view of the model’s effectiveness in
PPG signal classification. The high F1-Score con-
firms that the model maintains a good balance be-
tween avoiding false positives and not missing good
signals, resulting in a high-quality dataset for feature
extraction. This balance is essential to ensure that
the extracted features are representative and accurate,
improving the reliability of subsequent analyses and
contributing to more precise diagnoses and measure-
ments in medical applications.
Fold 5 achieved 100% across all metrics; however,
PPG Signal Quality Classification Using STFT and CNN with the BUT PPG Database
925

this result is unusually high compared to the other
folds. Since each internal fold was handled by Grid-
SearchCV, further investigation is required to identify
the factors that may have contributed to this outcome.
Table 3: Performance Comparison Metrics.
Reference Dataset Rec Sp Acc
Sukor et al. (2011)
13 subjects,
104 segments,
60s
89% 77% 83%
Li and Clifford (2012)
104 subjects,
1055 segments,
6s
99% 80.6% 95.2%
Couceiro et al. (2014)
15 subjects,
330 segments,
60s
84.3% 91.5% 88.5%
Cherif et al. (2016)
104 segments,
60s
84% 83% 83%
Liu et al. (2020)
20 subjects,
12876 segments,
7s
91.8% 87.3% 89.9%
Chen et al. (2021)
102 subjects,
5804 segments,
10s
98.9% 96.7% 98.3%
Proposed
12 subjects,
48 segments,
10s
94.3% 80% 87.14%
Table 3 highlights the performance comparison
across various studies. The best results among the
smaller datasets are underlined, while the overall best
results are in bold.
Although the mean values for the proposed
method’s recall (94.3% ±7.8%), precision (83.25%
±10.18%), and specificity (80% ±12.8%) are lower
than those obtained by Chen et al. (2021) (98.9%,
98.8%, and 96.7%, respectively), the overlap of the
standard deviations suggests that some differences
might not be statistically significant. Specifically, the
recall values show overlap, indicating that the ability
to identify positive cases correctly might be compara-
ble between the two datasets, demonstrating compet-
itive performance considering the constraints of our
dataset. However, the more considerable differences
in specificity and precision suggest a reduced ability
of the proposed method to correctly classify negative
samples and avoid false positives when applied to the
BUT PPG database.
The proposed method achieved the highest recall
(94.3%) among studies with smaller datasets, sur-
passing Couceiro et al. (2014), who reported a speci-
ficity of 91.5%. However, the dataset used by Cou-
ceiro et al. (2014) included a larger number of seg-
ments, many of which contained motion artifacts, po-
tentially favoring artifact detection. Regarding ac-
curacy, Liu et al. (2020) achieved the highest value
(89.9%) among studies with smaller datasets, likely
due to their dataset containing the largest number of
segments. In contrast, our method achieved an ac-
curacy of 87.14% (±7.82%) despite working with a
significantly smaller dataset.
Furthermore, our method maintained a strong bal-
ance between precision and recall, as evidenced by
an F1-Score of 88.14% (±7.31%), highlighting its ro-
bustness in identifying good-quality signals. These
results underscore the effectiveness of the proposed
method in handling datasets with fewer samples,
fewer subjects, and lower sampling rates, demonstrat-
ing its applicability in scenarios such as wearable de-
vices, where data collection constraints are common
and often encountered in research studies.
4 CONCLUSION
This study demonstrated the effectiveness of STFT
and deep learning models for classifying PPG signals
into good and bad, even in an imbalanced dataset with
few samples and lower sampling rates. The proposed
methodology, which included signal pre-processing,
spectrographic image generation, and CNN train-
ing, proved effective in identifying and eliminat-
ing low-quality signals, improving the accuracy of
subsequently extracted features. The nested cross-
validation, performed with five external folds and two
internal stratified folds, allowed for hyperparameter
optimization and a robust evaluation of the model’s
performance. The results highlight the proposed ap-
proach’s effectiveness, improving the extraction of
features from PPG signals by collecting 94.29% (±
7.82%) of good signals and filtering 80% (± 12.78%)
of bad signals.
ACKNOWLEDGEMENT
The authors thank FEI for their support.
REFERENCES
Al, G., La, A., L, G., Jm, H., Pc, I., Rg, M., Je, M., Gb,
M., Ck, P., and He, S. (2000). PhysioBank, Phys-
ioToolkit, and PhysioNet: components of a new re-
search resource for complex physiologic signals. Cir-
culation, 101(23). Publisher: Circulation.
Attivissimo, F., De Palma, L., Di Nisio, A., Scarpetta, M.,
and Lanzolla, A. M. L. (2023). Photoplethysmogra-
phy Signal Wavelet Enhancement and Novel Features
Selection for Non-Invasive Cuff-Less Blood Pressure
Monitoring. Sensors, 23(4):2321.
Avram, R., Olgin, J. E., Kuhar, P., Hughes, J. W., Marcus,
G. M., Pletcher, M. J., Aschbacher, K., and Tison,
G. H. (2020). A digital biomarker of diabetes from
smartphone-based vascular signals. Nature Medicine,
26(10):1576–1582.
BIOSIGNALS 2025 - 18th International Conference on Bio-inspired Systems and Signal Processing
926

Chen, J., Sun, K., Sun, Y., and Li, X. (2021). Signal Qual-
ity Assessment of PPG Signals using STFT Time-
Frequency Spectra and Deep Learning Approaches.
In 2021 43rd Annual International Conference of the
IEEE Engineering in Medicine & Biology Society
(EMBC), pages 1153–1156, Mexico. IEEE.
Cherif, S., Pastor, D., Nguyen, Q.-T., and L’Her, E. (2016).
Detection of artifacts on photoplethysmography sig-
nals using random distortion testing. In 2016 38th An-
nual International Conference of the IEEE Engineer-
ing in Medicine and Biology Society (EMBC), pages
6214–6217, Orlando, FL, USA. IEEE.
Chettri, N., Aprile, A., Bonizzoni, E., and Malcovati, P.
(2024). Advances in PPG Sensors Data Acquisition
With Light-to-Digital Converters: A Review. IEEE
Sensors Journal, 24(16):25261–25274.
Couceiro, R., Carvalho, P., Paiva, R. P., Henriques, J., and
Muehlsteff, J. (2014). Detection of motion artifact pat-
terns in photoplethysmographic signals based on time
and period domain analysis. Physiological Measure-
ment, 35(12):2369–2388.
Islam, M. J., Ahmad, S., Haque, F., Reaz, M. B. I., Bhuiyan,
M. A. S., and Islam, M. R. (2022). Application of
Min-Max Normalization on Subject-Invariant EMG
Pattern Recognition. IEEE Transactions on Instru-
mentation and Measurement, 71:1–12.
Li, Q. and Clifford, G. D. (2012). Dynamic time warp-
ing and machine learning for signal quality assess-
ment of pulsatile signals. Physiological Measurement,
33(9):1491–1501.
Liu, S.-H., Liu, H.-C., Chen, W., and Tan, T.-H. (2020).
Evaluating Quality of Photoplethymographic Signal
on Wearable Forehead Pulse Oximeter With Su-
pervised Classification Approaches. IEEE Access,
8:185121–185135. Conference Name: IEEE Access.
Makowski, D., Pham, T., Lau, Z. J., Brammer, J. C.,
Lespinasse, F., Pham, H., Sch
¨
olzel, C., and Chen, S.
H. A. (2021). NeuroKit2: A Python toolbox for neu-
rophysiological signal processing. Behavior Research
Methods, 53(4):1689–1696.
Monte-Moreno, E. (2011). Non-invasive estimate of blood
glucose and blood pressure from a photoplethysmo-
graph by means of machine learning techniques. Arti-
ficial Intelligence in Medicine, 53(2):127–138.
Nemcova, A., Smisek, R., Vargova, E., Mar
ˇ
s
´
anov
´
a, L.,
Vitek, M., and Smital, L. (2021a). Brno University of
Technology Smartphone PPG Database (BUT PPG).
https://physionet.org/content/butppg/1.0.0/.
Nemcova, A., Vargova, E., Smisek, R., Marsanova, L., Smi-
tal, L., and Vitek, M. (2021b). Brno University of
Technology Smartphone PPG Database (BUT PPG):
Annotated Dataset for PPG Quality Assessment and
Heart Rate Estimation. BioMed Research Interna-
tional, 2021(1):3453007.
Park, P., Lee, W., and Cho, S. (2023). An Adaptive Filter
Based Motion Artifact Cancellation Technique Using
Multi-Wavelength PPG for Accurate HR Estimation.
IEEE Transactions on Biomedical Circuits and Sys-
tems, 17(5):1074–1083.
Polak, A. G., Klich, B., Saganowski, S., Prucnal, M. A.,
and Kazienko, P. (2022). Processing Photoplethys-
mograms Recorded by Smartwatches to Improve the
Quality of Derived Pulse Rate Variability. Sensors,
22(18):7047.
Ronca, V., Martinez-Levy, A. C., Vozzi, A., Giorgi, A.,
Aric
`
o, P., Capotorto, R., Borghini, G., Babiloni, F.,
and Di Flumeri, G. (2023). Wearable Technologies for
Electrodermal and Cardiac Activity Measurements: A
Comparison between Fitbit Sense, Empatica E4 and
Shimmer GSR3+. Sensors, 23(13):5847.
Suboh, M. Z., Jaafar, R., Nayan, N. A., Harun, N. H., and
Mohamad, M. S. F. (2022). Analysis on Four Deriva-
tive Waveforms of Photoplethysmogram (PPG) for
Fiducial Point Detection. Frontiers in Public Health,
10:920946.
Sukor, J. A., Redmond, S. J., and Lovell, N. H. (2011). Sig-
nal quality measures for pulse oximetry through wave-
form morphology analysis. Physiological Measure-
ment, 32(3):369–384.
Xie, C., McCullum, L., Johnson, A., Pollard, T.,
Gow, B., and Moody, B. (2023). Waveform
Database Software Package (WFDB) for Python.
https://physionet.org/content/wfdb-python/.
Zanelli, S., Ammi, M., Hallab, M., and El Yacoubi,
M. A. (2022). Diabetes Detection and Manage-
ment through Photoplethysmographic and Electrocar-
diographic Signals Analysis: A Systematic Review.
Sensors, 22(13):4890.
PPG Signal Quality Classification Using STFT and CNN with the BUT PPG Database
927
