
Evaluating LIME and SHAP in Explaining Malnutrition Classification in
Children Under Five
Nuru Nabuuso
Department of Engineering, Universitat Pompeu Fabra, Roc Boronat 138, Barcelona 08018, Spain
Keywords:
Machine Learning Methods, Classification, XGBoost, Feature Selection, Explainable AI.
Abstract:
Malnutrition in children under five is a significant public health issue in Uganda, with severe impacts on devel-
opment and mortality. This paper explores machine learning (ML) models—Support Vector Machines (SVM),
eXtreme Gradient Boosting (XGBoost), and Artificial Neural Networks (ANNs) — to predict malnutrition,
and reports that XGBoost shows highest predictive accuracy. While the findings on XGBoost employed global
model interpretation through feature importance based on permutations, we also introduce SHapley Additive
exPlanations (SHAP) for both local and global interpretations. We follow with a focus on SHAP summary
plots and bar charts to evaluate feature importance globally. In addition, we report on the comparison be-
tween SHAP and Local Interpretable Model-agnostic Explanations (LIME) to analyze the consistency of local
explanations provided by both techniques. By contrasting LIME and SHAP, we advance the alignment be-
tween local and global interpretations in the context of XGBoost predictions. This comparison highlights the
strengths and limitations of each method. Our findings aim to enhance the transparency of ML models and
improve decision-making in child health interventions, providing significant insights into public health and
ML interpretability.
1 INTRODUCTION
Malnutrition among children under five years of age
remains a significant public health issue, particularly
in low-resource settings such as Uganda (Kikafunda
et al., 1998). Early detection and intervention are
critical for improving outcomes, but identifying at-
risk children is often challenging due to the com-
plex interplay of factors that contribute to malnu-
trition (Sermet-Gaudelus et al., 2000). ML tech-
niques have shown great promise in predictive mod-
eling for health outcomes, offering the potential to
enhance early diagnosis and provide tailored inter-
ventions (Talukder and Ahammed, 2020; Islam et al.,
2022; Bitew et al., 2022; Gadekallu et al., 2021). We
report here on the application of ML models, includ-
ing SVM, XGBoost, and ANNs to predict malnutrition
in children under five.
While Artificial Intelligence and ML are penetrat-
ing many fields, there is an urgent and pressing need
not only to achieve high accuracy but also to achieve
explainability. Despite the potential of ML models,
relatively little research has focused on explaining the
predictions of models specifically designed to iden-
tify malnutrition in children under five (Talukder and
Ahammed, 2020). In health contexts, where decisions
can have profound effects on patient outcomes, in-
terpretability is just as important as predictive accu-
racy (ElShawi et al., 2021). Explainability is crucial
for transparency (now required in some regions by
legislation) and for trust (essential for user adoption).
Clinicians, public health officials, and policy makers
require models that not only provide accurate predic-
tions but also offer clear and understandable insights
into the factors driving those predictions. To address
this need, we employ feature importance based on
permutations to generate global explanations for the
model, offering an overall view of how features in-
fluence predictions. However, this method may not
capture the complete dynamics of feature interactions
in complex models. LIME and SHAP are arguably
the most used approaches to gain insights into the
outputs produced by classifiers and generate expla-
nations in human-understandable terms. This study
aims to provide local and global explanations using
SHAP (Lundberg and Lee, 2017).
SHAP offers a more theoretically grounded ap-
proach by assigning importance scores to features
based on their contribution to the model’s predictions.
To assess global feature importance, we use SHAP
Nabuuso, N.
Evaluating LIME and SHAP in Explaining Malnutrition Classification in Children Under Five.
DOI: 10.5220/0013186500003905
In Proceedings of the 14th International Conference on Pattern Recognition Applications and Methods (ICPRAM 2025), pages 291-298
ISBN: 978-989-758-730-6; ISSN: 2184-4313
Copyright © 2025 by Paper published under CC license (CC BY-NC-ND 4.0)
291

summary plots and bar charts. We compare SHAP’s
results with permutation-based feature importance to
evaluate whether global interpretations remain con-
sistent across these methods. Sometimes LIME and
SHAP concur in their conclusions about a classifier’s
decision that has been deemed the most suitable for
some applications. Sometimes this is not the case.
Therefore, we contrast here SHAP with LIME for lo-
cal interpretations (Ribeiro et al., 2016). LIME gener-
ates locally interpretable explanations by approximat-
ing the model’s behavior in the vicinity of individ-
ual predictions, while SHAP provides consistent lo-
cal explanations by leveraging cooperative game the-
ory. By comparing both local and global explana-
tions, we aim to assess the consistency and effective-
ness of these interpretability techniques in enhancing
model transparency and improving decision-making
in child health interventions.
We will first report on the application of ML to
predict malnutrition. Among the models we tested,
the XGBoost classifier achieved the highest accuracy
in predicting whether a child is stunted, wasted, or
underweight. We, therefore, further explore the ex-
plainability of XGBoost results through interpretabil-
ity techniques to enhance understanding and trust in
the model’s predictions (Ribeiro et al., 2016). There-
fore, this paper aims to also evaluate the consistency
of XGBoost results through a thorough assessment of
its interpretability using SHAP and LIME.
2 RELATED RESEARCH
We proceed to review some studies in the context of
health where, at least LIME and SHAP have been
used for explainability (among perhaps some other
approaches). (Kumar et al., 2024) explored the ap-
plication of various ML models for detecting ane-
mia and predicting its severity. The study analyzed
a dataset of 364 individuals, using Logistic Regres-
sion, K-Nearest Neighbors (KNN), SVM, Decision
Tree, and Random Forest. (Pedregosa et al., 2011)’s
study applies two implementations of hyperparam-
eter finding: GridSearchCV and RandomSearchCV.
Additionally, the study evaluated boosting techniques
like AdaBoost, Gradient Boosting, CatBoost, and
XGBoost. To understand the model’s predictions bet-
ter, they employed LIME and SHAP. Among the
models used, Random Forest gave the highest accu-
racy of 89.04%. The accuracy was 86.30% for the
Decision Tree classifier, 87.67% for logistic regres-
sion, 78.08% for KNN and 87.67% for SVM. Making
Random Forest the best choice for such a data set.
(Aldughayfiq et al., 2023) explored LIME and
SHAP to generate local and global explanations
for a deep learning model based on inceptive V3
architecture trained on retinoblastoma and non-
retinoblastoma fungus images. Since deep learning
models are considered black-box models, they ap-
plied LIME and SHAP to generate explanations on
the validation and test sets. Their results showed
that LIME and SHAP provided valuable insights and
showed areas or parts of the images that contributed
to the models’ predictions both locally and globally.
In that research, SHAP provided more accurate results
and provided effective explanations in identifying the
important sections of the images.
LIME and SHAP explanations have also been ex-
tensively used in analyzing Electronic Health Records
(EHRs) (Di Martino et al., 2023), where LIME, SHAP
and Scoped Rules (Ribeiro et al., 2018) are applied
to compute feature importance for ML predictions.
These explainability techniques generated top fea-
tures, offering deeper insights into the model’s results.
In that study, three XAI methods were employed to
demonstrate the effectiveness of explainable conclu-
sions in ML models and provide data interpretability
for large-scale EHR data. Specifically, ML models
were applied alongside XAI methods to study lung
cancer mortality.
3 SUITABLE CLASSIFIER
In this section, we report in our evaluation of three
ML approaches to predict malnutrition in children
under five. We use data from the 2016 Uganda De-
mographic and Health Survey (UDHS)https://www.
dhsprogram.com/data/dataset admin/login main.cfm
for our study. The Uganda Bureau of Statistics
(UBOS) implemented the 2016 UDHS and covers
household and respondent characteristics. The
dataset consists of 5379 records and includes history
of all women and children health born in the last
5 years prior to the survey (our unit of analysis)
with parental or guardian consent. The three ML
classification models we used are as follows.
XGBoost: It is an efficient implementation of the gra-
dient boosting algorithm designed for both classi-
fication and regression tasks. It builds an ensem-
ble of decision trees sequentially, where each tree
attempts to correct the errors of the previous ones.
SVM: It works by finding the hyperplane that best
separates data into different classes after mapping
to a higher dimensional space.
ANN s: It is a computational model, consisting of in-
terconnected nodes (neurons) organized in layers.
ICPRAM 2025 - 14th International Conference on Pattern Recognition Applications and Methods
292

These networks are particularly adept at capturing
complex patterns in large datasets through the use
of non-linear activation functions.
3.1 Study Variables and Measurements
The classes of interest are stunted (that involves the
ratio of height to age — h/a), wasted (for the ratio
of weight to height — w/h) and underweight (consid-
ering the ratio of weight to age — w/a). We used
Z-scores of anthropometric measurements to evalu-
ate the nutritional status for the children. We used
the World Health Organisation (WHO) AnthroPlus
software to compute the Z-scores (WHO, 2007). The
WHO defines the Z-scores for the class labels as dis-
placement (in proportion to the corresponding stan-
dard deviation σ) from the corresponding mean value
µ:
stunted: height-to-age < −2 × σ
h/a
+ µ
h/a
;
wasted: weight-to-height < −2 × σ
w/h
+ µ
w/h
and
underweight: weight-to-age < −2 × σ
w/a
+ µ
w/a
.
Severely stunted, wasted and underweight are those
children whose height-to-age, weight-to-height or
weight-to-age Z-score are below minus 3 (-3) stan-
dard deviations from the corresponding median. The
classes were binary coded as 1 for stunted, wasted and
underweight if the standard was met, else they were
coded as 0.
3.2 Data Preprocessing and Feature
Selection
We encoded the data into numerical values using one-
hot encoding. We removed data noise and inconsis-
tencies and used box plots to remove outliers too.
We replaced missing values with the mean or mode
depending on the data structure and used linear re-
gression to predict missing values for anthropome-
try measurements that were used to compute the Z-
Scores. We computed the correlation matrix to find
the strength of association between independent vari-
ables using an absolute value of 0.6 as the thresh-
old for retaining a variable. If two variables were
found to be correlated, we dropped the variable with a
lower correlation coefficient value to the target class.
We also computed multiple correlation coefficients to
check whether more than two variables are correlated.
We employed the feature permutation method to eval-
uate the importance of features for the models. This
method consists of randomly shuffling the values of
a specific feature to measure the impact on classifica-
tion though it is computationally expensive.
The imbalanced dataset challenge was addressed
by using SMOTE technique which randomly in-
creases the minority class examples thereby pre-
venting over-fitting. For this study we used strat-
ified cross-validation. In K-Fold cross-validation,
the dataset is split into K smaller sets or “folds”.
The model is trained on K-1 folds and tested on
the remaining fold. The stratified approach en-
sured that the evaluation metrics were reliable, even
with skewed class distributions, and helped in fine-
tuning the model parameters by providing insights
into its performance on various data partitions. The
cross-validation process not only improved the overall
model accuracy but also helped mitigate over-fitting,
making the models more generalizable to unseen
data.By combining stratified K-Fold cross-validation
with the SMOTE technique we ensured that the mod-
els were both accurate and resilient to the dataset.
3.3 Model Evaluation and Performance
Comparison
We applied several evaluation metrics to assess model
performance. A confusion matrix was used to de-
termine True Positives (TP), True Negatives (TN),
False Positives (FP), and False Negatives (FN). This
allowed for the calculation of key metrics such as Ac-
curacy, Sensitivity, and Specificity. All models per-
formed well with variations depending on the tuning
technique applied to them. The SVM gave its best per-
formance when the RBF kernel was used, see Table 1.
This kernel out-performed other kernels like Poly,
Linear and Sigmoid. We applied GridsearchCV,
and this hyper-parametrization optimized all models,
resulting in XGBoost displaying the best respective
performance (see Table 2).
Table 1: SVM kernel accuracy (as percentage).
Kernel type stunted underweight wasted
RBF 64.2 89.0 94.3
Linear 51.0 58.6 59.2
Poly 49.6 50.2 50.8
Sigmoid 50.3 51.2 62.8
Table 2 shows superior results by XGBoost classi-
fier outperforming SVM and ANN across all classes.
Table 2: Accuracy (as percentage with 95% confidence
interval).
Classifier stunted underweight wasted
SVM 64.21 ± 1.02 89.02 ± 0.43 94.35 ± 0.43
ANN 62.52 ± 0.43 62.95 ± 0.58 61.98 ± 0.82
XGBoost 74.35 ± 0.82 95.67 ± 0.56 98.17 ± 0.43
Evaluating LIME and SHAP in Explaining Malnutrition Classification in Children Under Five
293

4 EXPLAINABLE AI METHODS
4.1 Hypotheses
We hypothesise that LIME and SHAP provide more
consistent and accurate local and global interpreta-
tions of XGBoost model predictions for malnutrition
in children under five years.
4.2 XAI Methods
LIME provides local interpretation for black-box
models, such as XGBoost, by approximating the com-
plex model f locally around a specific instance x us-
ing a simpler interpretable model g (Zhang et al.,
2019; Lee et al., 2019). The objective is to minimize a
loss function L that measures how well g matches f ’s
predictions for instances sampled around x, defined
as:
L(g) =
∑
x
i
∈Z
π
x
(x
i
) · ( f (x
i
) − g(x
i
))
2
,
where Z is the set of sampled instances, π
x
(x
i
) is the
proximity weight of x
i
relative to x, f (x
i
) is the pre-
diction from f , and g(x
i
) is the prediction from g. A
regularization term Ω(g), such as the number of fea-
tures used, penalizes complexity. The final objective
is to minimize the total loss, combining prediction er-
ror and complexity.
SHAP explains feature contributions to predic-
tions using Shapley values from cooperative game
theory (Rodr
´
ıguez-P
´
erez and Bajorath, 2019). The
relevance of a feature i is a player contribution φ
i
to
the final prediction defined as:
φ
i
=
∑
S⊆Z\{i}
|S|! (|Z| − |S| − 1)!
|Z|!
[ f (S ∪ {i}) − f (S)],
where Z is the set of all features, S is a subset of fea-
tures excluding i, f (S) is the prediction based on S,
and f (S ∪ {i}) is the prediction when i is added to S.
The weight ensures a fair contribution based on sub-
sets’ sizes.
Feature Permutations assess feature importance
by measuring the performance drop when feature val-
ues are randomly permuted (Casalicchio et al., 2019).
Permuting values of influential features significantly
erodes model performance, while less important fea-
tures have minimal impact. However, this method
can underestimate the importance of highly correlated
features. We use the above XAI methods to explain
the XGBoost model globally and locally.
5 EXPERIMENTS
We independently fitted each class using the XGBoost
classifier because of its superior performance in pre-
dicting malnutrition. To explain the XGBoost model
globally, we used the feature permutation method and
SHAP method. Both approaches provide insights into
the overall behavior of the model, identifying the most
influential features across the dataset.
For feature permutations, we created a copy of the
dataset where the values of each feature were ran-
domly permuted, breaking its relationship with the
target variable while keeping other features intact.
The XGBoost model then made predictions on the
permuted datasets, and we compared the performance
metrics with those from the original dataset. The drop
in performance for each feature indicated its impor-
tance; more significant drops signified greater impor-
tance. We performed multiple iterations of the per-
mutation process to obtain stable estimates of feature
importance, which we averaged to summarize each
feature’s impact.
Conversely, we computed SHAP values using the
SHAP library installed in our Python environment.
These values provided an alternative perspective on
feature importance, complementing the insights de-
rived from feature permutations.
6 INTERPRETATION AND
DISCUSSION
The comparison of feature importance results from
feature permutations and SHAP revealed consistent
findings in globally explaining the XGBoost model.
Both methods identified the same top three fea-
tures—size of child at birth, partner’s age, and age of
household head—for predicting stunted and wasted.
For the class underweight, the top two features were
consistent, while the rankings of other features varied
across the three malnutrition indicators, as shown in
Table 3.
Table 3: Table showing the top three features for the differ-
ent methods.
Class Top Permutation Features Top SHAP Features
stunted Size of child at birth Size of child at birth
Partner’s age Partner’s age
Age of household Head Age of household Head
underweight Size of child at birth Size of child at birth
Age of household Head Age of household Head
Number of children Partner’s age
wasted Size of child at birth Size of child at birth
Place of delivery Number of U5 in household
Number of U5 in household Place of delivery
This consistency in the top features highlights
their strong and stable influence on the model’s pre-
ICPRAM 2025 - 14th International Conference on Pattern Recognition Applications and Methods
294

dictions. However, the variability in other fea-
ture rankings suggests that these may be context-
dependent or influenced by interactions with the con-
sistently ranked features. Such insights are crucial for
understanding the dynamics of malnutrition and de-
signing targeted interventions. The SHAP beeswarm
plots (Figure 1 and Figure 2) provide additional con-
text by illustrating how individual feature values cor-
relate with model predictions. For instance, larger
sizes at birth are associated with lower risks of stunt-
ing, while older partners reflect better household re-
sources. These visualizations complement the results
of permutation importance, as they show both the
magnitude and direction of feature impacts across dif-
ferent contexts. By comparing SHAP’s results with
permutation importance, the analysis validates the
strength and consistency of the identified features.
Both methods confirm the importance of the same
features and provide a comprehensive view of their ef-
fects on model predictions. Together, they strengthen
the interpretation of the XGBoost classifier by offer-
ing robust global insights into feature importance, as
illustrated by the referenced tables and figures (refer
to Figure 1).
7 LOCAL EXPLANATION USING
LIME AND SHAP
To apply LIME, we randomly selected instance 80
within the class stunted, the class wasted, and the
class underweight and generated local explanations
using both LIME and SHAP. We compared their fea-
ture importance, magnitudes of importance, and qual-
itative differences in their explanations.
For feature importance, we extracted the top N
features identified by LIME and SHAP as contributing
most to the model’s prediction, comparing their rank-
ings to identify similarities or differences. We com-
pared the magnitude of feature contributions using the
absolute values of the contributions provided by both
methods. We assessed whether they assign similar or
different levels of importance to key features.
Finally, we explored the qualitative differences be-
tween LIME and SHAP explanations, focusing on the
localized nature of LIME’s explanations compared to
the local consistency of SHAP. This reveals insights
unique to each method. Since the visual represen-
tations for LIME and SHAP facilitate comparison,
we visually inspected the agreement or divergence in
their explanations.
7.1 Interpretation
7.1.1 Class Stunting
SHAP and LIME provided different feature impor-
tance to explain the same local instance. LIME iden-
tified (1) source of drinking water, (2) partners age
and (3) age of household head as the top features that
impact stunted. However, SHAP identified, (1) size of
child at birth, (2) partners age, (3) number of U5 in
household as the top three features (see Figure 4). Al-
though the top three features have different rankings,
partners age was ranked second for the two methods,
positively impacting the prediction in both cases. This
placing means that at some point, these two methods
agreed.
7.1.2 Class Underweight
LIME identified the top four features as (1) number of
antenatal visits, (2) partner’s age, (3) source of drink-
ing water and (4) size of child at birth in their order of
importance. Meanwhile, SHAP identified (1) number
of antenatal visits, (2) size of child at birth, (3) Num
of children and (4) partners age also in their impor-
tance order. These two methods shared the topmost
features, and they all showed that it negatively im-
pacted underweight (see Figure 5). In common, the
two methods shared three features in the ranked top 4
and all shared features agreed on how they impacted
the output; that is, all the same feature negatively im-
pacted the prediction.
7.1.3 Class Wasting
When explaining the local instance for wasted, LIME
identified (1) number of U5 in household, (2) size of
child at birth, (3) place of delivery, and (4) time to
water source as the top-ranked features. SHAP identi-
fied (1) number of U5 in household, (2) size of child at
birth, (3) source of drinking water and (4) time to wa-
ter source. LIME and SHAP identified the same top
two features and the 4th feature coincides across the
two methods. These features that were similar to both
methods also had the same ranking across as well as
the same impact on the prediction. That is, all three
features agreed on how they are positively or nega-
tively impacting the prediction (see Figure 6).
The agreement indicates that these features are
likely to contribute to the model’s decision-making
process significantly. The fact that the three features
are not only top-ranked but also exhibit similar influ-
ence, whether positive or negative, points to a coher-
ent narrative about the model’s behavior for this spe-
cific prediction. It also suggests that the model cap-
Evaluating LIME and SHAP in Explaining Malnutrition Classification in Children Under Five
295
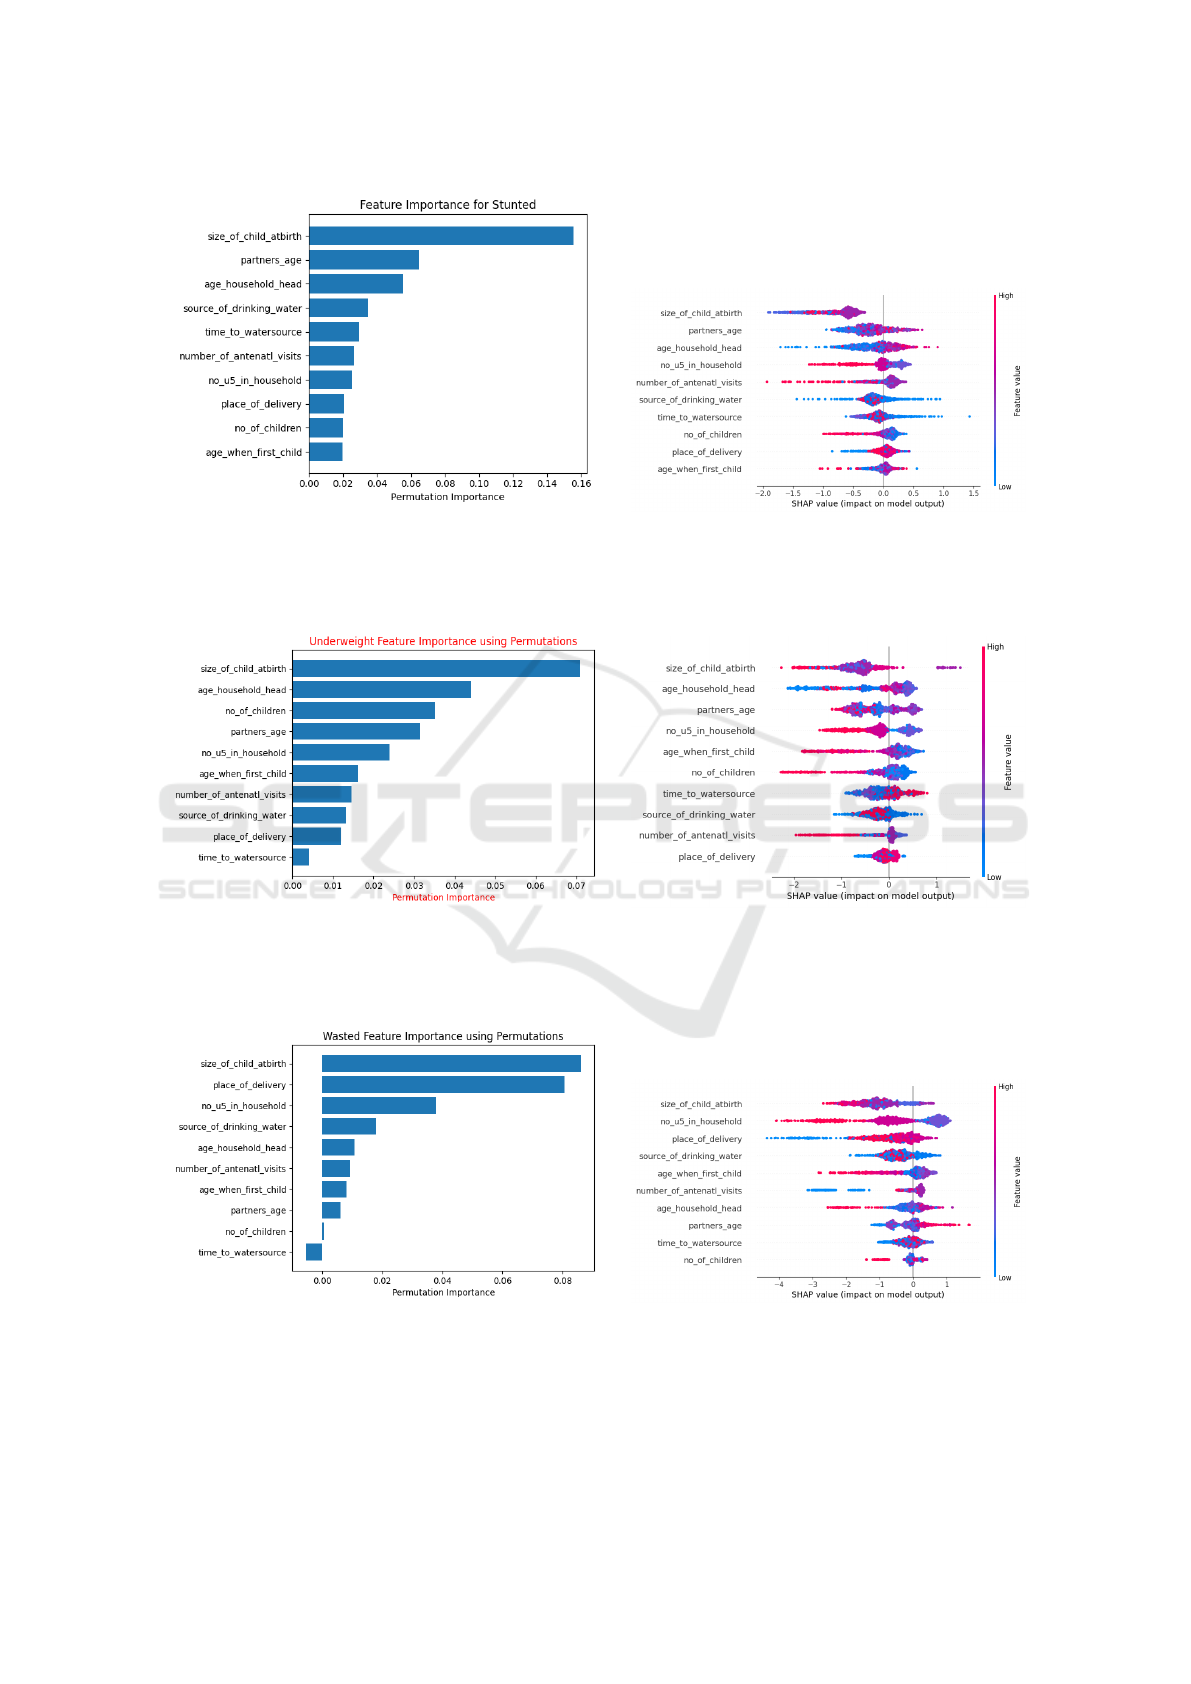
(a) Permutation feature importance plot showing the impact
of each feature on predicting stunted.
(b) SHAP beeswarm plot showing the impact of each fea-
ture on predicting stunted.
Figure 1: Comparisons of permutation feature importance and SHAP results for the class stunted.
(a) Permutation feature importance plot showing the impact
of each feature on predicting underweight.
(b) SHAP beeswarm plot showing the impact of each fea-
ture on predicting underweight.
Figure 2: Comparisons of permutation feature importance and SHAP results for the class underweight.
(a) Permutation feature importance plot showing the impact
of each feature on predicting wasted.
(b) SHAP beeswarm plot showing the impact of each fea-
ture on predicting wasted.
Figure 3: Comparisons of feature permutation’s importance and SHAP results for the class wasted.
ICPRAM 2025 - 14th International Conference on Pattern Recognition Applications and Methods
296
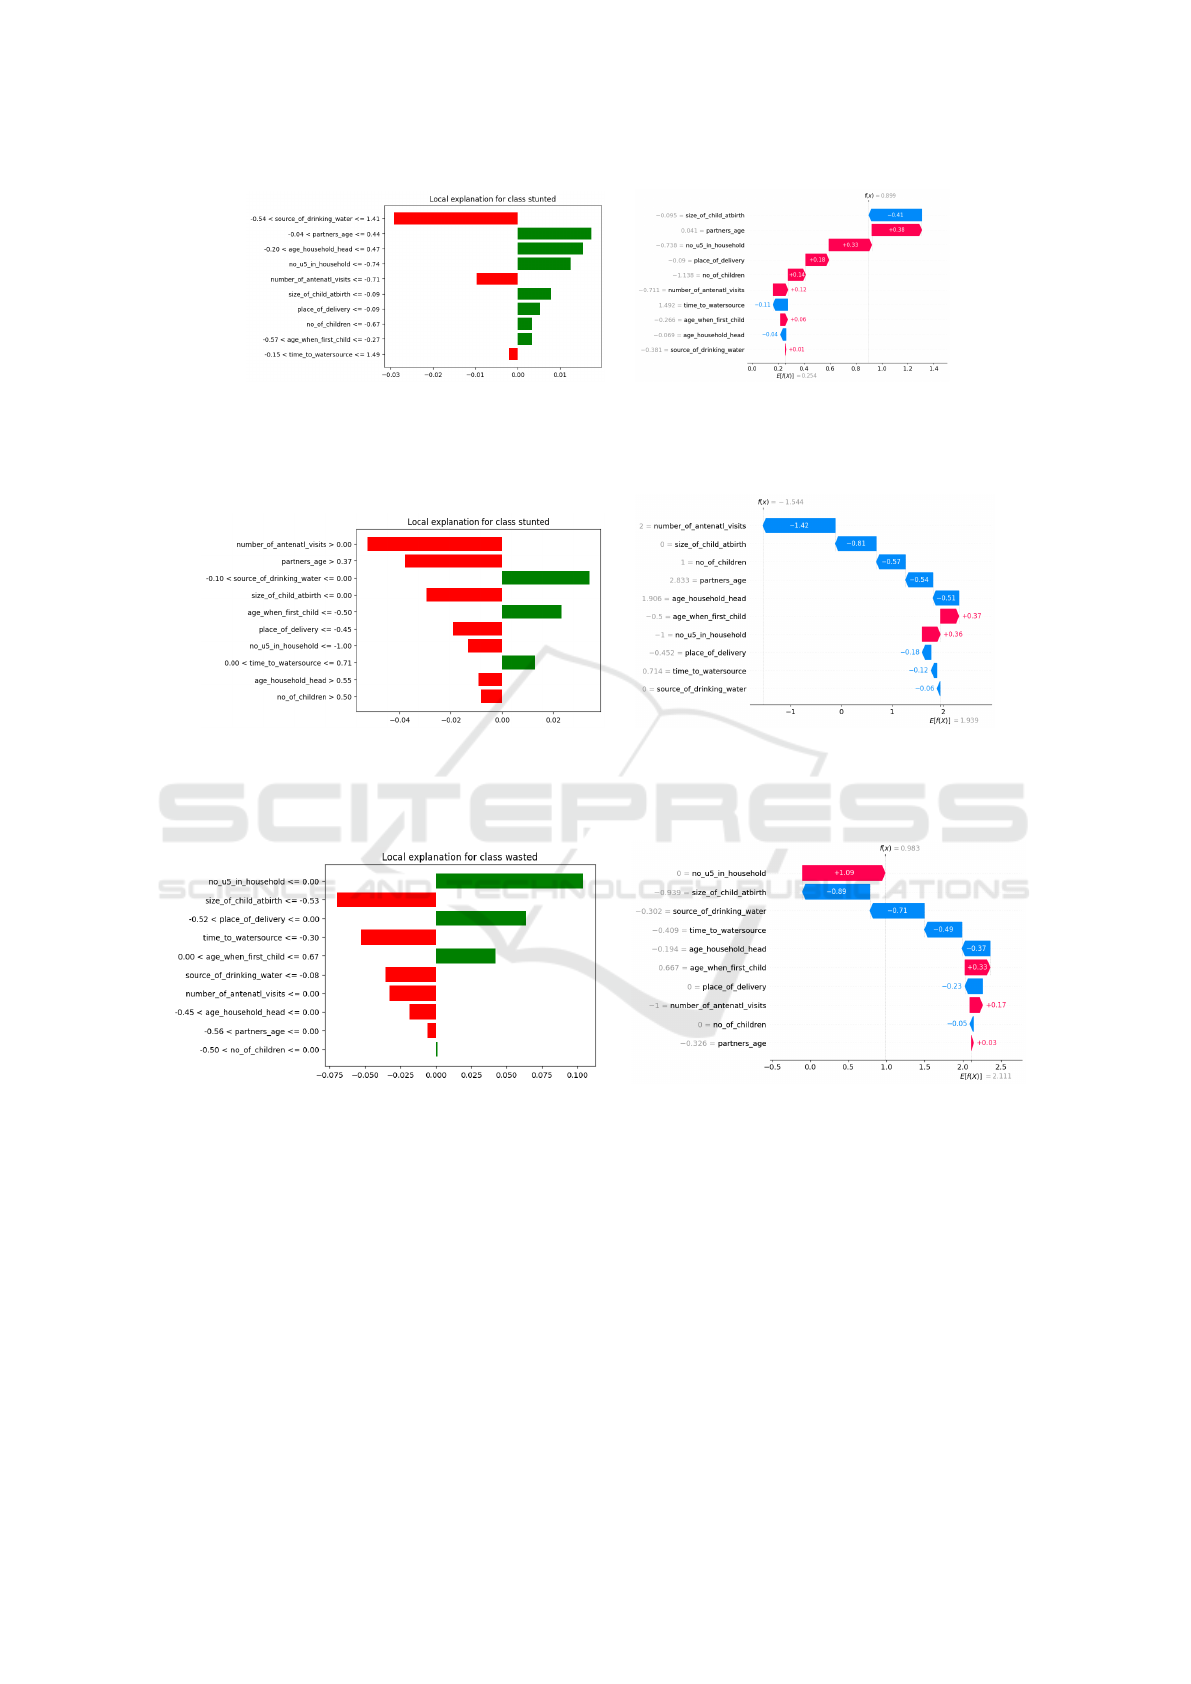
(a) LIME instance explanation for the class stunted. (b) SHAP instance explanation for the
classstunted.
Figure 4: Comparisons of LIME and SHAP results for the class stunted.
(a) LIME instance explanation for the class underweight. (b) SHAP instance explanation for the class under-
weight.
Figure 5: Comparisons of LIME and SHAP results for the class underweight.
(a) LIME instance explanation for the class wasted. (b) SHAP instance explanation for the class wasted.
Figure 6: Comparisons of LIME and SHAP results for the class wasted.
tures meaningful patterns, not just artifacts of one par-
ticular interpretability method. This consistency can
enhance stakeholder confidence in the model’s pre-
dictions and provide actionable and trusted insights
for decision-making.
8 CONCLUSIONS
We compared SHAP and LIME to evaluate the con-
sistency of local explanations provided by both meth-
ods and to compare globally identified feature im-
portance using SHAP values and feature permutation.
The convergence of insights from both feature permu-
tation and SHAP in explaining the predictions of the
XGBoost model for the classes stunted, wasted, and
underweight highlights a robust understanding of the
underlying factors influencing these classes.
The alignment between these methods enhances
confidence in the identified features, demonstrating
their consistent contribution to the model’s decisions.
Similarly, the agreement between LIME and SHAP
Evaluating LIME and SHAP in Explaining Malnutrition Classification in Children Under Five
297

underscores a robust interpretation of the model’s
workings, further validating the relevance of the iden-
tified features as reflections of underlying patterns
rather than artifacts of specific methods.
Additionally, the commons feature’s im-
pact—whether positive or negative—reinforces
the reliability of these features in influencing the
model’s outcomes. This convergence of results is
significant for practitioners, indicating that both inter-
pretability methods provide a similar understanding
of the model, enabling more precise insights for
decision-making.
ACKNOWLEDGMENTS
The author acknowledges the contribution of Ms.
Irene Wanyana, Dr. Isunju JohnBosco and Dr. Kiberu
Vincent who supervised part of this research while the
author was completing a Master Program at Makerere
University and Vladimir Estivill-Castro as current ad-
visor during the author’s PhD program.
REFERENCES
Aldughayfiq, B., Ashfaq, F., Jhanjhi, N., and Humayun, M.
(2023). Explainable ai for retinoblastoma diagnosis:
interpreting deep learning models with lime and shap.
Diagnostics, 13(11):1932.
Bitew, F. H., Sparks, C. S., and Nyarko, S. H. (2022). Ma-
chine learning algorithms for predicting undernutri-
tion among under-five children in ethiopia. Public
health nutrition, 25(2):269–280.
Casalicchio, G., Molnar, C., and Bischl, B. (2019). Visu-
alizing the feature importance for black box models.
In Proc. P. I Machine Learning and Knowledge Dis-
covery in Databases: European Conf., ECML PKDD
2018, pages 655–670. Springer.
Di Martino, F., Delmastro, F., and Dolciotti, C. (2023). Ex-
plainable ai for malnutrition risk prediction from m-
health and clinical data. Smart Health, 30:100429.
ElShawi, R., Sherif, Y., Al-Mallah, M., and Sakr, S. (2021).
Interpretability in healthcare: A comparative study
of local machine learning interpretability techniques.
Computational Intelligence, 37(4):1633–1650.
Gadekallu, T. R., Iwendi, C., Wei, C., and Xin, Q. (2021).
Identification of malnutrition and prediction of bmi
from facial images using real-time image processing
and machine learning. IET Image Process, 16:647–
658.
Islam, M. M., Rahman, M. J., Islam, M. M., Roy, D. C.,
Ahmed, N. F., Hussain, S., Amanullah, M., Abedin,
M. M., and Maniruzzaman, M. (2022). Application
of machine learning based algorithm for prediction of
malnutrition among women in bangladesh. Int. J. of
Cognitive Computing in Engineering, 3:46–57.
Kikafunda, J. K., Walker, A. F., Collett, D., and Tumwine,
J. K. (1998). Risk factors for early childhood malnu-
trition in Uganda. Pediatrics, 102(4):e45–e45.
Kumar, A., Chirag, Y., Kodipalli, A., and Rao, T. (2024).
Anemia detection and severity prediction using clas-
sification algorithms with optimized hyperparameters,
boosting techniques and xai. In 2024 5th Int. Conf. for
Emerging Technology (INCET), pages 1–5. IEEE.
Lee, E., Braines, D., Stiffler, M., Hudler, A., and Harborne,
D. (2019). Developing the sensitivity of lime for bet-
ter machine learning explanation. In Artificial intelli-
gence and machine learning for multi-domain opera-
tions applications, v. 11006, pages 349–356. SPIE.
Lundberg, S. M. and Lee, S.-I. (2017). A unified ap-
proach to interpreting model predictions. In Proc. 31st
Int. Conf. on Neural Information Processing Systems,
NIPS, page 4768–4777, Red Hook, NY, USA. Curran
Associates.
Pedregosa, F., Varoquaux, G., Gramfort, A., Michel, V.,
Thirion, B., Grisel, O., Blondel, M., Prettenhofer,
P., Weiss, R., Dubourg, V., et al. (2011). Scikit-
learn: Machine learning in python. Journal of ma-
chine learning research, 12(Oct):2825–2830.
Ribeiro, M. T., Singh, S., and Guestrin, C. (2016). ”Why
should I trust you?”: Explaining the predictions of any
classifier. In Proc. 22nd ACM SIGKDD Int. Conf. on
Knowledge Discovery and Data Mining, KDD, page
1135–1144, NY, USA. ACM.
Ribeiro, M. T., Singh, S., and Guestrin, C. (2018). An-
chors: High-precision model-agnostic explanations.
In Proc. 32nd AAAI Conf. on artificial intelligence.
AAAI Press.
Rodr
´
ıguez-P
´
erez, R. and Bajorath, J. (2019). Interpreta-
tion of compound activity predictions from complex
machine learning models using local approximations
and shapley values. Journal of medicinal chemistry,
63(16):8761–8777.
Sermet-Gaudelus, I., Poisson-Salomon, A.-S., Colomb, V.,
Brusset, M.-C., Mosser, F., Berrier, F., and Ricour, C.
(2000). Simple pediatric nutritional risk score to iden-
tify children at risk of malnutrition. The American
journal of clinical nutrition, 72(1):64–70.
Talukder, A. and Ahammed, B. (2020). Machine learning
algorithms for predicting malnutrition among under-
five children in bangladesh. Nutrition, 78:110861.
WHO (2007). World health organisation application
tools. https://www.who.int/tools/growth-reference-
data-for-5to19-years/application-tools. Accessed:
2023-11-06.
Zhang, Y., Song, K., Sun, Y., Tan, S., and Udell, M. (2019).
” why should you trust my explanation?” understand-
ing uncertainty in lime explanations. arXiv preprint
arXiv:1904.12991.
ICPRAM 2025 - 14th International Conference on Pattern Recognition Applications and Methods
298
