
RapViz: Rhyme Detection and Visualization of Rap Music
Paul M
¨
uller
1,2 a
, Lukas Panzer
2 b
, and Fabian Beck
2 c
1
University of Konstanz, Germany
2
University of Bamberg, Germany
Keywords:
Text Visualization, Rap Music, Rhyme Detection.
Abstract:
RapViz transforms lyrics and audio of rap music into interactive visualizations, highlighting assonance rhymes
and rhyme schemes. To accomplish this task, we have built a custom rhyme detector and extract respective
timestamps from the audio file. The visualization integrates dynamic, time-based components to present
insights from the rhyme analysis. Two linked views provide textual and temporal perspectives on a song. They
can be viewed as an animation while the song plays and explored interactively afterwards. We demonstrate
how our approach helps analyzing different songs covering different styles of rap.
1 INTRODUCTION
Over the past decades, hip-hop and rap music has
grown from an underground genre into an influen-
tial part of today’s music landscape. In 2021, for in-
stance, the genre held a US market share of about 30%
(Statista, 2024). With lyrical similarities to poetry, rap
places a significant emphasis on rhymes and rhyme
structures. While listeners can, of course, just enjoy
the music, at some point of engagement, it might be-
come more and more interesting for them to under-
stand what makes this type of music so poetic and
how rhymes interact with each other. However, ana-
lyzing rhymes is challenging and might require spe-
cialized knowledge.
There are already examples demonstrating how
animated visual representations of rhyme patterns can
facilitate the understanding of rap. Visualizations of
rhymes in popular songs can be found on platforms
like YouTube (e.g., Highlighted
1
) or on Genius (e.g.,
Check the Rhyme
2
). These visualizations feature text
scrolling that is synchronized with the song. Rhymes
are highlighted in color. However, these examples
are described as, or clearly appear to be, handcrafted
for each song individually. They provided inspira-
tion for us, but, in contrast, we wanted to develop
a
https://orcid.org/0009-0004-4084-7617
b
https://orcid.org/0009-0002-6805-0824
c
https://orcid.org/0000-0003-4042-3043
1
https://www.youtube.com/@Highlighted
2
https://genius.com/shows/ctr
an automatic processing and visualization solution,
as well as provide more interactive options for ex-
ploration. Partly, we already found this in an exam-
ple by The Wall Street Journal, who visually illus-
trated the rhymes of the Broadway hip-hop musical
Hamilton (Eastwood and Hinton, 2016a). Their ap-
proach involves translating words into phonetic lan-
guage and computing phonetic syllable similarity to
assign rhyme groups (Eastwood and Hinton, 2016b).
Additionally, they manually timestamped words to
display them synchronized with the music playback.
We strive to extend and automate this approach.
Hence, to make rhyme analysis of rap music more
accessible and widely applicable, we present RapViz,
an approach that automatically analyzes lyrics and
corresponding audio files for producing interactive vi-
sualizations. In the absence of an adequate rhyme de-
tection tool that met our requirements, we developed
a method to identify rhyme groups among syllables
within the lyrics. To enable a dynamic visualization,
we further extract timestamps for each syllable from
the corresponding audio file. As shown in Figure 1,
the visualizations we propose consist of two interac-
tively linked views. First, the lyrics of the song get
enriched by color to encode rhyme groups and arcs to
reveal end rhyme schemes. Second, a timeline view
complements an undistorted temporal perspective of
the internal rhyme patterns. When playing the song,
in both views concurrently, the visual encodings dy-
namically unfold. They stay persistent to allow ret-
rospective analysis of the whole song when the play-
back stops. While an expert panel allows more ex-
730
Müller, P., Panzer, L. and Beck, F.
RapViz: Rhyme Detection and Visualization of Rap Music.
DOI: 10.5220/0013190700003912
Paper published under CC license (CC BY-NC-ND 4.0)
In Proceedings of the 20th International Joint Conference on Computer Vision, Imaging and Computer Graphics Theory and Applications (VISIGRAPP 2025) - Volume 1: GRAPP, HUCAPP
and IVAPP, pages 730-739
ISBN: 978-989-758-728-3; ISSN: 2184-4321
Proceedings Copyright © 2025 by SCITEPRESS – Science and Technology Publications, Lda.
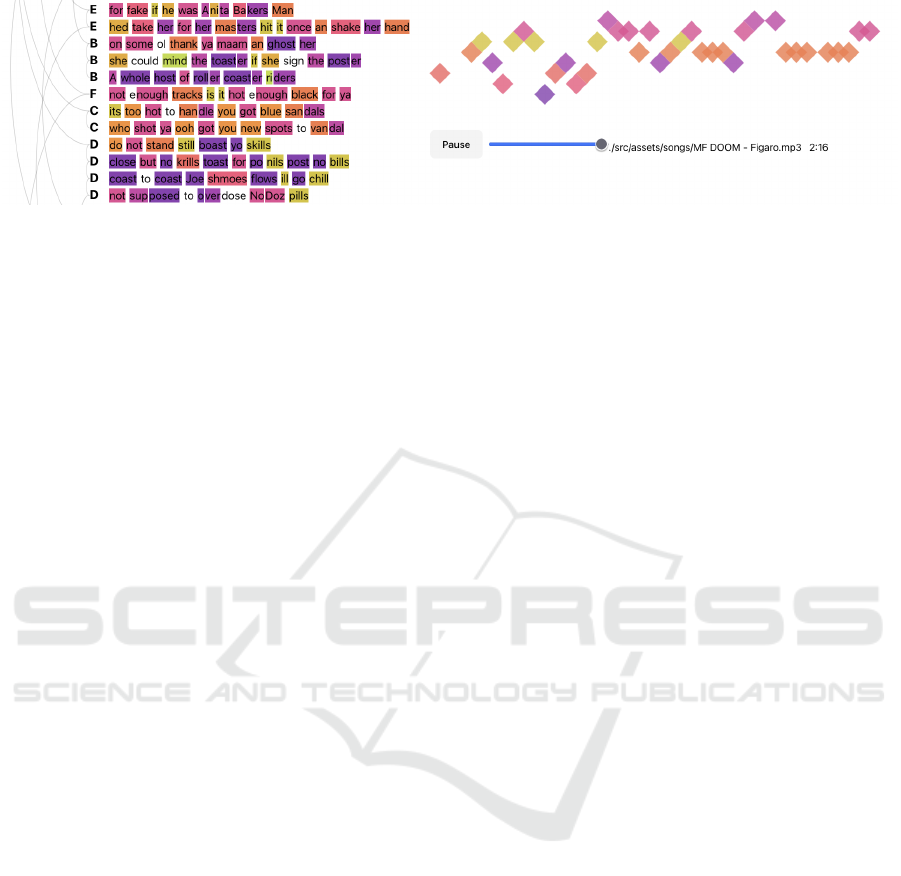
Figure 1: Main interface of RapViz consisting of the lyrics text with colored rhyme group highlighting (left; partly clipped) and
a corresponding timeline visualization (right); playback options and a slider (bottom-right) support navigation and listening
to the song while the visual encoding materializes. Example from Figaro by MF DOOM.
perienced users to test out different configurations of
algorithms and their key parameters, we made sure to
select a reliable default configuration so that manual
optimization is not required for a first analysis. In this
paper, we demonstrate the approach and its configura-
tions through analyzing the rhyme pattern of two rap
songs of different types.
2 RELATED WORK
While we are not aware of automated systems de-
signed for rhyme visualization of rap music, our work
relates to certain areas of text and music visualiza-
tion. Especially, the idea of visualizing rhymes in po-
ems has been explored before. Related are also mu-
sic visualizations that focus on analyzing individual
songs. Specific to rap, Meinecke et al. (2022a,b) use
automated methods to visualize similarities between
artists based on their lyrics; however, this does not
specifically address rhymes, and comparing artists is
beyond the scope of this work.
Noh et al. (2019) discern graphical from textual
poetry visualization—the former describing visual art
work to graphically complement a poem (comparable
to a music video complementing a rap song), the lat-
ter characterizing data-driven visual representations
to analyze the text. As an example for a textual vi-
sualization, ProseVis (Clement et al., 2013) analyzes
parts-of-speech, phonemes, stress and tone, and vi-
sualizes the data through color highlighting. Poem
Viewer (Abdul-Rahman et al., 2013) concentrates on
the phonetic elements of a poem and provides rich vi-
sual encodings of consonant properties, vowel length
and position, stress, syllables, as well as word classes
and sentiment analysis. SPARSAR (Delmonte, 2015)
enriches the poem’s text in three different views with
phonetic, poetic, and semantic information. Po-
emage (McCurdy et al., 2016) visualizes sonic de-
vices and sonic topology in poetry, revealing connec-
tions of words through sonic or linguistic similarity
across the poem. In contrast to such close reading
support, other approaches provide more aggregated
representation, rather for distant reading (Mittmann
et al., 2016; Benito-Santos et al., 2023; Lein et al.,
2018). They propose multi-level visualization tech-
niques that display poetic elements, visualize sonic
depth in poetic texts, and employ statistical analysis to
visualize rhythmic patterns in poetry. We can specifi-
cally draw inspiration from close reading, textual ap-
proaches and adapted a rhyme-based text highlight-
ing. As poems, unlike music, do not carry clearly de-
fined timing information, those approaches, however,
lack a distinct temporal perspective.
Among visualization techniques for musical data
(Khulusi et al., 2020), however, we find related time-
oriented methods. When visualizing musical align-
ment, similar sound patterns from sound or scores can
be detected (Dannenberg and Raphael, 2006). There
are various approaches that focus on enhancing exist-
ing score notations. Wattenberg (2002), for example,
enrich musical notation using arc diagrams to show
repeated sound patterns. Similar to rhymes in the do-
main of rap, there are approaches that visually classify
different harmonies using color and saturation (Ciuha
et al., 2010). While all visualizations in these ap-
proaches are static, there also exist relevant animated
methods. Both the visualization of active musical
components, e.g., harmonies, orchestration, phrases
and leitmotiv (Goss and Carson, 2016), as well as the
general structure of a music sheet (Bergstrom et al.,
2007) can be visualized using animated approaches
that demonstrate the dynamics or structure of a song
while it plays.
3 BACKGROUND
To study rap lyrics, first, clarifying some rap and po-
etry terminology is helpful. A verse is a section of
the lyrics comparable to a paragraph in a poem. In
rap, it is common for a verse to comprise 16 lines or
RapViz: Rhyme Detection and Visualization of Rap Music
731

My son said, daddy, I don’t wanna go to school (A)
Cause the teacher’s a jerk, he must think, I’m a fool (A)
And all the kids smoke reefer, I think it’d be cheaper (B)
If I just got a job, learned to be a street sweeper (B)
Figure 2: End rhyme scheme in The Message by Grandmas-
ter Flash & The Furious Five.
People really think my life is perfect (A)
Maybe ’cause I’m laughin’ through the worst shit (A)
Yeah, I know the Devil is alive but (X)
The way that I been movin’ got him nervous (A)
Figure 3: End rhyme scheme in Colorado by Kota the
Friend.
bars (Edwards, 2009). Generally, a line is defined as
“a group of words arranged into a row that ends for
a reason other than the right-hand margin” (Poetry
Archive, 2024). In contrast, a bar is a unit of time;
in almost all hip-hop tracks, one bar is equivalent to
four beats (Edwards, 2009). Note that in most cases,
one bar aligns with one line (Edwards, 2009). Hence,
we treat the terms bar and line interchangeably.
Along with rhythm, rhymes are one of the two
things that make the spoken word stand out in rap (Ed-
wards, 2009). Generally, rhymes are the repetition of
similar sounds (Wikipedia, 2024). There are differ-
ent rhyme types. Perfect rhymes adhere to two con-
ditions: The stressed vowel sound shared between the
two words must be identical, extending to any sub-
sequent sounds, and the onset of the stressed sylla-
ble in the words must differ. Identical rhymes occur
when the first condition for perfect rhymes is met, but
the second is not (Wikipedia, 2024). In contrast, as-
sonance is the “repetition of stressed vowel sounds
within words with different final consonants” (Ency-
clopaedia Britannica, 2024). Assonance is considered
the most widely used poetic device and type of rhyme
in rap (Edwards, 2009).
Patterns of rhymes form rhyme schemes that ex-
ceed the scope of two words. End rhymes refer to
the rhymes that occur between the terminal syllables
of verses (Merriam-Webster, 2024a). Figure 2 and
Figure 3 provide different examples of end rhymes
denoted as color and through identifiers. The first
uses perfect rhymes and scheme of AABB, the sec-
ond assonance and a scheme of AAXA (X denotes a
non-rhyming line ending). Internal rhymes consist
of “rhyme[s] between a word within a line and an-
other either at the end of the same line or within an-
other line” (Merriam-Webster, 2024b). The internal
rhymes of one bar can form a pattern that the artist
It’s too hot to handle, you got blue sandals
Who shot you? Ooh got you new spots to vandal?
Figure 4: Internal rhymes in Figaro by MF DOOM.
uses in multiple bars. In the example given in Fig-
ure 4, almost every word in these two bars contributes
to internal rhymes (here, denoted by color only).
For analyzing rhymes, we need to transcribe spo-
ken language sounds into written symbols. Phonetic
alphabets provide the required basis through encod-
ing phonemes, which are “the smallest phonetic unit
in a language capable of conveying a distinction in
meaning, as the m of mat and the b of bat” (The
American Heritage Dictionary, 2024). For English,
two widely accepted phonetic alphabets are the Inter-
national Phonetic Alphabet (IPA) and ARPAbet. In
this paper, we will use the two-character version of
ARPAbet because it is the one used by The CMU Pro-
nouncing Dictionary
3
, which is an open-source pro-
nunciation dictionary for the English language.
4 DATA PROCESSING AND
ANALYSIS
As a basis for our visualization approach, we have de-
signed an automated processing method for rap songs
to detect rhymes, to group them, and to synchronize
the lyrics with the audio playback. The method re-
quires the audio file and lyrics as input, and returns
rhyme groups and timestamps for the lyrics at sylla-
ble level.
4.1 Pronunciation
Although the audio information is the most authorita-
tive source for rhyme in a song—including the artist’s
pronunciation—, the automatic extraction of rhymes
from audio is complex and might be highly unreli-
able. As a more manageable heuristic, hence, we
use the lyrics as a proxy. The objective is to effec-
tively categorize words from a given text into distinct
rhyme groups. To incorporate perfect, identical, and
assonant rhymes in the detection, the approach must
consider the phonetics of words. Our primary source
for syllables is the dictionary How Many Syllables.
4
However, since a dictionary entry is not available for
every word, in those cases, we turn to an algorith-
mic method to segment words into syllables: The
Sonority Sequencing Principle (SSP) as implemented
3
http://www.speech.cs.cmu.edu/cgi-bin/cmudict
4
https://www.howmanysyllables.com/
IVAPP 2025 - 16th International Conference on Information Visualization Theory and Applications
732

in nltk.
5
Through ARPAbet, we phonetically tran-
scribe the syllables. We choose ARPAbet over IPA
because of the ease of querying CMUDict through
the Python pronouncing library.
6
To address words
beyond the dictionary, we use a recursive partition-
ing method. We split words into individual partitions
until each partition is present in the CMU dictionary.
Afterward, we reassemble those partitions to approx-
imate pronunciation.
4.2 Rhyme Score
Next, we construct a rhyme score σ to quantify the
level of rhyming between two syllables. The score
ranges from 0 to 1, with 0 indicating no rhyme, and
1 being a strong indicator for rhyme. It is stored in a
similarity matrix S holding all the scores for all syl-
lable pairs. The score is determined by considering
three key features.
Vowel Similarity (σ
v
). For two syllables to rhyme,
they must share a similar vowel sound. The CMU
Pronouncing Dictionary assigns one of 15 distinct
vowel sounds to each syllable. Syllables with the
same vowel sound, denoted by the same ARPA-
bet character, have the potential to rhyme. Syl-
lables with vowel sounds that are similar but not
identical are also considered potential rhymes, as
they can be easily turned into rhymes depend-
ing on pronunciation. Rappers often intentionally
go with pronunciations that result in rhyming for
these words (Edwards, 2009). To compute vowel
similarity, we use a confusion matrix based on re-
search by Phatak and Allen (2007). This matrix
represents how likely one vowel sound is to be
confused with another in speech perception exper-
iments, which we interpret as similarity.
Stress (σ
s
). The ARPAbet notation also indicates the
level of stress on a vowel. This refers to the de-
gree of emphasis placed on the individual vowel
sound. For instance, for the word “water”, the
ARPAbet encoding is “W AO1 T ER0”. Here,
the “AO” sound is stressed, while the “ER” sound
is unstressed. Drawing a parallel to the WSJ ex-
ample and the Hamilton algorithm, we assert that
rhyme is most prominent between two stressed
syllables. Two stressed syllables earn the high-
est score. Pairs with one stressed syllable receive
a lower score, and two unstressed syllables get the
lowest score.
5
https://www.nltk.org/ modules/nltk/tokenize/
sonority sequencing.html
6
https://github.com/aparrish/pronouncingpy
Consonant Suffix (σ
c
). Aside from vowels, the sub-
sequent sounds also play a crucial role in rhyming.
We will refer to the phonemes of the consonants
that follow the vowel of a syllable as suffix. If
two pairs of syllables share the same or a similar
suffix, it will increase their rhyme score. Similar
to vowels, we not only consider identical suffixes
but also the similarity of their consonant sounds.
To quantify the similarity between different con-
sonant sounds, we use confusion matrices based
on studies by Woods et al. (2010). To account for
cases where suffixes may have different lengths,
we employ a weighted average. Each consonant
in the suffix is compared to its counterpart in the
other syllable, with consonants closer to the end
of the word given more weight.
Our complete rhyme score between two syllables
a and b is expressed as a weighted arithmetic mean of
these factors, modulated by the vowel similarity σ
v
:
σ(a, b) = σ
v
(a, b) ·
∑
i∈{v,s,c}
w
i
σ
i
(a, b)
∑
i∈{v,s,c}
w
i
(1)
The score is structured with σ
v
acting as a filter, as we
only want to detect syllables with similar vowels as
potential rhymes. The coefficients w
v
, w
s
and w
c
are
the respective weights for each factor. Typically, w
v
should carry the highest weight to, again, acknowl-
edge the importance of vowels for the rhyme.
4.3 Rhyme Groups
Rhyme groups form the foundation of our visual-
ization and are assigned to each syllable based on
the similarity matrix. We propose clustering using
DBSCAN or HDBSCAN. These algorithms are cho-
sen for their ability to classify unclear data points as
noise, as we need to identify both rhyming and non-
rhyming syllables. For the rhyme assignment, we
convert the similarity matrix into a distance matrix
D = 1 − S. The default parameters are chosen dynam-
ically, providing lay users a rhyme assignment out of
the box. For this, we evaluate various parameter com-
binations and choose the one with the highest Silhou-
ette Score, which measures how well each data point
fits within its cluster compared to others. Experts can
enhance these settings (see Section 5.4).
4.4 Lyrics Synchronization
To synchronize audio playback and the animated vi-
sualization of rhymes, we need to retrieve the spe-
cific timestamps of every syllable. We use OpenAI’s
RapViz: Rhyme Detection and Visualization of Rap Music
733
Whisper API through a Python module
7
, providing
the audio file as input. The module outputs a JSON
file that includes the transcription with timestamps at
word level. However, we need even finer granularity,
at the level of individual syllables. Furthermore, the
timestamps are linked to the transcribed text gener-
ated by Whisper, which might contain mistakes, but it
is necessary to align them with the original lyrics.
We first match equal segments in both text ver-
sions by moving two frames. If the two current frames
contain the same sequence of words, a match is noted
and both frames are moved forward by one word. If
they do not match, only the frame in the transcribed
text is moved until the words within the two frames
match or a maximum look-ahead length is reached. In
the first case, a match is recorded, and the frames are
moved to the respective next words; in the latter case,
only the frame in the lyrics is moved by one posi-
tion. This procedure repeats until the end of the text is
reached and outputs a sequence of links between per-
fectly matching words. They are employed to trans-
fer the timestamps of each matched word from the
transcript to the lyrics. However, not all words might
match and hence cannot yet be linked with the origi-
nal lyrics. With matched neighbors as references, in
such ranges, timestamps are interpolated linearly for
each word in the lyrics. Similarly, to finally assign
timestamps to the syllables, we interpolate linearly
between the timestamps of this and the next word.
5 VISUALIZATION
Our contribution further is the design and implemen-
tation of an interactive visualization approach (Fig-
ure 1). It promotes active engagement with the mu-
sic and provides a clear temporal guide. To navigate
the song, we incorporated a music player with basic
functionality such as play, pause, and direct naviga-
tion through the song using a slider. Visualizations
are linked to the current playback time (Figure 5) and
between each other (Figure 6).
5.1 Text Highlighting
We use color-highlighted text to provide the user with
a way to follow along with the lyrics. To avoid over-
whelming the user with too much text, only a suffi-
cient portion of the text is displayed. As the audio
file plays, the text scrolls automatically, similar to a
teleprompter used by news anchors. RapViz high-
lights syllables that share the same rhyme group with
7
https://github.com/linto-ai/whisper-timestamped
(a)
(b)
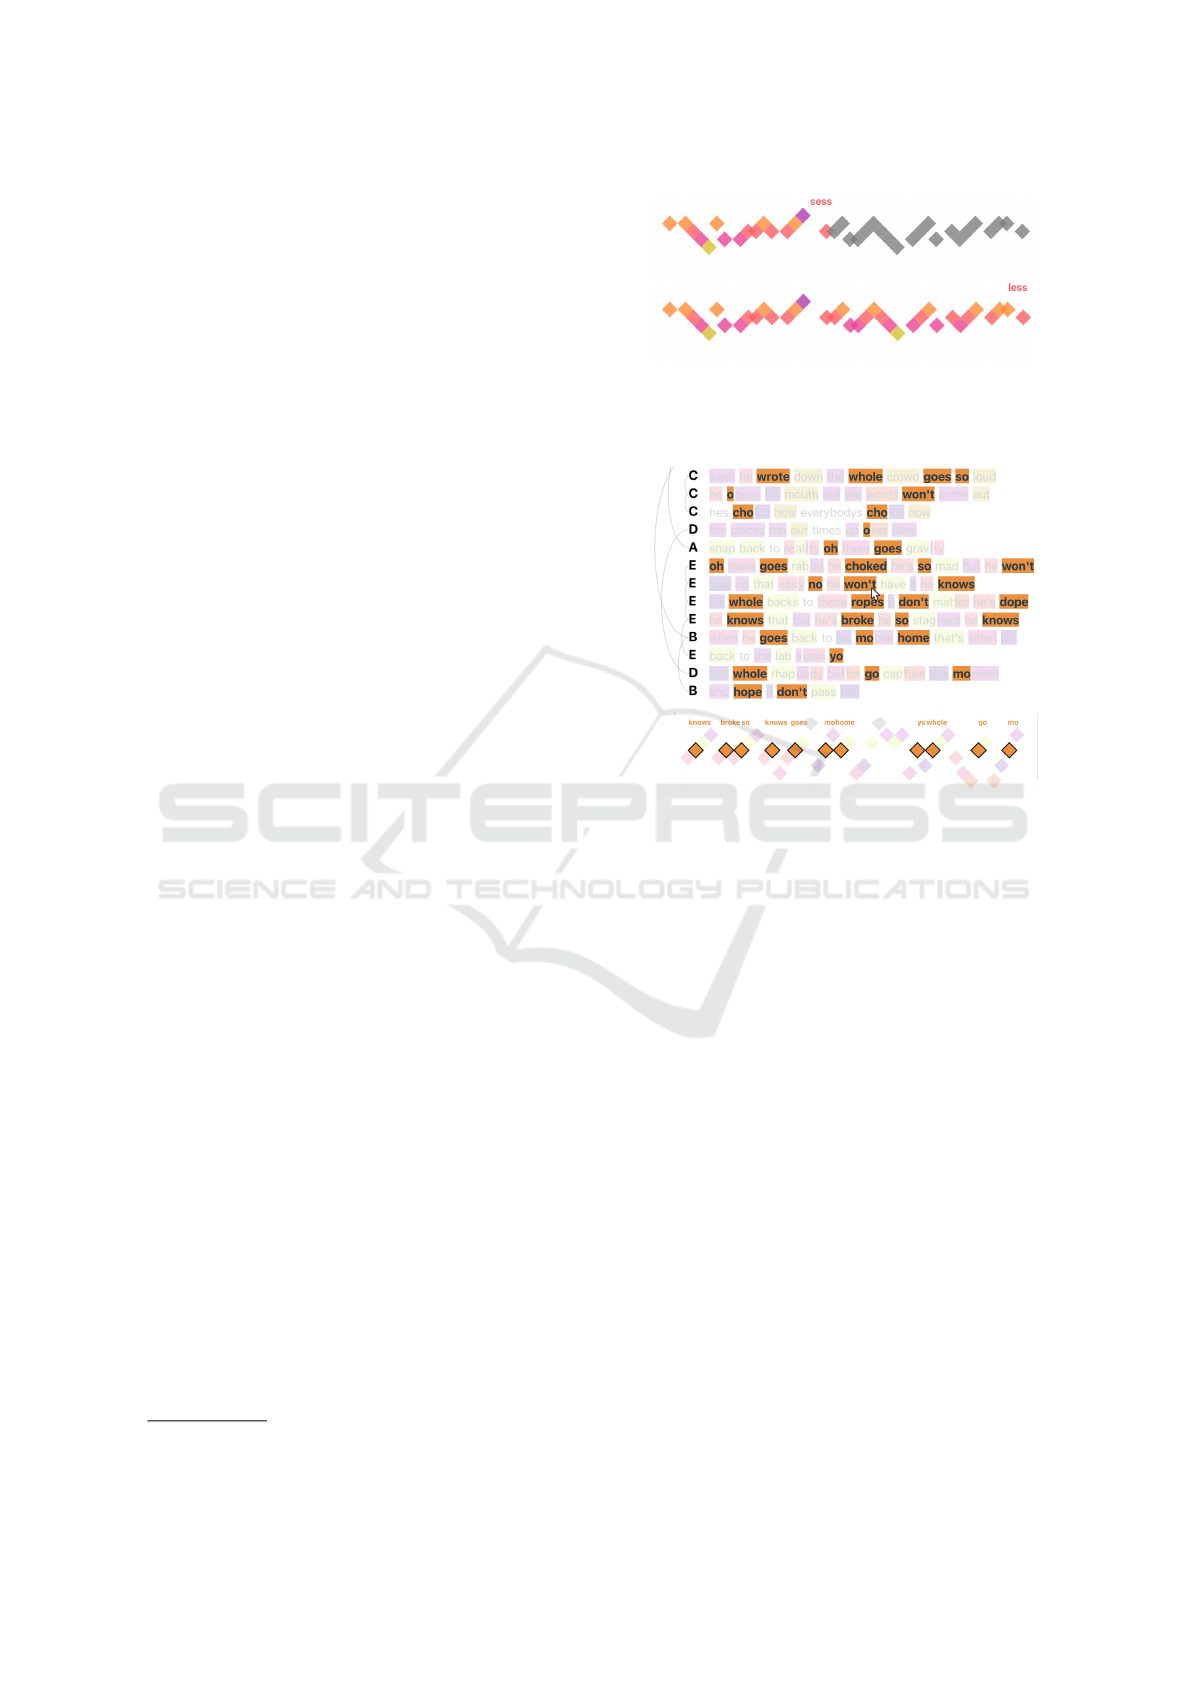
Figure 5: Dynamically revealing the rhyme groups in the
timeline view (a: half revealed; b: fully revealed). Example
from Ready or Not by The Fugees.
(a)
(b)
Figure 6: Hovering over a syllable highlights all syllables
within the same rhyme group in the (a) text highlighting
(partly clipped) and (b) timeline visualization. Example
from Lose Yourself by Eminem.
the same color. This highlighting appears as the syl-
lables are pronounced in the playback and, over time,
all rhyming syllables will be highlighted. When the
song concludes, the entire text is presented. Conse-
quently, the text zooms out, allowing for an analysis
of the entire content. With the full text shown, arc di-
agrams are added to the left of the lines of text, visu-
alizing end rhymes and their corresponding schemes
(Figure 1, left). Bars without participation in an end
rhyme scheme are marked with the letter X.
5.2 Timeline
The intention of the timeline is to expose the struc-
tures of internal rhyme schemes as discussed in Sec-
tion 3 and to better link rhymes with time (beat). For
this, we represent syllables as squares, inspired by
The Wall Streets Journals’s approach (Eastwood and
Hinton, 2016a). These squares are color-coded, with
the same colors as in the text highlighting visualiza-
tion. Redundantly encoded in addition to color, the
vertical position of each square indicates the rhyme
group to which the syllable belongs. This partly mim-
IVAPP 2025 - 16th International Conference on Information Visualization Theory and Applications
734

Figure 7: Schematic timeline visualization of the same
internal rhyme scheme, comparing the pattern seuquence
DACBDACB (top) and ABCDABCD (bottom).
ics sheet music notation, where the vertical position
indicates pitch. Initially gray, the squares adjust to
match the relevant rhyme group once the syllable is
heard. To aid in identifying the currently visualized
syllable, we provide a text label containing the sylla-
ble’s text.
To improve pattern recognition in the visualiza-
tion, we limit the number of syllables displayed at
once. Showing an entire verse in one view would in-
troduce many rhyme groups simultaneously, resulting
in large vertical variation, which would make it harder
to spot patterns. For a balance of complexity and ex-
pressiveness, RapViz consistently displays four bars
in a row, in accordance with the typical structure of a
rap verse that comprises 16 bars, split into four blocks
of four (Edwards, 2009).
We visually represent patterns minimizing verti-
cal distance (Y-axis) between consecutive syllables.
For instance, the pattern DACBDACB is more recog-
nizable when it is relabeled and arranged as ABCD-
ABCD, as displayed in Figure 7. For optimizing that
neighboring syllables are positioned vertically close
to each other, we rely on simulated annealing and
thereby approximate an optimal ordering of rhyme
groups. Our cost function measures the quality of
a solution by calculating the difference between the
positions of adjacent syllables’ rhyme groups. For a
sequence of n syllables s = [s
1
, s
2
, . . . , s
n
] and a map-
ping function p that assigns each rhyme group to a
position, the cost function is defined as:
C(s, p) =
n−1
∑
i=1
|
p(s
i
) − p(s
i+1
) − 1
|
. (2)
It penalizes deviations from a perfect sequential ar-
rangement. The simulated annealing switches posi-
tions in the mapping until the system cools, yielding
the best found order.
5.3 Color Selection
A key visual feature of RapViz is its use of colors
to represent rhyme groups. However, a challenge
arises due to the potentially large number of rhyme
groups in a song. For instance, the largest categorical
color palette in d3.js offers only 10 unique colors,
8
while songs in RapViz can easily exceed this num-
ber of groups. We provide a color gradient as input
for the color selection. Just mapping to this scale,
however, results in some groups having similar colors,
given the limited variation in the gradient. We address
this limitation by trying to place similarly sounding
rhyme groups closer to each other. To this end, we
apply multidimensional scaling to leverage the simi-
larity between rhyme groups for projecting them onto
the one-dimensional color scale, allowing a clear vi-
sual distinction between dissimilar groups.
5.4 Expert Settings
The expert settings are designed for advanced users
to fine-tune the rhyme group assignment beyond the
defaults. While the default settings aim for broadly
applicable results, experts may leverage these options
to achieve better context-specific outputs.
Experts can modify how the distance matrix D is
calculated using two main approaches. The first ap-
proach allows considering not only syllable similarity,
as shown in Equation 1, but also relative positioning
within the text. This can be applied to avoid catego-
rizing two syllables as a rhyme that are far apart in the
text. To punish distance we apply the equation
D
′
i j
= d
i j
+ w ·
|i − j|
N − 1
p
(3)
where D
′
i j
is the adjusted distance, d
i j
is the base dis-
tance, w is the position weight (adjustable by the ex-
pert), i and j are the indices of the syllables, N is
the total number of syllables, and p (adjustable by the
expert) determines the degree of non-linearity of the
position effect. The second approach allows for the
consideration of contextual information surrounding
each syllable. This method looks at sequences of up
to four syllables in both forward and backward direc-
tions from the current syllable pair. It calculates sim-
ilarities for these extended sequences and selects the
highest similarity score. Both the relative positioning
and contextual similarity options have the potential to
enhance rhyme detection accuracy. However, they re-
quire parameter tuning to achieve strong results. Con-
sequently, they are not enabled by default.
8
https://d3js.org/d3-scale-chromatic/categorical
RapViz: Rhyme Detection and Visualization of Rap Music
735
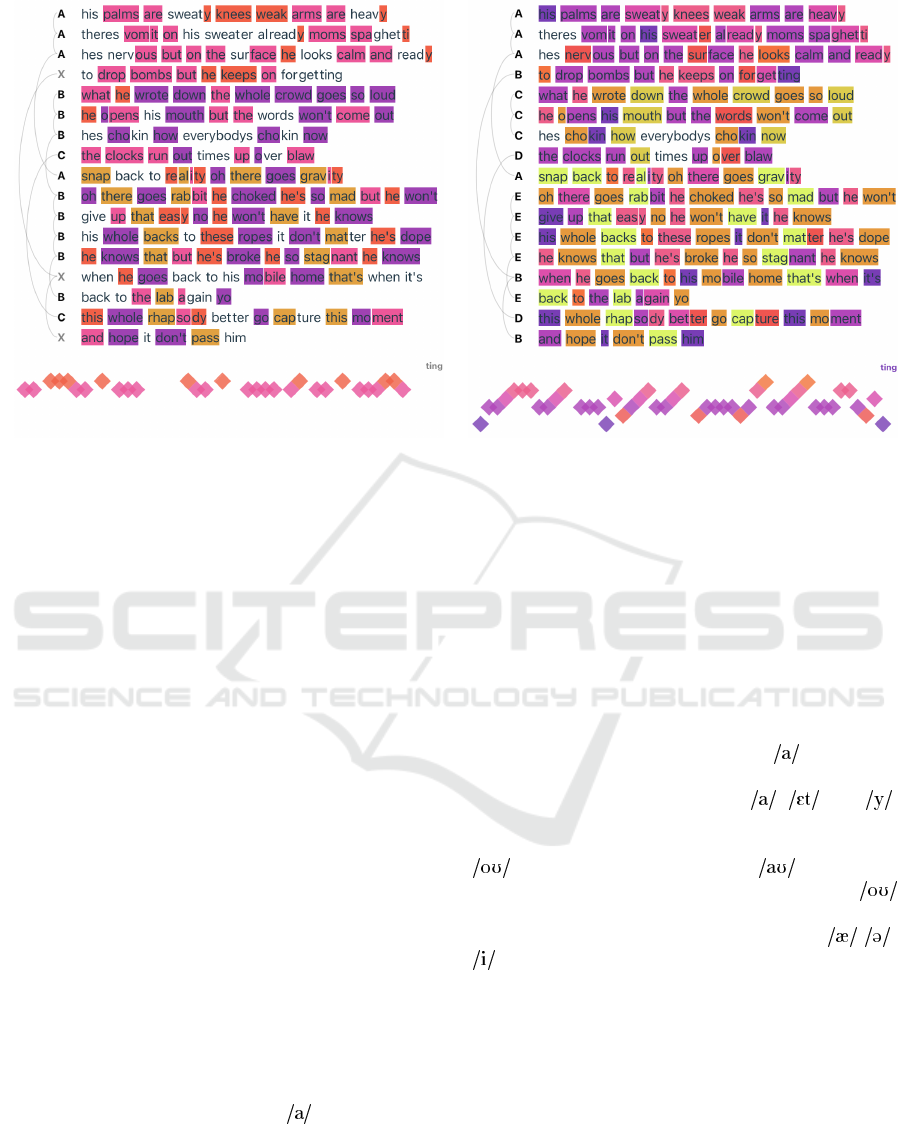
Figure 8: Text highlighting and timeline visualization of the first four (timeline) and sixteen (text highlighting) bars from Lose
Yourself by Eminem; (left) Results using default settings; (right) Results using expert-adjusted settings.
The next set of options directly controls the rhyme
assignment process. Experts can fine-tune parame-
ters for the DBSCAN and HDBSCAN clustering. For
DBSCAN, settings allow adjusting the parameter ε
and the minimum cluster size; and for HDBSCAN,
tuning the minimum cluster size as well as the mini-
mum number of samples.
6 APPLICATION EXAMPLES
To showcase the value for both laypeople and experts,
we will explore two songs, analyzing their rhyme
structures and internal patterns with RapViz.
Lose Yourself by Eminem (2002). The song was
released accompanying the movie 8 Mile. It is his
most popular song, staying on top 1 of the billboard
top 100 for the last nine weeks of 2002 and being
the first rap song to win the Academy Award for Best
Original Song. Focal points of the song are both
rhyme complexity and assonance, making it a com-
pelling case for analysis with RapViz.
RapViz effectively highlights some key rhyme
patterns in the song already using default settings
(Figure 8, left). The pattern of two (pink) sounds
next to each other are particularly prominent and eas-
ily identifiable. Additionally, the visualization out-
lines the verse structure, showing that the song’s over-
all rhyme pattern changes across bars 1-4, 5-8, and 9-
16. However, the default settings do not capture the
song’s nuanced complexity and assonance.
To achieve a more detailed view of the rhyme
structure, we optimized the expert settings (Figure 8,
right). By switching the clustering algorithm from
HDBSCAN to DBSCAN and manually adjusting the
parameters, we were able to reveal a more nuanced
representation of the internal rhymes. Focusing on
the color coding of the first four bars, two dominant
rhyme patterns occur frequently (Figure 8). The pri-
mary rhyme group centers around the sound, as in
“palm” (purple). This is followed by a multi-syllabic
rhyme that includes three sounds: , , and ,
as in “are sweaty” (purple → magenta → pink). In
bars 5-8, we observe a pattern centered around the
sound (as in “wrote”) and the sound (as in
“down”); and in bars 9-16, a pattern around the
sound (as in ”goes”), complemented with the pat-
tern of the multi-syllabic rhyme sequence of - -
sounds (as in “gravity”). Assonance is employed
numerous times throughout the song. For instance,
words like “spaghetti” and “and ready” do not form
perfect rhymes on their own. Instead, the artist alters
these words to create similar vowel sounds, thereby
creating assonance. The result allows him to maintain
frequent internal and multi-syllabic rhymes while ef-
fectively telling a story.
Feelings by Mickey Factz (2023). Following his
feature on XXL’s Freshman Issue in 2009 and a
decade-long career in the music industry, Factz es-
tablished the Pendulum Ink Academy. In collabo-
IVAPP 2025 - 16th International Conference on Information Visualization Theory and Applications
736
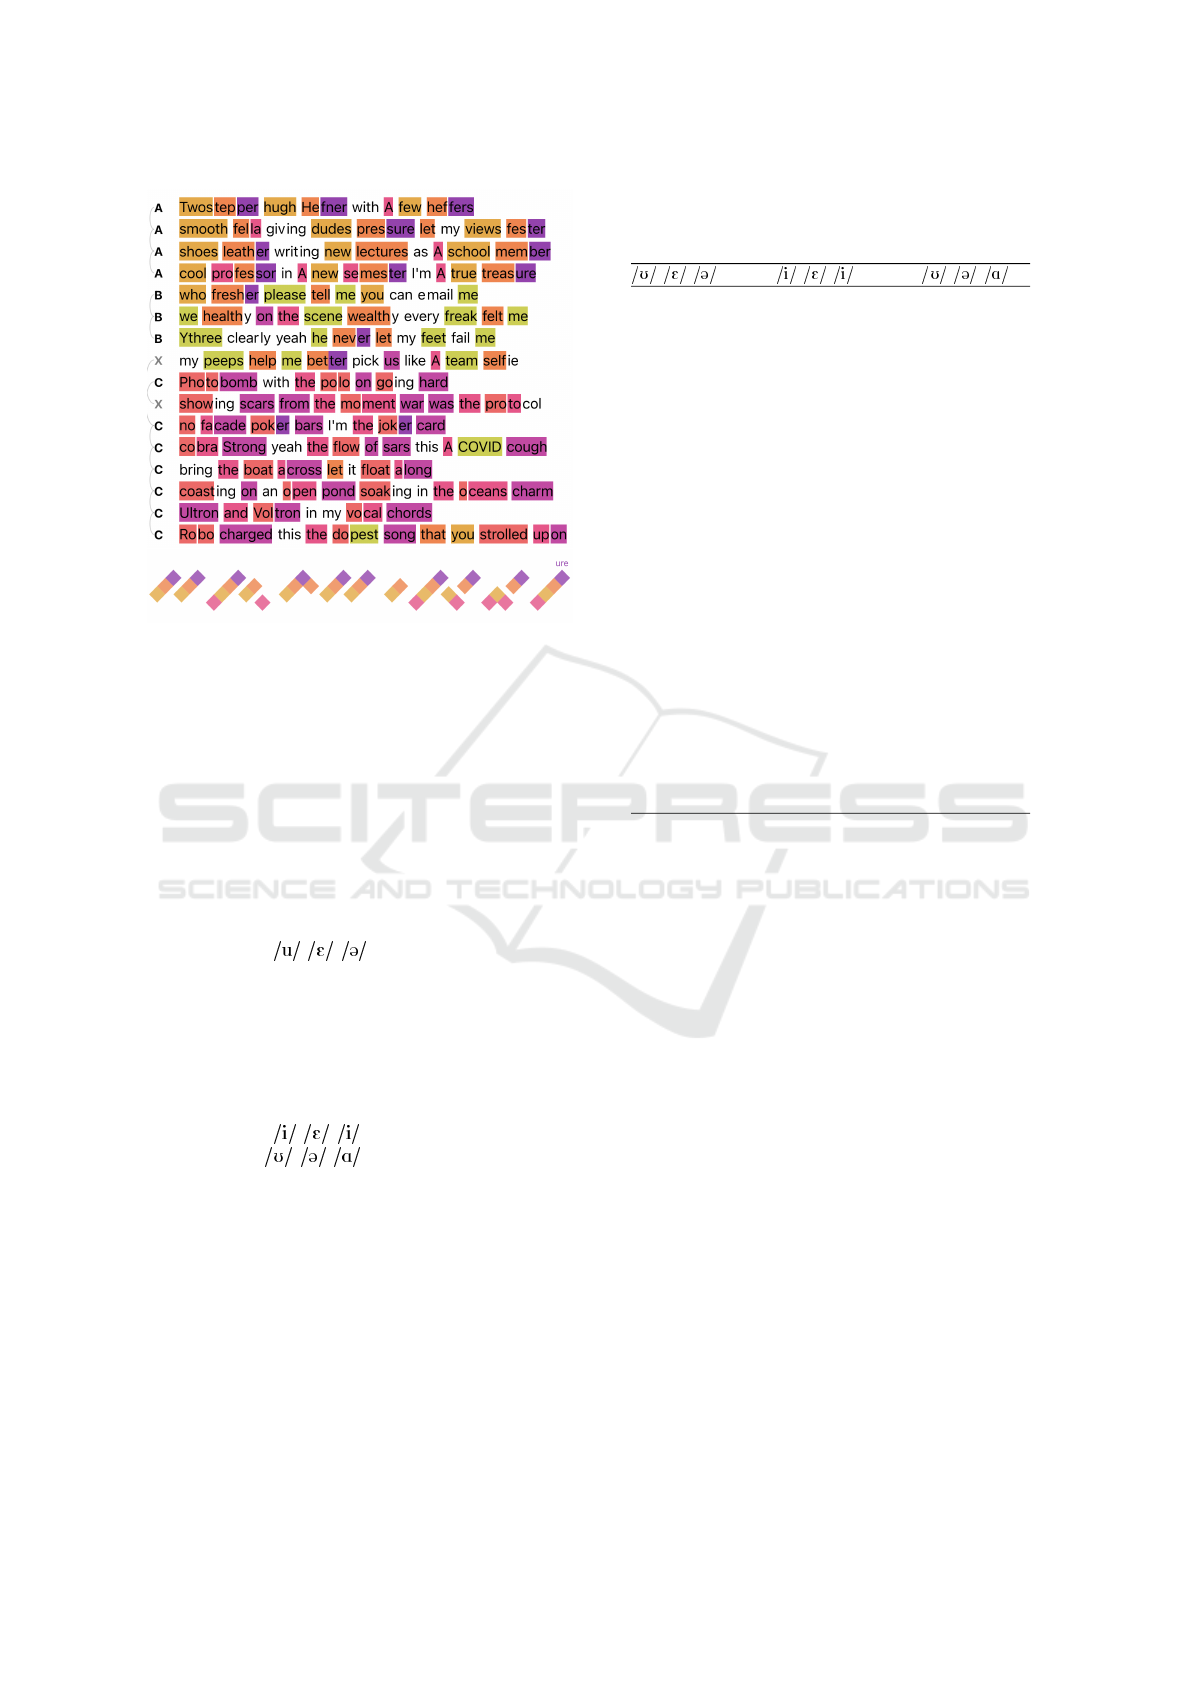
Figure 9: Text highlighting and timeline visualization of the
first four (timeline) and sixteen (text highlighting) bars from
Feelings by Mickey Factz.
ration with renowned hip-hop artists including Wu-
Tang Clan’s Method Man and Inspectah Deck as well
as Phonte, he aims to teach emerging artists on rhyme
and rap techniques. Given Factz’s knowledge of lyri-
cism and his focus on advanced rhyme schemes, his
work provides an interesting case.
Focusing on local patterns first, the internal rhyme
scheme within the first four bars is prominently visi-
ble in the timeline visualization (see Figure 9). The
artist consistently employs a multi-syllabic rhyme
composed of a - - sound sequence (see Ta-
ble 1, first column). Upon examining the broader
structure of the entire part, as depicted in Figure 9
(text highlighting), the color coding reveals a struc-
tured pattern between bars. The composition can be
visually segmented into three main sections: bars 1-4,
bars 5-8, and bars 9-16. Each of these sections uti-
lizes unique rhyme schemes. With bars 5-8 focusing
on the patter of - - and bars 9-16 focusing on
the pattern of - - (see Table 1, second and
third column). This bears similarity to patterns ob-
served in Lose Yourself, where the same structure of 4
then 4 then 8 bars of the same scheme was employed.
7 DISCUSSION
While exploring different songs in RapViz as dis-
cussed above revealed many relevant insights, there
are also some clear limitations. Although our text-
based rhyme detection analyzes the lyrical compo-
Table 1: Rhyme patterns in Feelings by Mickey Factz.
Gray-shaded syllables were not or falsely classified, obscur-
ing their visual association with the rhyme pattern.
- - - - - -
Twos-tep-per please-tell-me Pho-to-bomb
Hugh-He-fner e-mail-me po-lo-on
few-hef-fers we-health-y go-ing-on
smooth-fel-la scene-wealth-y show-ing-scars
dudes-pres-sure freak-felt-me mo-ment-war
views-fes-ter (Y)three-clear-ly pro-to-col
shoes-lea-ther feet-fail-me no-fa-cade
new-lec-tures peeps-help-me po-ker-bars
school-mem-ber team-self-ie jo-ker-card
cool-(pro)fes-sor co-bra-strong
new-(se)mes-ter flow-of-sars
true-trea-sure co-vid-cough
who-fresh-er boat-a-cross
float-a-long
coast-ing-on
o-pen-pond
soak-ing-x
o-ceans-charm
ul-tron-x
vol-tron-x
vo-cal-chords
ro-bo-charged
do-pest-song
strolled-up-on
nent of rap songs, our approach only partially includes
the interplay of sound and rhythm with the text (indi-
rectly through the timeline and audio playback, but
not directly through visualizing the beat). Since re-
lated works have already explored automated analysis
of music, we suggest that future research should focus
on developing visualizations that include the analysis
of musical features and text, ensuring a more compre-
hensive visualization of songs.
Another challenge is in the pronunciation variabil-
ity based on context, which is not addressed by our
context-agnostic, dictionary-based approach. Lack-
ing semantic and grammatical context causes issues;
for instance, the interpretation of terms such as ’MC’
(short for a rap artist referred to as master of cere-
monies or mic controller) versus ’Mc’ (as in Scot-
tish family names) or the distinction between ’lead’
as a verb and ’lead’ as a noun significantly affects
the accuracy of our rhyme detection. But even if
context is properly determined (e.g., through AI),
artists might intentionally mispronounce a word to en-
hances rhymes or speak with an accent not reflected
in the dictionary. Hence, achieving further quality
improvements regarding automatic rhyme detection
might necessitate analyzing the rhymes through the
audio channel directly. Additionally, for the task of
detecting multi-syllabic rhymes, our system currently
RapViz: Rhyme Detection and Visualization of Rap Music
737

relies on the user’s abilities to review the visualiza-
tions. In future work, an automatic detection and
highlighting of these rhymes could be investigated.
Furthermore, our approach includes various pa-
rameters and our default configuration cannot be ideal
for every song. Users might be willing to try out dif-
ferent configurations through our setting panels, but
this can be time-consuming. Moreover, as shown in
Table 1, the system may incorrectly classify words
even when users have the expertise to understand and
configure the different options. Since there is not one
default best setting suitable for every song, future re-
search could try to optimize the default parameters by
determining them dynamically based on the charac-
teristics of the given song (e.g., through learning from
manually optimized examples).
While the detection quality and application exam-
ples presented in this paper demonstrate potential, a
user evaluation is still necessary to assess the usabil-
ity and usefulness of the visualization. However, a
traditional task-based study might be too limited, as
it would be difficult to specify meaningful, represen-
tative low-level tasks—how users would want to use
and interact with an explorative music visualization is
too open and likely individual. In contrast, a more
qualitative study methodology focusing on insights
and personally perceived value could provide more
relevant results.
8 CONCLUSIONS
With the goal to provide an automated visualization
approach to reflect on rhymes in rap music, we pre-
sented RapViz. It builds on a processing pipeline that
takes the song and its lyrics as input and provides dis-
tinct rhyme groups and text–audio synchronization as
output. To display the data, the approach connects
two main visualizations, one focusing on the lyrics,
the other one presenting a temporal perspective. In-
teractive playback with congruent animation provides
a basis for understanding rhyme patterns while listen-
ing. Further interactions and visual encodings also
support a retrospective analysis. The studied songs
give examples of findings and insights that lay listen-
ers can realistically discover using the approach, show
added potentials when optimizing the expert settings,
and reveal current limitations. While the approach
overall already provides results of good quality, we
see that future improvements can be made through an
AI-based audio analysis and parameter optimization,
as well as conducting in-depth user research.
REFERENCES
Abdul-Rahman, A., Lein, J., Coles, K., Maguire, E., Meyer,
M., Wynne, M., Johnson, C. R., Trefethen, A., and
Chen, M. (2013). Rule-based visual mappings – with a
case study on poetry visualization. Computer Graph-
ics Forum, 32(3pt4):381–390.
Benito-Santos, A., Mu
˜
noz, S., Ther
´
on S
´
anchez, R., and
Garc
´
ıa Pe
˜
nalvo, F. J. (2023). Characterizing the vi-
sualization design space of distant and close reading
of poetic rhythm. Frontiers in Big Data, 6:1167708.
Bergstrom, T., Karahalios, K., and Hart, J. (2007). Iso-
chords: visualizing structure in music. In Proceedings
of Graphics Interface 2007, pages 297–304. ACM.
Ciuha, P., Klemenc, B., and Solina, F. (2010). Visualization
of concurrent tones in music with colours. In Pro-
ceedings of the 18th ACM International Conference
on Multimedia, pages 1677–1680. ACM.
Clement, T., Tcheng, D., Auvil, L., Capitanu, B., and Mon-
roe, M. (2013). Sounding for meaning: Using theories
of knowledge representation to analyze aural patterns
in texts. Digital Humanities Quarterly, 7(1).
Dannenberg, R. and Raphael, C. (2006). Music score align-
ment and computer accompaniment. Communications
of the ACM, 49(8):38–43.
Delmonte, R. (2015). Visualizing poetry with SPARSAR
– visual maps from poetic content. In Proceedings
of the Fourth Workshop on Computational Linguistics
for Literature, pages 68–78. ACL.
Eastwood, J. and Hinton, E. (2016a). How does ‘Hamilton,’
the non stop, hip-hop Broadway sensation tap rap’s
master rhymes to blur musical lines? http://graphics.
wsj.com/hamilton/. Accessed: 2024-09-22.
Eastwood, J. and Hinton, E. (2016b). How WSJ used an
algorithm to analyze ‘Hamilton’ the musical. http://
graphics.wsj.com/hamilton-methodology. Accessed:
2024-09-22.
Edwards, P. (2009). How to rap. Chicago Review Press.
Encyclopaedia Britannica (2024). Assonance. https://www.
britannica.com/art/assonance. Accessed: 2024-09-22.
Goss, C. and Carson, J. (2016). A visual represen-
tation of Wagner’s music. https://wp.stolaf.edu/
dh/a-visual-representation-of-wagners-music/. Ac-
cessed: 2024-09-24.
Khulusi, R., Kusnick, J., Meinecke, C., Gillmann, C.,
Focht, J., and J
¨
anicke, S. (2020). A Survey on Visual-
izations for Musical Data. Computer Graphics Forum,
39(6):82–110.
Lein, J. G., Mccurdy, N., and Hurtado, A. (2018). Deep
in poetry: Visualizing texts’ sonic depths in 3D.
Leonardo, 51(1):80–82.
McCurdy, N., Lein, J., Coles, K., and Meyer, M. (2016).
Poemage: Visualizing the sonic topology of a poem.
IEEE Transactions on Visualization and Computer
Graphics, 22(1):439–448.
Meinecke, C., Hakimi, A. D., and J
¨
anicke, S. (2022a). Ex-
plorative visual analysis of rap music. Information,
13(1):10.
IVAPP 2025 - 16th International Conference on Information Visualization Theory and Applications
738

Meinecke, C., Schebera, J., Eschrich, J., and Wiegreffe,
D. (2022b). Visualizing similarities between Amer-
ican rap-artists based on text reuse. In LEVIA 2022:
Leipzig Symposium on Visualization in Applications.
Merriam-Webster (2024a). End rhyme. https://www.
merriam-webster.com/dictionary/end%20rhyme. Ac-
cessed: 2024-09-22.
Merriam-Webster (2024b). Internal rhyme. https://www.
merriam-webster.com/dictionary/internal%20rhyme.
Accessed: 2024-09-22.
Mittmann, A., von Wangenheim, A., and dos Santos, A. L.
(2016). A multi-level visualization scheme for po-
etry. In 2016 20th International Conference Informa-
tion Visualisation (IV), pages 312–317. IEEE.
Noh, Z., Abidin, S. Z. Z., and Omar, N. (2019). Poetry
visualization in digital technology. In Handzic, M.
and Carlucci, D., editors, Knowledge Management,
Arts, and Humanities: Interdisciplinary Approaches
and the Benefits of Collaboration, pages 171–195.
Springer International Publishing.
Phatak, S. A. and Allen, J. B. (2007). Consonant and vowel
confusions in speech-weighted noise. The Journal of
the Acoustical Society of America, 121(4):2312–2326.
Poetry Archive (2024). Line. https://poetryarchive.org/
glossary/line/. Accessed: 2024-09-22.
Statista (2024). Distribution of streamed music
consumption in the United States in 2021, by
genre. https://www.statista.com/statistics/475667/
streamed-music-consumption-genre-usa/. Accessed:
2024-09-22.
The American Heritage Dictionary (2024). Phoneme.
https://www.ahdictionary.com/word/search.html?q=
phoneme. Accessed: 2024-09-22.
Wattenberg, M. (2002). Arc diagrams: Visualizing struc-
ture in strings. Proceedings of IEEE Symposium on
Information Visualization, pages 110 – 116.
Wikipedia (2024). Rhyme. https://en.wikipedia.org/wiki/
Rhyme. Accessed: 2024-09-22.
Woods, D., Yund, E. W., Herron, T. J., Cruadhlaoich, M. A.,
et al. (2010). Consonant identification in consonant-
vowel-consonant syllables in speech-spectrum noise.
The Journal of the Acoustical Society of America,
127(3):1609–1623.
RapViz: Rhyme Detection and Visualization of Rap Music
739
