
Towards Robust Multimodal Land Use Classification: A Convolutional
Embedded Transformer
Muhammad Zia Ur Rehman
1 a
, Syed Mohammed Shamsul Islam
1 b
, Anwaar UlHaq
2 c
,
David Blake
1 d
and Naeem Janjua
3 e
1
School of Science, Edith Cowan University, Australia
2
School of Engineering and Technology Centre for Intelligent Systems, Central Queensland University, Australia
3
College of Science and Engineering, Flinders University, Australia
{m.ziaurrehman, syed.islam, d.blake}@ecu.edu.au, a.anwaarulhaq@cqu.edu.au, naeem.janjua@flinders.edu.au
Keywords:
Land Use Classification, Multimodal, Transformer, Cross-Modal Learning.
Abstract:
Multisource remote sensing data has gained significant attention in land use classification. However, effec-
tively extracting both local and global features from various modalities and fusing them to leverage their
complementary information remains a substantial challenge. In this paper, we address this by exploring the
use of transformers for simultaneous local and global feature extraction while enabling cross-modality learn-
ing to improve the integration of complementary information from HSI and LiDAR data modalities. We
propose a spatial feature enhancer module (SFEM) that efficiently captures features across spectral bands
while preserving spatial integrity for downstream learning tasks. Building on this, we introduce a cross-modal
convolutional transformer, which extracts both local and global features using a multi-scale convolutional em-
bedded encoder (MSCE). The convolutional layers embedded in the encoder facilitate the blending of local
and global features. Additionally, cross-modal learning is incorporated to effectively capture complementary
information from HSI and LiDAR modalities. Evaluation on the Trento dataset highlights the effectiveness of
the proposed approach, achieving an average accuracy of 99.04% and surpassing comparable methods.
1 INTRODUCTION
The use of remote sensing in land use classification
is necessary for effective environmental management,
urban planning, or precision agriculture. It is one of
the critical tasks that leads to the execution of man-
agement plans through remote sensing technology.
Over the last decade, hyperspectral imaging (HSI)
has been widely used for land use classification that
has the ability to capture spectral information (Hong
et al., 2021) (Ghamisi et al., 2017). This allows HSI
to distinguish between different objects on the ground
using their unique spectral signatures. However, HSI
faces challenges in distinguishing objects that share
similar spectral signatures but different spatial struc-
tures, reducing its effectiveness in diverse landscapes.
The recent technological advancements in remote
a
https://orcid.org/0000-0001-9531-1941
b
https://orcid.org/0000-0002-3200-2903
c
https://orcid.org/0000-0002-5145-7276
d
https://orcid.org/0000-0003-3747-2960
e
https://orcid.org/0000-0003-0483-8196
sensing systems have significantly enhanced the pos-
sibilities of gathering multimodal remote sensing data
(G
´
omez-Chova et al., 2015). The utilization of mul-
timodal data has already proved its significance for
classification tasks in different fields (Tang et al.,
2022) (Ding et al., 2021) (Hermessi et al., 2021).
These advancements have shifted research towards
the multimodal domain in this field as well, where in-
tegration of HSI with other imaging modalities such
as LiDAR provides complementary information in
terms of height (Ding et al., 2022), thereby improv-
ing classification abilities of objects on the ground fa-
cilitating precise and effective management and plan-
ning. However, effective fusion of modalities is a cur-
rent challenge along with feature extraction.
Traditional classification techniques, employed in
the early stages of research within this domain (Liao
et al., 2014), provide a baseline for further research
advancements. However, the complexity of HSI data
and the limitations associated with shallow feature ex-
traction reduces their effectiveness. Recently, con-
volutional neural networks (CNNs) have been widely
recognized in land use classification due to their dis-
Rehman, M. Z. U., Islam, S. M. S., UlHaq, A., Blake, D. and Janjua, N.
Towards Robust Multimodal Land Use Classification: A Convolutional Embedded Transformer.
DOI: 10.5220/0013191300003912
Paper published under CC license (CC BY-NC-ND 4.0)
In Proceedings of the 20th International Joint Conference on Computer Vision, Imaging and Computer Graphics Theory and Applications (VISIGRAPP 2025) - Volume 3: VISAPP, pages
143-153
ISBN: 978-989-758-728-3; ISSN: 2184-4321
Proceedings Copyright © 2025 by SCITEPRESS – Science and Technology Publications, Lda.
143

criminative feature extraction capabilities (Xue et al.,
2021) (Du et al., 2021) (Zhang et al., 2021). Further-
more, encoder-decoder based architectures such as
EndNet (Hong et al., 2020) and CCR-Net (Wu et al.,
2021) have been employed to enhance feature extrac-
tion and the fusion of modalities, with their strength
lying in their compact architecture that facilitates ef-
ficient data processing and integration. Although
these techniques are good at extracting local features,
they lack global context and semantics among pixels
(Hong et al., 2021). To fill this gap, various studies
have integrated additional attention-based modules
with CNNs, which have demonstrated better perfor-
mance over conventional CNN-based models (Feng
et al., 2021) (Mohla et al., 2020). Despite these ad-
vancements in CNN-based framework challenges per-
sists in finding global and long-range feature depen-
dencies (Hong et al., 2022).
Vision Transformer (ViT), a variant of the trans-
former developed for natural language processing
(NLP) tasks, has emerged as a potential solution
to address limitations in extracting global infor-
mation through its unique self-attention mechanism
(Vaswani, 2017). Similar to conventional trans-
formers, ViT generates patches and through its self-
attention mechanism, it attends each patch to facil-
itate finding global correlations among them. Sev-
eral transformer-based techniques are proposed to im-
prove its feature extracting capabilities. However,
transformers struggle to capture local information and
features. To address this limitation, CNNs are being
integrated with transformers to complement and en-
hance their ability to process local details (Yu et al.,
2022) (Zhang et al., 2022), which shows improve-
ments. However, current studies lack interaction be-
tween local and global features that could provide bet-
ter semantic information, thus potentially improving
the performance.
To address this shortcoming, a transformer model
is proposed with a convolutional block embedded in
the encoder of the transformer. The embedded convo-
lutional block contributes towards capturing local fea-
tures, whereas the conventional transformer’s multi-
head self-attention (MHSA) captures global features.
Therefore, the proposed model has the capability to
capture both local and global features. Moreover, it
facilitates the interaction of local and global features
within the transformer, thus providing enriched se-
mantic information, which as a result improves clas-
sification accuracy. The main contributions of this
study are as follows:
1. A spatial feature enhancer module (SFEM) is pro-
posed to preserve spatial information for subse-
quent processing while enriching the spectral fea-
ture set.
2. A transformer model is proposed for HSI and Li-
DAR land use classification with a transformer
encoder that consists of a multiscale convolution
block, enabling the simultaneous extraction of lo-
cal and global features.
3. A cross-modal attention module is employed for
the feature interaction between HSI and LiDAR
modalities that help learn complementary infor-
mation.
Several land use classification techniques are dis-
cussed in Section 2. Section 3 discusses the detailed
methodology of the proposed technique. Experimen-
tal results are presented in Section 4 while Section 5
concludes the study.
2 RELATED WORK
Effective land use classification remains a challenge
due to the heterogeneous nature of land. Researchers
have proposed several techniques to address the chal-
lenges associated with land use classification. Over
time, many traditional and deep learning-based tech-
niques for land use classification have been proposed.
Traditional techniques utilized filter and profile-based
approaches. In filter-based techniques, morphological
and Gabor filters are commonly used for feature ex-
traction (Jia et al., 2021) (Rasti and Ghamisi, 2020).
On the other hand, profile-based techniques are com-
binations of various filters that are used together to ex-
tract features. Morphological attribute profiles (Liao
et al., 2014) and extinction attribute profiles (Rasti
et al., 2017b) were commonly used. After extract-
ing features using the aforementioned techniques, fea-
tures are either stacked together and classified us-
ing different classifiers such as support vector ma-
chines (SVM) and random forest (RF) or classifiers
are applied independently, with the final decision be-
ing made through a voting-based decision strategy.
Recently, deep learning-based techniques have
overtaken traditional methods due to their superior
feature extraction capabilities and are extensively
used for land use classification. Generally, dual-
stream frameworks are proposed (Feng et al., 2019),
which include encoder-decoder-based architectures as
well. EndNet (Hong et al., 2020) and CCR-Net (Wu
et al., 2021) both follow the encoder-decoder archi-
tecture; for the mutual exchange of information be-
tween modalities, reconstruction-based fusion strate-
gies are adopted. Some proposed techniques are
composed of triple streams (Feng et al., 2019) (Li
et al., 2022), primarily to process modalities differ-
VISAPP 2025 - 20th International Conference on Computer Vision Theory and Applications
144

ently to extract spatial-spectral features from them.
Some advanced techniques utilize attention mecha-
nisms along with CNNs to extract robust features.
(Mohla et al., 2020) proposed FusAtNeT, one of the
initial attention-based techniques employed for land
use classification. Specialized spatial and spectral
attention modules have been used along with CNN-
based feature extractors; the incorporation of atten-
tion modules showed improved classification perfor-
mance. Similarly, (Wang et al., 2022) proposed
modality-specific attention modules to highlight im-
portant features. To integrate features of different
modalities, a modality attention (MA) module is pro-
posed that provides better feature interaction between
modalities compared to traditional early and late fu-
sion strategies. (Fan et al., 2022) proposed composite
attention followed by self-calibrated convolution that
can extract multiscale features. To preserve the com-
plementary information of modalities, an attention-
based feature fusion (FF) module is employed that
adaptively fuses heterogeneous features. These tech-
niques have significantly improved classification per-
formance; yet, they do not adequately handle the vo-
luminous spectral information in HSI data due to the
intrinsic limitations of CNNs. This limitation results
in pixels with minor spectral differences not being ef-
fectively distinguishable. Transformers, with their ca-
pability to process sequential data, could effectively
distinguish between these pixels in spectral data.
(Ni et al., 2024) proposed a multiscale head selec-
tion transformer network with a hierarchical convo-
lutional feature extraction module. Features are ex-
tracted independently from both modalities and com-
bined together before further processing through mul-
tiscale 2D convolutional layers and a conventional
transformer. Finally, a classification decision is per-
formed using a CNN and transformer-based class to-
ken. (Zhang et al., 2023) proposed a transformer and
multiscale fusion network for joint HSI and LiDAR
classification. Initially, it extracts multiscale features
from both modalities using multiscale attention. Sub-
sequently, the extracted features are fused together us-
ing transformer-based attention calculation. Later on,
the multiscale and fused features are classified using
a specially designed multi-output module. (Roy et al.,
2023) introduced a multimodal fusion transformer for
classifying HSI and LiDAR data. In their approach,
LiDAR data is utilized as a learnable token, combined
with HSI tokens for feature learning. However, this
method does not completely integrate the valuable in-
formation from both modalities, which consequently
restricts the potential accuracy of the classification.
In addition to these, several transformer-based tech-
niques have been proposed for land use classification
(Roy et al., 2024) (Yang et al., 2024). Despite these
advancements, challenges still persist in the effective
interaction between local and global features during
the feature learning process and their fusion, which
is crucial for capturing the distinctive characteristics
arising from subtle differences in land cover types.
3 METHODOLOGY
In this study, a new transformer-based model is pro-
posed for multimodal land use classification that is
capable of extracting local and global features simul-
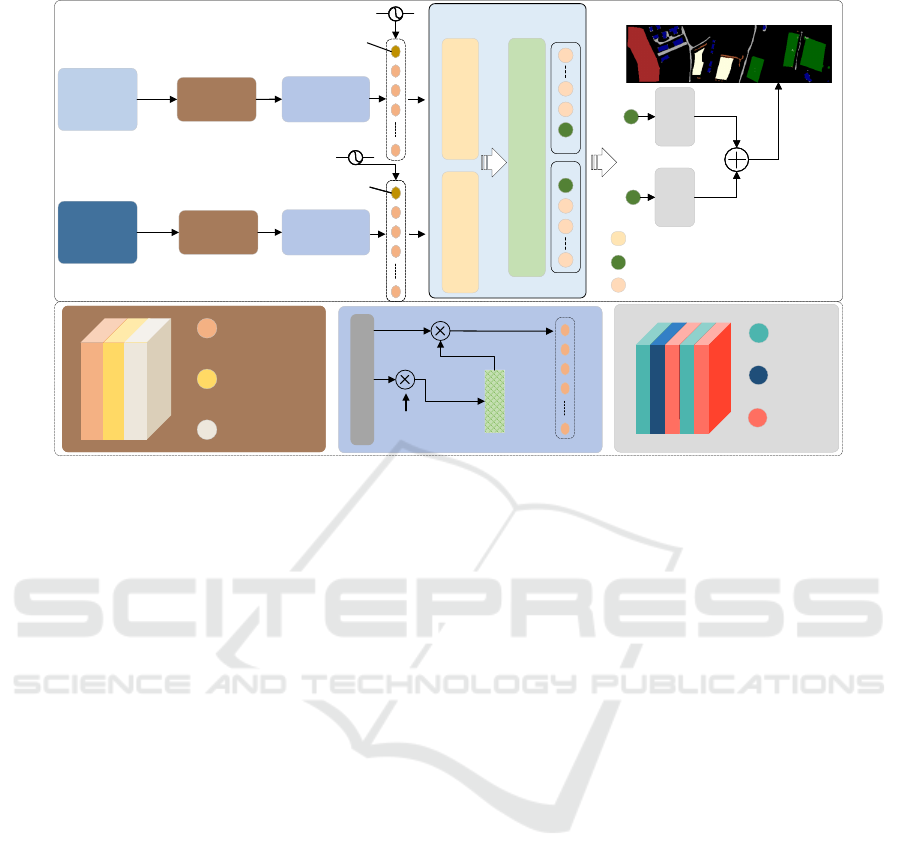
taneously. The framework of the proposed technique
is presented in Figure 1 and described in the following
subsections. Subsection 3.1 explains the preprocess-
ing steps, while Subsection 3.2 describes shallow fea-
ture extraction and tokenization required for the trans-
former model to further process the features. Subsec-
tion 3.3 discusses the proposed cross-modal convolu-
tional transformer.
3.1 Pre-Prossessing
The original HSI data can be denoted as X
H
∈
R
H×W ×D
, and LiDAR data can be represented as X
L
∈
R
H×W
. The spatial dimensions—height and width—
are represented by H and W , respectively, while D
represents the spectral dimensions of the HSI data.
HSI data has redundant spectral information within
hundreds of spectral dimensions. Therefore, principle
component analysis (PCA) is used to select informa-
tive spectral bands of the original HSI data. The HSI
data with reduced spectral dimensions is then repre-
sented as X
H
∈R
H×W ×D
red
, where D
red
is 30. Both the
HSI and LiDAR data are further processed; padding
is applied to preserve edge information, and patches
of dimension S ×S, where S is 11, are generated. The
center pixel of each patch represents the class label.
The resulting HSI and LiDAR data is represented as
X
P
H
∈ R
S×S×D
red
and X
P
L
∈ R
S×S×1
, respectively.
3.2 Spatial Feature Enhancer Module
and Tokenization
In this study, we propose a convolution-based spa-
tial feature enhancer module (SFEM) for initial fea-
ture extraction. This module utilizes pointwise con-
volutions, which are particularly important for HSI
data characterized by rich spectral information at each
spatial location. Pointwise convolutions facilitate the
learning of inter-band dependencies among different
spectral bands, a critical aspect in HSI where corre-
Towards Robust Multimodal Land Use Classification: A Convolutional Embedded Transformer
145
HSI
LiDAR
SFEM
Tokenizer
Cross Modal Convolutional
Transformer
Cross Modal Attention ModuleCross Modal Attention Module
SFEM
Tokenizer
Softmax
ReLU
Batch
Normalization
2D Point-wise
Convolution
ReLU
Batch
Normalization
2D Point-wise
Convolution
A
W
2D Flatten feature
A
W
2D Flatten feature
A
W
2D Flatten feature
Linear
Layer
GeLU
Dropout
Linear
Layer
GeLU
Dropout
Linear
Layer
GeLU
Dropout
Multi-scale Convolutional Encoder
Classification Tokens
Spectral-Spatial Tokens
Learnable CLS token
Learnable CLS tokenLearnable CLS token
MSCE
MSCE
(a) (b) (c)
Softmax
MLP
Head
MLP
Head
MLP
Head
MLP
Head
Figure 1: The proposed framework for land use classification using HSI and LiDAR modalities. The internal architecture of
the spatial feature enhancer module (SFEM) is shown in (a), the tokenizer is presented in (b), and the internal architecture of
the multi-layer perceptron (MLP) head is shown in (c).
lations between different spectral bands aid in under-
standing complex patterns within the data. Though
pointwise convolutions do not extract spatial features
directly, the enriched spectral features they produce
can indirectly enhance spatial features for subsequent
processing. Our motivation is to preserve spatial de-
tails while providing a rich feature set to downstream
modules, enabling more effective and sophisticated
feature learning. The pointwise convolutions apply
a 1×1 kernel to each spatial location, preserving the
original spatial dimensions of the data. This approach
enhances the overall framework’s capability to pro-
cess and synthesize the information across channels
without distorting the spatial information, unlike tech-
niques (Roy et al., 2023) (Roy et al., 2024) that do not
preserve the spatial information due to the use of large
kernel sizes in convolution layers. The pointwise con-
volution layers in the SFEM are followed by batch
normalization and a rectified linear unit (ReLU) layer
to stabilize the learning process and introduce neces-
sary non-linearity, respectively. The architecture of
SFEM is shown in Figure 1(a).
Initial feature extraction is performed through the
SFEM for both HSI and LiDAR modalities. For sub-
sequent processing of these extracted features in the
classification task through the transformer module,
tokenization is necessary. This tokenization is per-
formed by a tokenizer shown in Figure 1(b), which
converts feature maps into vectors by flattening them.
The 2D flattened feature map for HSI is represented
as X
f lat
H
∈R
xy×z
h
, and similarly, flattened LiDAR fea-
tures are represented as X
f lat
L
∈ R
xy×z
l
, where x de-
notes the height, y the width, and z
h
, z
l
the num-
ber of spectral bands for HSI and LiDAR, respec-
tively. The tokenization process employs two separate
learnable weights W
1
and W
2
, one for each modal-
ity, with weights initialized using a normal distribu-
tion through Xavier initialization (Zhao et al., 2022).
These weights are pointwise multiplied with feature
maps and softmax is applied to convert its scores.
The output is then transposed and multiplied with a
2D flattened feature map. The tokenization process
results in high-level semantic tokens of HSI and Li-
DAR. The process of tokenization HSI data is mathe-
matically expressed as follows:
x
hsi
= softmax(X
f lat
H
W
1
)
T
X
f lat
H
(1)
3.3 Cross-Modal Convolutional
Transformer
The proposed cross-modal convolutional transformer
consists of two parts: a multiscale convolutional em-
bedded encoder and a cross-modal attention module.
Subsubsection 3.3.1 provides a detailed discussion
of the encoder, while Subsubsection 3.3.2 discusses
cross-modal attention module for cross-modal feature
VISAPP 2025 - 20th International Conference on Computer Vision Theory and Applications
146
learning and the final classification.
3.3.1 Multi-Scale Convolution Embedded
Encoder
The semantic tokens generated by the tokenizer are
utilized by the transformer encoder to identify cor-
relations between tokens through a multi-head self-
attention mechanism, which comprises multiple self-
attention mechanisms. Each self-attention mech-
anism computes correlations between tokens using
three learnable weights: W
q
for queries, W
k
for keys,
and W
v
for values. These weights are multiplied with
the feature tokens and projected onto three linearly
mapped matrices: Q for queries, K for keys, and V for
values. Using Q and K, attention scores are then com-
puted with the softmax function. The self-attention is
mathematically represented as follows:
SA = Attention(Q,K,V ) = softmax
QK
T
√
D
V (2)
In the case of multi-head self-attention, the pro-
jection of tokens is divided by the number of heads,
i.e., D =
C
h
, where h is the number of heads. How-
ever, after concatenation, the dimensions are restored
by applying a projection matrix W
O
to combine the
outputs from all heads back to the original dimen-
sionality, ensuring that the multi-head self-attention
effectively integrates diverse perspectives from each
head. The multi-head self-attention is represented in
Equation 3.
MHSA(Q,K,V ) = Concat(SA
1
,SA
2
,..., SA
h
)W
O
(3)
where SA
i
= softmax
Q
i
K
T
i
√
d
k
V
i
represents the output
from the i-th self-attention head, Q
i
, K
i
, and V
i
are
parts of Q, K, and V that correspond to the i-th head,
and W
O
is the output projection matrix that recom-
bines the attention outputs into a single tensor. The
MHSA computes correlations in a global manner but
lacks correlation between local semantic tokens.
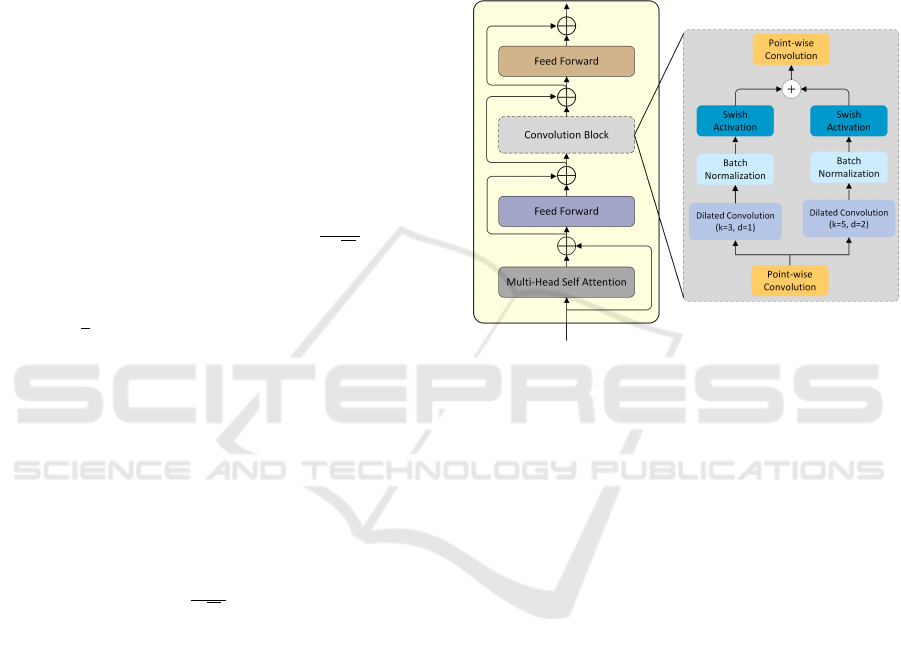
To address this issue, inspired by (Gulati et al.,
2020), a convolutional block is embedded in the trans-
former encoder after the multi-head self-attention to
find correlations between local tokens from those al-
ready processed through MHSA. The architecture of
the MSCE is shown in Figure 2. The adapted convo-
lution block (Khotimah et al., 2023) starts with the
pointwise convolution followed by dual stream 1D
convolutions that find correlations between tokens at
different scales for local semantics. These streams
utilize 1D dilated convolutions with kernel sizes of 3
and 5. Subsequently, batch normalization and a swish
activation function are applied. To enrich local se-
mantics further, the outputs of both convolutions are
merged using element-wise summation. Finally, the
merged output is passed through a pointwise convo-
lution again to transform the features back to their
original size. The convolutional block is sandwiched
between two feed-forward networks. Residual con-
nection has also been used to avoid the vanishing gra-
dient problem.
Figure 2: The architecture of the multi-scale convolutional
embedded encoder (MSCE). The left shows the transformer
encoder embedded with a convolutional block, while the
right shows the internal layer structure of the convolutional
block.
3.3.2 Cross-Modal Feature Learning and
Classification
As both modalities have been treated separately thus
far, capturing information specific to their corre-
sponding modality, it is important to learn comple-
mentary details from each other. Cross learning can
improve the learning capability of the model to ef-
fectively utilize complementary information for final
classification (Chen et al., 2021), (Xue et al., 2022).
In the proposed cross-modal feature learning strat-
egy, classification tokens containing rich informa-
tion specific to each modality are exchanged between
modalities to learn the complementary information
present in each. In this process, the HSI classifica-
tion token attends to all LiDAR tokens, and the Li-
DAR classification token attends to all HSI tokens.
After this exchange of information, classification to-
kens are projected back to their respective modalities,
but now these classification tokens contain comple-
mentary information from the other modality. These
updated classification tokens interact with their own
tokens in the next encoder, thus passing learned in-
formation from the other modality and this interac-
Towards Robust Multimodal Land Use Classification: A Convolutional Embedded Transformer
147
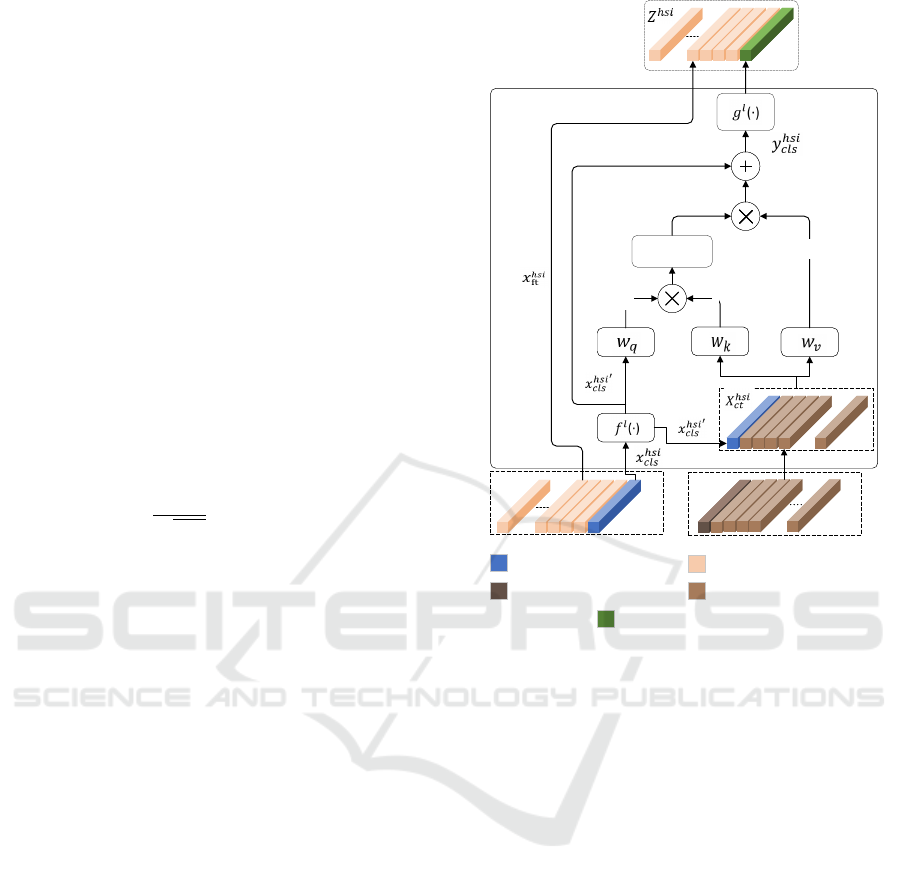
tion further enriches the exchange of information. For
simplicity and to avoid confusion, we have explained
the cross-modal feature learning for HSI. This process
is also illustrated in Figure 3. As we know, LiDAR
tokens are of two types: feature tokens and classifica-
tion (cls) tokens. The cls token of LiDAR is replaced
with the HSI cls token. This gives a new set of tokens
that we call cross-modal tokens. Mathematically, the
new set of feature tokens is shown in Equation 4.
X
hsi
ct
= [ f
l
(x
hsi
′
cls
) ∥ x
lidar
], (4)
where f
l
(·) is the linear transformation on the
HSI cls token for dimensionality alignment. Sub-
sequently, cross-attention is performed between x
hsi
′
cls
and X
hsi
ct
. The cls token (x
hsi
′
cls
) is the query used for
cross-attention that contains information of the HSI
feature tokens. The cross-attention is mathematically
represented as follows:
q = x
hsi’
cls
W
q
, k = X
hsi
ct
W
k
, v = X
hsi
ct
W
v
,
A = softmax
qk
T
p
C/h
!
, CA(X
hsi
ct
) = Av
(5)
Where W
q
, W
k
, and W
v
are learnable weights. Sim-
ilar to self-attention, multiple heads have been used
for cross-attention. The multi-head cross-attention is
mathematically shown in Equation 6. The output of
cross-attention is shown in Equation 7.
y
hsi
cls
= f
l
(x
hsi
cls
) + MHCA(LN f
l
(x
hsi
cls
) ∥ x
lidar
ft
)) (6)
z
hsi
= [g
l
(y
hsi
cls
) ∥ x
hsi
ft
] (7)
The HSI classification token (y
hsi
cls
) and LiDAR
classification token (y
lidar
cls
), obtained by the process
discussed above, are passed through a linear transfor-
mation layer g
l
(·) as shown in Figure 3. Following
that, these tokens passed through two separate MLP
heads, as depicted in Figure 1. Each MLP head is
composed of two linear layers, a GeLU activation,
and a dropout layer. The last linear layer employs
softmax activation. The arrangement of MLP layers
is shown in Figure 1 (c). The outputs of both MLP
heads are added together for the final classification.
4 EXPERIMENTAL DETAILS
AND RESULTS
This section presents the results obtained using the
proposed technique. The dataset employed for evalu-
ation is discussed in Subsection 4.1, while the experi-
mental setup is defined in Subsection 4.2. Subsection
Softmax
q
k
v
concat
concat
HSI Tokens
LiDAR Tokens
HSI classification token
HSI feature token
LiDAR classification token
LiDAR feature token
Updated HSI classification token
Figure 3: Internal structure of the cross-modal attention
module, which jointly learns features from HSI and LiDAR
data to extract complementary information.
4.3 presents the classification results, including com-
parisons with other techniques, to demonstrate the ef-
fectiveness of the proposed approach. Subsection 4.4
discusses the ablation study to further evaluate the im-
pact of different parameters.
4.1 Dataset
The Trento dataset (Rasti et al., 2017a), utilized for
evaluating the proposed technique, consists of mul-
timodal data that have HSI and LiDAR modalities.
This dataset captures diverse land cover types across
southern Italy, collected using the ASIA sensor for
HSI and the Optech ALTM 3100EA sensor for Li-
DAR. The HSI data contains 63 spectral bands span-
ning the electromagnetic spectrum from 0.42 to 0.99
micrometers. The dataset is categorized into six dis-
tinct classes, with both HSI and LiDAR data featuring
a spatial resolution of 166 ×166. Detailed distribu-
tions of the training and testing samples used to assess
the proposed technique are presented in Table 1.
VISAPP 2025 - 20th International Conference on Computer Vision Theory and Applications
148
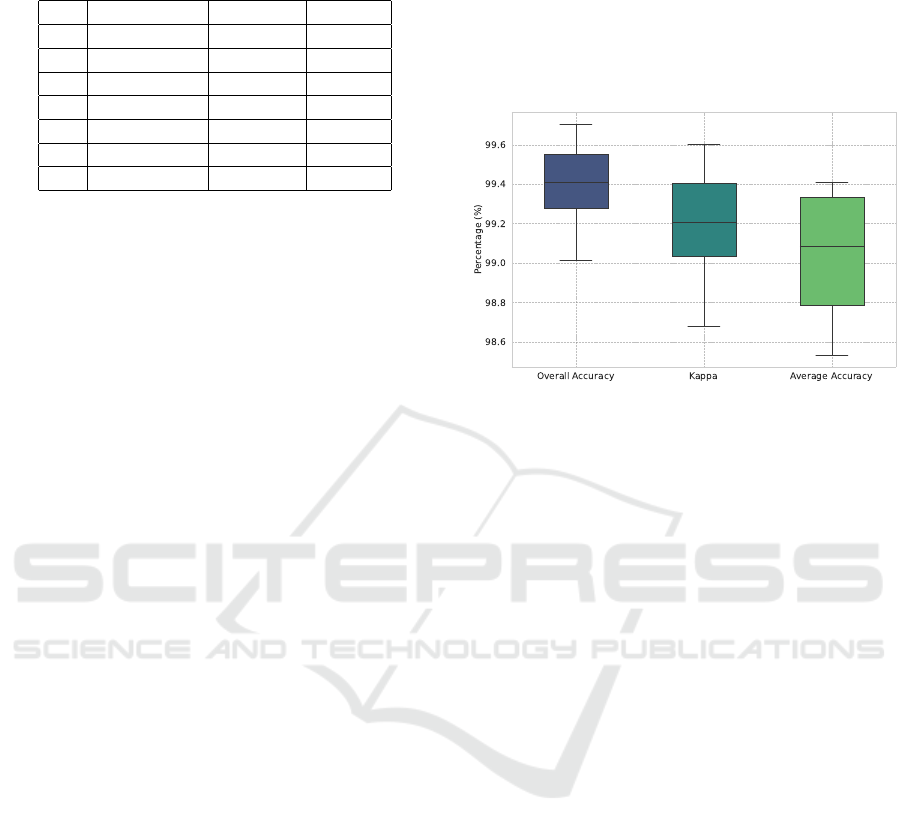
Table 1: Description of used Trento dataset (Rasti et al.,
2017a).
No Classes Training Testing
1 Apple Trees 129 3905
2 Buildings 125 2778
3 Ground 105 374
4 Wood 154 8969
5 Vineyards 184 10317
6 Roads 122 3052
- - 819 29395
4.2 Experimental Setup
The training of the proposed model was executed on
a system equipped with an Intel Core i7 processor,
complemented by 32GB of RAM and an 8GB GPU.
Experiments were conducted using a learning rate of
0.001 and a batch size of 64, aligning with the param-
eters commonly adopted in similar research studies.
The optimization was facilitated by the Adam opti-
mizer, selected for its robust performance in compa-
rable scenarios. This setup maintained a consistent
learning rate and batch size throughout the experi-
ments. The model’s performance was evaluated using
the cross-entropy loss function, mathematically rep-
resented in Equation 8.
L
CE
(y,p) = −
C
∑
i=1
y
i
log(p
i
) (8)
where y is the one-hot encoded true label vector,
p is the predicted probability distribution across C
classes, y
i
is the true label for class i , and p
i
is the
predicted probability for class i.
4.3 Classification Results
In this work, three evaluation metrics have been used
to assess the performance of the proposed technique
on the Trento dataset. The evaluation metrics are
overall accuracy, average accuracy, and kappa. Over-
all accuracy evaluates the performance by considering
the total correct predictions, whereas average accu-
racy and kappa account for class-wise correct predic-
tions.
The results of the proposed technique are com-
pared against CNN-based (Hong et al., 2020) (Zhang
et al., 2018) and transformer-based approaches (Feng
et al., 2024) (Roy et al., 2023) (Roy et al., 2024). All
these techniques used data samples for training and
testing, as in Table 1. The performance comparison
of our proposed technique with the mentioned tech-
niques is presented in Table 2. The table depicts the
superiority of our proposed technique across all three
metrics used (highlighted in the table). We repeated
the experiments five times, reporting the mean and
standard deviation. Figure 4 shows a boxplot that
illustrates the deviation from the mean value. The
boxplot indicates that overall accuracy and kappa are
more stable compared to average accuracy.
Figure 4: Boxplot showing the variability and median val-
ues of overall accuracy, kappa, and average accuracy across
five experimental iterations.
The Cross-HL technique shows the second-best
results in terms of overall accuracy and kappa, and
slightly less average accuracy compared to PToP
CNN. Furthermore, to conduct a thorough analysis,
class-wise accuracy is presented in Table 3, which
provides further insights into the results of the pro-
posed technique. The class-wise accuracies of our
proposed technique are consistent across all classes,
showcasing its ability to learn discriminative features.
The proposed technique attained the highest accu-
racy in two classes, namely Wood and Roads. It can
be observed from the table that all other techniques
show limitations in recognizing Buildings and Roads
classes.
Unlike other techniques, which perform well ei-
ther on Buildings or Roads class, both Cross-HL and
our proposed technique exhibit nearly equal accuracy
on these classes. However, our technique shows sig-
nificant improvements of 3.29% for Buildings and
4.51% for Roads compared to Cross-HL. MFT, de-
spite attaining the highest accuracy for the Buildings
class, demonstrated decreased accuracy in the Roads
class, reporting only 88.72%, which was the lowest
among all evaluated techniques. It can be noticed that
some of the other compared techniques perform well
on certain classes; however, they are unable to rec-
ognize difficult classes—such as Buildings, Ground,
and Roads—effectively, reducing their overall perfor-
mance. The results of our proposed method can also
be validated with a confusion matrix presented in Fig-
ure 5, which provides similar insights; Buildings and
Roads classes are the most misclassified, likely due
Towards Robust Multimodal Land Use Classification: A Convolutional Embedded Transformer
149
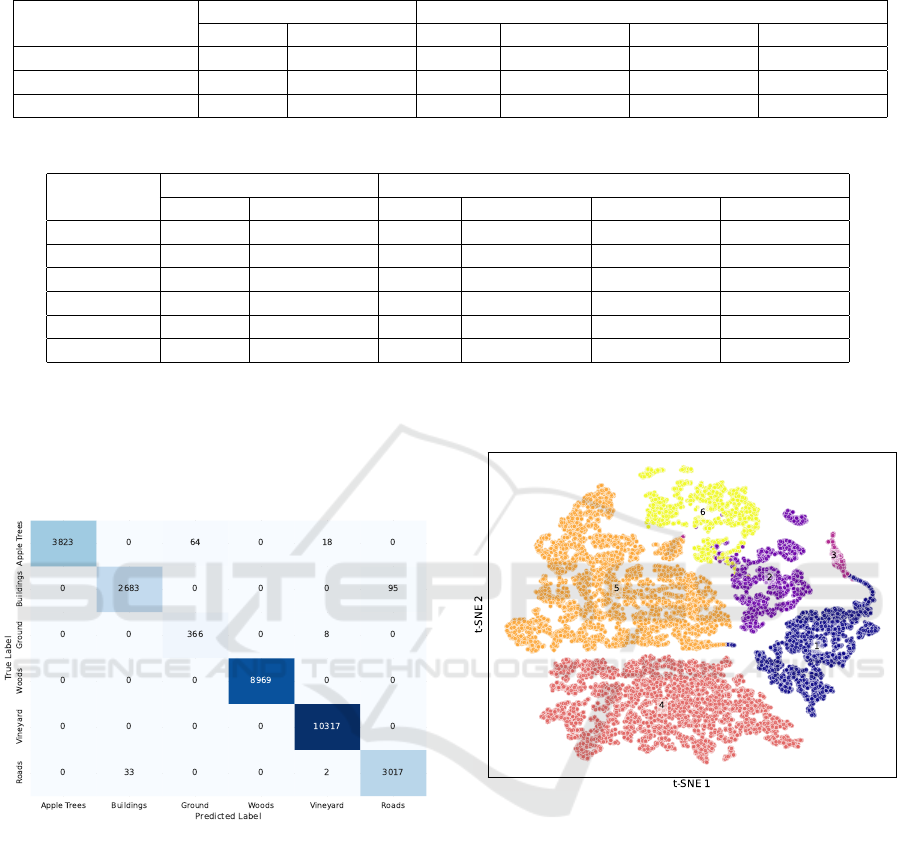
Table 2: Overall performance comparison with other techniques.
Evaluation metrics
CNN-based techniques Transformer-based techniques
EndNet PToP CNN S2EFT MFT Cross-HL Ours
OA 94.17 98.34 98.45 97.76 ± 0.40 98.69 ± 0.31 99.40 ± 0.22
AA 93.88 97.53 97.62 95.91 ± 0.41 97.47 ± 0.30 99.04 ± 0.33
k 92.22 97.79 97.92 97.00 ± 0.53 98.25 ± 0.26 99.19 ± 0.30
Table 3: Class-wise accuracy comparison with other techniques.
Classes
CNN-based techniques Transformer-based techniques
EndNet PToP CNN S2EFT MFT Cross-HL Ours
Apple Tree 88.19 99.60 97.95 98.23 ± 0.38 99.32 ± 0.31 98.43 ± 0.57
Building 98.49 93.90 97.77 99.34 ± 0.02 95.32 ± 1.42 98.61 ± 1.03
Ground 95.19 100 98.40 89.84 ± 9.00 97.62 ± 0.17 99.36± 0.52
Wood 99.30 99.27 99.73 99.82 ± 0.26 99.89 ± 0.10 100 ± 0.00
Vineyard 91.96 100 99.50 99.93 ± 0.05 99.97 ± 0.04 99.74 ± 0.44
Road 90.14 97.28 92.37 88.72 ± 0.94 94.17 ± 1.36 98.68 ± 0.67
to similar spectral information from their same con-
struction materials. The Apple Trees class also shows
some instances of misclassification with the Ground
and Vineyard classes. Woods and Vineyard classes
are accurately classified.
Figure 5: The confusion matrix of the proposed technique
illustrates the misclassification between different classes.
This matrix represents the results achieved from one of the
five experimental runs, offering insight into the model’s
classification performance.
Moreover, we have used a t-SNE plot to visual-
ize the predictions on the test set. It also displays
the number of test samples per class with the clus-
ter size; a larger cluster indicates a larger test sample
for that particular class. The trend of misclassifica-
tion can also be seen through the t-SNE plot in Figure
6, where the Buildings class (purple) overlaps with
the Roads class (yellow), depicting misclassification
between them. Both the confusion matrix and t-SNE
plots support our results presented in Tables 2 and 3.
Figure 7 visually presents the HSI and LiDAR modal-
ities along with the ground truth. It also shows the
classification map generated using the proposed tech-
nique in Figure 7(d).
Figure 6: t-SNE visualization of predicted class distribu-
tions from the test set. Colors indicate predicted classes:
Apple tree (blue), Building (purple), Ground (pink), Wood
(red), Vineyard (orange), and Roads (yellow). (Best viewed
in color).
4.4 Analysis of the Impact of Patch Size
and Attention Heads
Several experiments were conducted to assess the im-
pact of varying patch sizes and the number of atten-
tion heads in the transformer encoder on model per-
formance. The patch sizes considered were 7, 9, 11,
and 13. The performance based on patch size can be
analyzed using a radar chart, where each axis rep-
resents a patch size, as shown in Figure 8(a). The
analysis revealed that the optimal performance was
achieved with a patch size of 11, as it is closest to
VISAPP 2025 - 20th International Conference on Computer Vision Theory and Applications
150
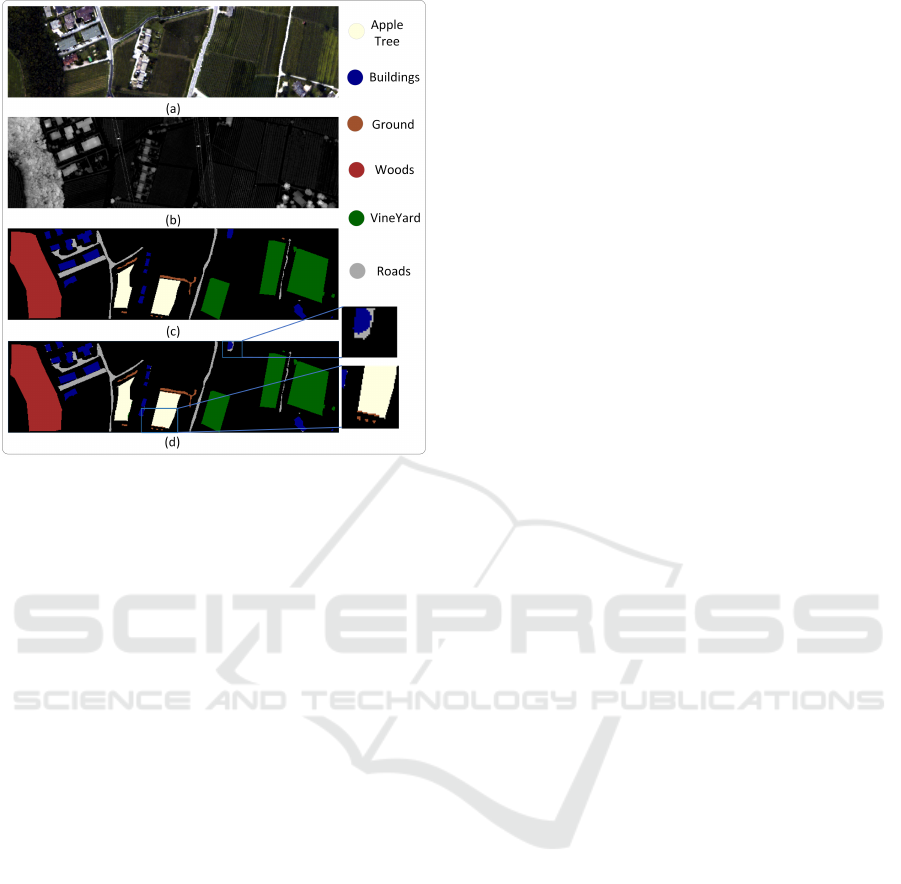
Figure 7: (a) shows the pseudo-color map of the HSI data
using selected bands (20, 15, 5), (b) shows the grayscale vi-
sualization of the LiDAR data, (c) shows the ground truth
available for six unique classes, (d) represents the classifi-
cation map generated using the proposed technique.
the outermost edge (indicating higher values) on the
radar chart for overall accuracy, average accuracy, and
kappa. Similarly, optimal performance is achieved
when the number of attention heads is 8, with each
axis representing different attention heads, i.e., 2, 4,
6, and 8. Figure 8(b) shows that optimal performance
is attained using 8 attention heads.
5 CONCLUSION
In this study, we presented a novel transformer-based
technique for multimodal land use classification, uti-
lizing HSI and LiDAR modalities. The proposed
dual-stream architecture effectively extracts features
from both modalities, with the cross-modal convolu-
tional transformer demonstrating its ability to learn
local and global features. The incorporation of a
cross-modal attention module enables joint learning
between modalities, utilizing complementary infor-
mation to extract more discriminative features. The
proposed method enhances classification accuracy for
impactful applications in environmental monitoring,
urban planning, and other areas where precise land
use classification is essential.
Our experimental results demonstrate the superior
performance of this technique over comparable exist-
ing methods, showcasing its potential to advance the
field of remote sensing. Future work will focus on in-
corporating additional modalities and further improv-
ing the model to handle complex datasets, ensuring
broader applicability and continued advancements in
performance.
REFERENCES
Chen, C.-F. R., Fan, Q., and Panda, R. (2021). Crossvit:
Cross-attention multi-scale vision transformer for im-
age classification. In Proceedings of the IEEE/CVF
international conference on computer vision, pages
357–366.
Ding, K., Lu, T., Fu, W., Li, S., and Ma, F. (2022). Global–
local transformer network for hsi and lidar data joint
classification. IEEE Transactions on Geoscience and
Remote Sensing, 60:1–13.
Ding, Z., Zhou, D., Li, H., Hou, R., and Liu, Y.
(2021). Siamese networks and multi-scale local ex-
trema scheme for multimodal brain medical image
fusion. Biomedical Signal Processing and Control,
68:102697.
Du, X., Zheng, X., Lu, X., and Doudkin, A. A. (2021). Mul-
tisource remote sensing data classification with graph
fusion network. IEEE Transactions on Geoscience
and Remote Sensing, 59(12):10062–10072.
Fan, Y., Qian, Y., Qin, Y., Wan, Y., Gong, W., Chu, Z., and
Liu, H. (2022). Mslaenet: Multiscale learning and at-
tention enhancement network for fusion classification
of hyperspectral and lidar data. IEEE Journal of Se-
lected Topics in Applied Earth Observations and Re-
mote Sensing, 15:10041–10054.
Feng, M., Gao, F., Fang, J., and Dong, J. (2021). Hy-
perspectral and lidar data classification based on lin-
ear self-attention. In 2021 IEEE International Geo-
science and Remote Sensing Symposium IGARSS,
pages 2401–2404.
Feng, Q., Zhu, D., Yang, J., and Li, B. (2019). Multisource
hyperspectral and lidar data fusion for urban land-use
mapping based on a modified two-branch convolu-
tional neural network. ISPRS International Journal
of Geo-Information, 8(1):28.
Feng, Y., Zhu, J., Song, R., and Wang, X. (2024). S2eft:
Spectral-spatial-elevation fusion transformer for hy-
perspectral image and lidar classification. Knowledge-
Based Systems, 283:111190.
Ghamisi, P., Yokoya, N., Li, J., Liao, W., Liu, S., Plaza, J.,
Rasti, B., and Plaza, A. (2017). Advances in hyper-
spectral image and signal processing: A comprehen-
sive overview of the state of the art. IEEE Geoscience
and Remote Sensing Magazine, 5(4):37–78.
Gulati, A., Qin, J., Chiu, C.-C., Parmar, N., Zhang, Y., Yu,
J., Han, W., Wang, S., Zhang, Z., Wu, Y., et al. (2020).
Conformer: Convolution-augmented transformer for
speech recognition. arXiv preprint arXiv:2005.08100.
G
´
omez-Chova, L., Tuia, D., Moser, G., and Camps-Valls,
G. (2015). Multimodal classification of remote sens-
ing images: A review and future directions. Proceed-
ings of the IEEE, 103(9):1560–1584.
Towards Robust Multimodal Land Use Classification: A Convolutional Embedded Transformer
151
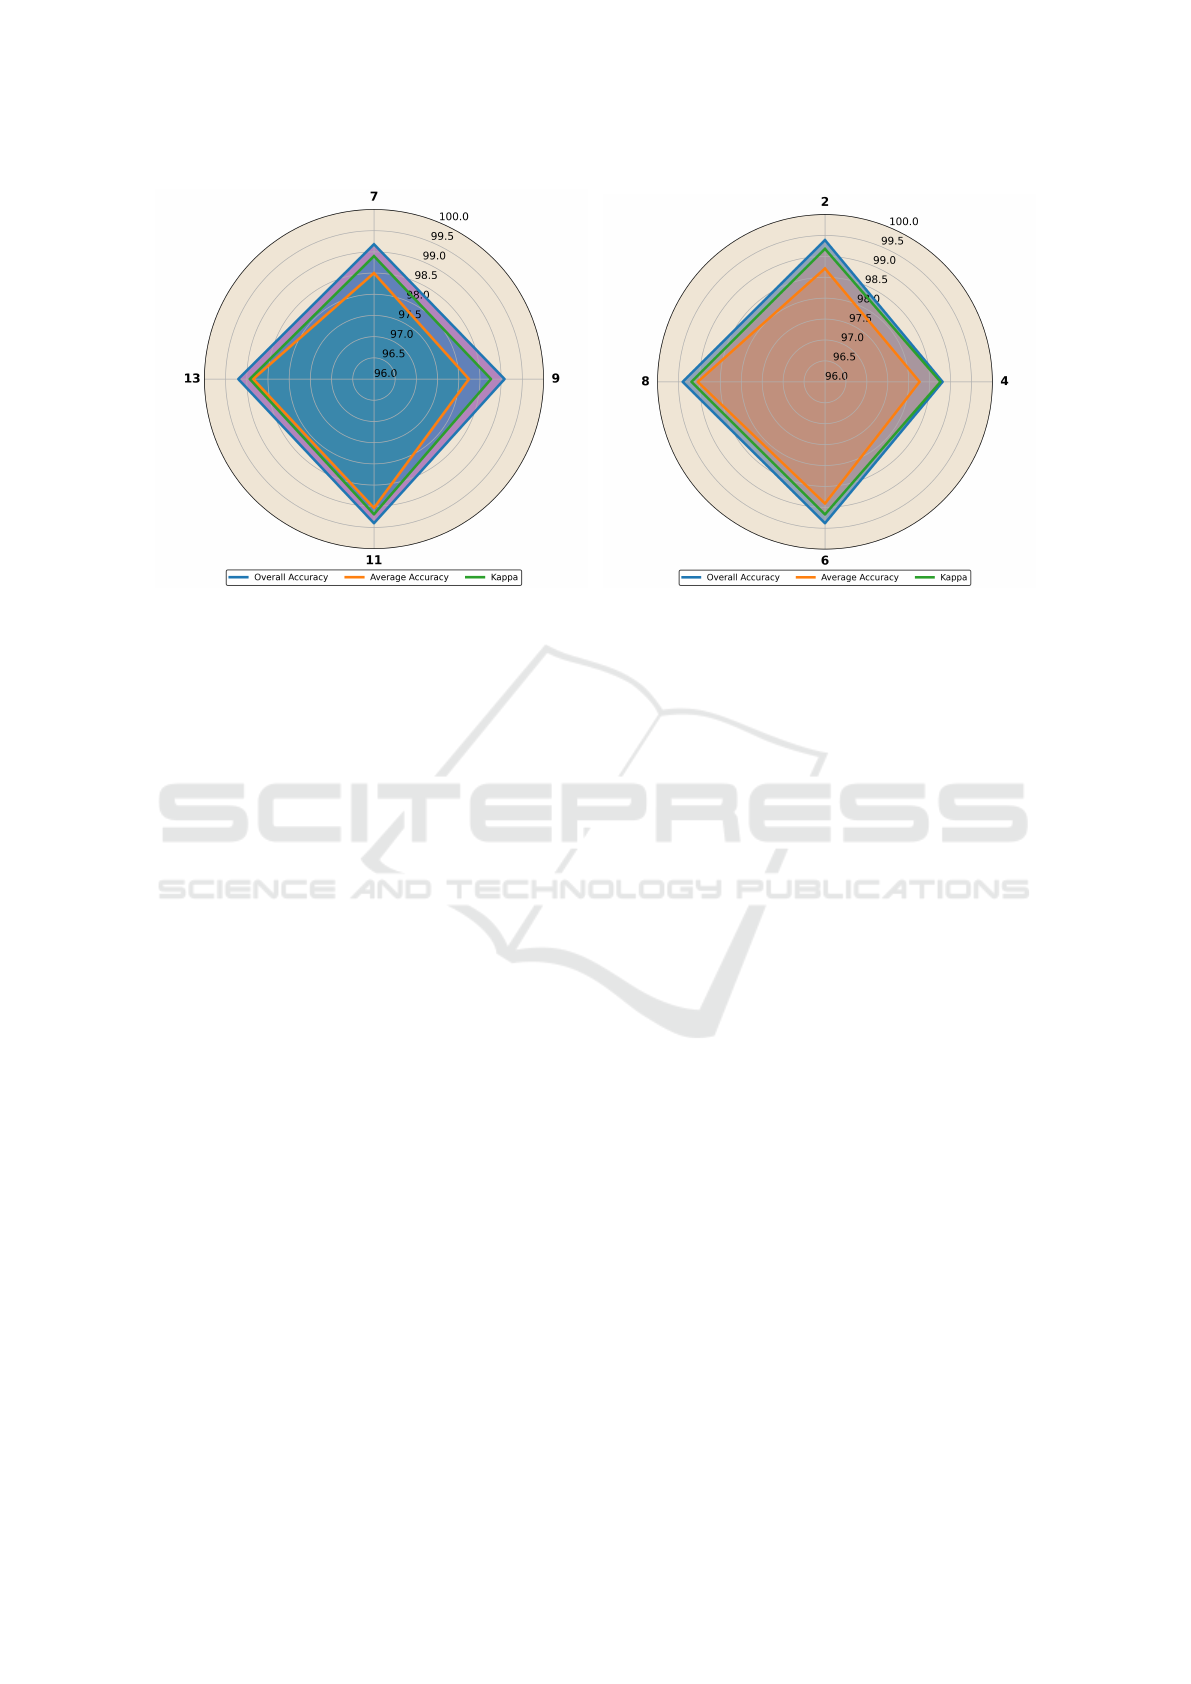
(a) (b)
Figure 8: Radar charts depicting the analysis of model performance: (a) shows the impact of patch size, while (b) illustrates
the effect of the number of attention heads. The chart highlights optimal performance at a patch size of 11 and 8 attention
heads. (Best viewed in color).
Hermessi, H., Mourali, O., and Zagrouba, E. (2021). Mul-
timodal medical image fusion review: Theoretical
background and recent advances. Signal Processing,
183:108036.
Hong, D., Gao, L., Hang, R., Zhang, B., and Chanussot,
J. (2020). Deep encoder–decoder networks for clas-
sification of hyperspectral and lidar data. IEEE Geo-
science and Remote Sensing Letters, 19:1–5.
Hong, D., Han, Z., Yao, J., Gao, L., Zhang, B., Plaza, A.,
and Chanussot, J. (2021). Spectralformer: Rethinking
hyperspectral image classification with transformers.
IEEE Transactions on Geoscience and Remote Sens-
ing, 60:1–15.
Hong, D., Han, Z., Yao, J., Gao, L., Zhang, B., Plaza, A.,
and Chanussot, J. (2022). Spectralformer: Rethinking
hyperspectral image classification with transformers.
IEEE Transactions on Geoscience and Remote Sens-
ing, 60:1–15.
Jia, S., Zhan, Z., Zhang, M., Xu, M., Huang, Q., Zhou, J.,
and Jia, X. (2021). Multiple feature-based superpixel-
level decision fusion for hyperspectral and lidar data
classification. IEEE Transactions on Geoscience and
Remote Sensing, 59(2):1437–1452.
Khotimah, W. N., Bennamoun, M., Boussaid, F., Xu, L.,
Edwards, D., and Sohel, F. (2023). Mce-st: Classi-
fying crop stress using hyperspectral data with a mul-
tiscale conformer encoder and spectral-based tokens.
International Journal of Applied Earth Observation
and Geoinformation, 118:103286.
Li, J., Ma, Y., Song, R., Xi, B., Hong, D., and Du, Q. (2022).
A triplet semisupervised deep network for fusion clas-
sification of hyperspectral and lidar data. IEEE Trans-
actions on Geoscience and Remote Sensing, 60:1–13.
Liao, W., Pi
ˇ
zurica, A., Bellens, R., Gautama, S., and
Philips, W. (2014). Generalized graph-based fusion of
hyperspectral and lidar data using morphological fea-
tures. IEEE Geoscience and Remote Sensing Letters,
12(3):552–556.
Mohla, S., Pande, S., Banerjee, B., and Chaudhuri, S.
(2020). Fusatnet: Dual attention based spectrospatial
multimodal fusion network for hyperspectral and lidar
classification. In Proceedings of the IEEE/CVF Con-
ference on Computer Vision and Pattern Recognition
Workshops, pages 92–93.
Ni, K., Wang, D., Zheng, Z., and Wang, P. (2024). Mhst:
Multiscale head selection transformer for hyperspec-
tral and lidar classification. IEEE Journal of Selected
Topics in Applied Earth Observations and Remote
Sensing.
Rasti, B. and Ghamisi, P. (2020). Remote sensing image
classification using subspace sensor fusion. Informa-
tion Fusion, 64:121–130.
Rasti, B., Ghamisi, P., and Gloaguen, R. (2017a). Hy-
perspectral and lidar fusion using extinction pro-
files and total variation component analysis. IEEE
Transactions on Geoscience and Remote Sensing,
55(7):3997–4007.
Rasti, B., Ghamisi, P., Plaza, J., and Plaza, A. (2017b). Fu-
sion of hyperspectral and lidar data using sparse and
low-rank component analysis. IEEE Transactions on
Geoscience and Remote Sensing, 55(11):6354–6365.
Roy, S. K., Deria, A., Hong, D., Rasti, B., Plaza, A., and
Chanussot, J. (2023). Multimodal fusion transformer
for remote sensing image classification. IEEE Trans-
actions on Geoscience and Remote Sensing, 61:1–20.
Roy, S. K., Sukul, A., Jamali, A., Haut, J. M., and Ghamisi,
P. (2024). Cross hyperspectral and lidar attention
transformer: An extended self-attention for land use
and land cover classification. IEEE Transactions on
Geoscience and Remote Sensing.
VISAPP 2025 - 20th International Conference on Computer Vision Theory and Applications
152

Tang, W., He, F., Liu, Y., and Duan, Y. (2022). Matr: Mul-
timodal medical image fusion via multiscale adaptive
transformer. IEEE Transactions on Image Processing,
31:5134–5149.
Vaswani, A. (2017). Attention is all you need. Advances in
Neural Information Processing Systems.
Wang, X., Feng, Y., Song, R., Mu, Z., and Song, C. (2022).
Multi-attentive hierarchical dense fusion net for fusion
classification of hyperspectral and lidar data. Informa-
tion Fusion, 82:1–18.
Wu, X., Hong, D., and Chanussot, J. (2021). Convolutional
neural networks for multimodal remote sensing data
classification. IEEE Transactions on Geoscience and
Remote Sensing, 60:1–10.
Xue, Z., Tan, X., Yu, X., Liu, B., Yu, A., and Zhang, P.
(2022). Deep hierarchical vision transformer for hy-
perspectral and lidar data classification. IEEE Trans-
actions on Image Processing, 31:3095–3110.
Xue, Z., Yu, X., Tan, X., Liu, B., Yu, A., and Wei, X.
(2021). Multiscale deep learning network with self-
calibrated convolution for hyperspectral and lidar data
collaborative classification. IEEE Transactions on
Geoscience and Remote Sensing, 60:1–16.
Yang, B., Wang, X., Xing, Y., Cheng, C., Jiang, W., and
Feng, Q. (2024). Modality fusion vision transformer
for hyperspectral and lidar data collaborative classifi-
cation. IEEE Journal of Selected Topics in Applied
Earth Observations and Remote Sensing.
Yu, Y., Jiang, T., Gao, J., Guan, H., Li, D., Gao, S., Tang, E.,
Wang, W., Tang, P., and Li, J. (2022). Capvit: Cross-
context capsule vision transformers for land cover
classification with airborne multispectral lidar data.
International Journal of Applied Earth Observation
and Geoinformation, 111:102837.
Zhang, M., Gao, F., Zhang, T., Gan, Y., Dong, J., and Yu,
H. (2023). Attention fusion of transformer-based and
scale-based method for hyperspectral and lidar joint
classification. Remote Sensing, 15(3):650.
Zhang, M., Li, W., Du, Q., Gao, L., and Zhang, B. (2018).
Feature extraction for classification of hyperspectral
and lidar data using patch-to-patch cnn. IEEE trans-
actions on cybernetics, 50(1):100–111.
Zhang, M., Li, W., Tao, R., Li, H., and Du, Q. (2021). Infor-
mation fusion for classification of hyperspectral and
lidar data using ip-cnn. IEEE Transactions on Geo-
science and Remote Sensing, 60:1–12.
Zhang, Y., Peng, Y., Tu, B., and Liu, Y. (2022). Local
information interaction transformer for hyperspectral
and lidar data classification. IEEE Journal of Se-
lected Topics in Applied Earth Observations and Re-
mote Sensing, 16:1130–1143.
Zhao, G., Ye, Q., Sun, L., Wu, Z., Pan, C., and Jeon,
B. (2022). Joint classification of hyperspectral and
lidar data using a hierarchical cnn and transformer.
IEEE Transactions on Geoscience and Remote Sens-
ing, 61:1–16.
Towards Robust Multimodal Land Use Classification: A Convolutional Embedded Transformer
153
