
Enhancing Diagnostic Accuracy of Drug-Resistant Tuberculosis on Chest
X-Rays Using Data-Efficient Image Transformers
Joan Jonathan Mnyambo
1 a
, Amir Aly
1 b
, Shang-Ming Zhou
2 c
, Yinghui Wei
1 d
,
Stephen Mullin
3 e
and Emmanuel Ifeachor
1 f
1
School of Engineering, Computing, and Mathematics, University of Plymouth, Plymouth, U.K.
2
School of Nursing and Midwifery, University of Plymouth, Plymouth, U.K.
3
Peninsula Medical School, University of Plymouth, Plymouth, U.K.
{joan.mnyambo, amir.aly, shangming.zhou, yinghui.wei, stephen.mullin, e.ifeachor}@plymouth.ac.uk
Keywords:
Tuberculosis, Drug Resistance, Deep Learning, Vision Transformer, Data-Efficient Image Transformer,
Transfer Learning, Chest X-Rays.
Abstract:
Tuberculosis is an infectious disease with increasing fatalities around the world. The diagnosis of the disease
is a major challenge to its control and management due to the lack of adequate diagnostic tools, contributing
significantly to the prevalence of drug-resistant tuberculosis. Convolutional Neural Network (CNN) models
have recently been developed to detect drug-resistant tuberculosis by analyzing chest radiograph images from
the TB portal, but the classification results are low. This is because CNNs struggle to capture complex global
and overlapping features in medical imaging, such as chest radiographs of drug-resistant tuberculosis. In
contrast, transformers excel in these areas by utilizing self-attention mechanisms that detect inherent subtle and
long-range dependencies across images. In this study, we used a pretrained data-efficient image transformer
(DEiT) model to enhance the diagnosis of drug-resistant tuberculosis and differentiate it from drug-sensitive
tuberculosis. The new model achieved an AUC of 80% in the detection of drug-resistant tuberculosis, an
improvement of 13% in the AUC compared to current CNN models using data from the same source. The
bootstrap significance test shows that the difference in AUCs is statistically significant. The results of the
study can help healthcare providers improve drug-resistant tuberculosis diagnostic accuracy and treatment
outcomes.
1 INTRODUCTION
Tuberculosis (TB) is commonly known as an airborne
disease that causes a high global rate of severe ill-
ness and death. Despite TB being curable, drug-
resistant tuberculosis (DR-TB) has recently emerged
as the main public health challenge impeding the suc-
cess of TB control worldwide (World Health Organi-
zation, 2023). This stems from a lack of adequate
tools to diagnose drug-resistant TB for early treat-
ment, especially in developing countries. Each year,
it is estimated that 0.5 million TB cases out of 10 mil-
lion cases worldwide are drug-resistant, which brings
complications to treatment (Yang et al., 2022). DR-
a
https://orcid.org/0000-0002-4365-7067
b
https://orcid.org/0000-0001-5169-0679
c
https://orcid.org/0000-0002-0719-9353
d
https://orcid.org/0000-0002-7873-0009
e
https://orcid.org/0000-0002-1936-394X
f
https://orcid.org/0000-0001-8362-6292
TB occurs when Mycobacterium tuberculosis (MTB)
in a patient develops resistance to one or more stan-
dard tuberculosis drugs (Sachan et al., 2023; Silva
et al., 2023).
Drug-resistant TB is categorized into different
types based on severity: Resistance to only one first-
line anti-TB medication is known as mono DR-TB,
whereas poly DR-TB is the resistance to two or more
first-line anti-TB drugs. Multidrug DR-TB (MDR-
TB) occurs when the MTB is non-reactive to the ma-
jority of first-line medicaments. On the other hand,
extensive DR-TB (XDR-TB) is the term used for re-
sistance to drugs of both the first and second line. Fur-
thermore, pre extensively DR (Pre XDR) is more re-
sistant than MDR-TB with the additional resistance
to second-line drugs (Sethanan et al., 2023). In this
regard, DR-TB is complicated, and its diagnosis and
treatment are more challenging as it is costly and lasts
for a long period, about 9 to 20 months. Compare
this to drug-sensitive TB (DS-TB), which requires
184
Mnyambo, J. J., Aly, A., Zhou, S.-M., Wei, Y., Mullin, S. and Ifeachor, E.
Enhancing Diagnostic Accuracy of Drug-Resistant Tuberculosis on Chest X-Rays Using Data-Efficient Image Transformers.
DOI: 10.5220/0013191400003911
Paper published under CC license (CC BY-NC-ND 4.0)
In Proceedings of the 18th International Joint Conference on Biomedical Engineering Systems and Technologies (BIOSTEC 2025) - Volume 2: HEALTHINF, pages 184-194
ISBN: 978-989-758-731-3; ISSN: 2184-4305
Proceedings Copyright © 2025 by SCITEPRESS – Science and Technology Publications, Lda.

an individual to take a course of treatment for 6–9
months (Karki et al., 2022). The DS-TB commonly
known as TB has been effectively cured by using stan-
dard initial anti-tuberculosis medicaments (Mnyambo
and Barakabitze, 2023). Early tuberculosis and DR-
TB diagnosis are crucial to improving treatment out-
comes and reducing the transmission rate of TB in the
community (Yang et al., 2022).
Health facilities must provide accurate and timely
diagnosis alongside appropriate treatment to address
the challenges posed by drug-resistant tuberculosis
(Ereso et al., 2023; Vats et al., 2024). Achieving
the end-tuberculosis strategy requires sensitive diag-
nostic tools to distinguish TB from DR-TB (Naidoo
and Perumal, 2023). The World Health Organization
(WHO) recommends chest X-rays (CXR) for diag-
nosing TB and identifying DR-TB (World Health Or-
ganization, 2023). However, implementation of this
policy remains a challenge in resource-constrained
countries that have a notable burden of tuberculo-
sis, which increases disease transmission and drug-
resistant TB (World Health Organization, 2023).
The size, form, and location of lung lesions on
chest X-rays can be used to identify drug-resistant
tuberculosis. Mediastinal lymphadenopathy, pleural
effusions, cavities, infiltrates, collapse, and nodules
are among the uncommon features in the lung regions
that are diagnostic of DR-TB (Lv et al., 2023; W
´
ang
et al., 2018). When bacteria cause tissue degradation
in the lungs, cavities develop, while infiltrates and
nodules represent the immune response, indicating ar-
eas of active inflammation or granulomatous lesions.
Pleural effusions and mediastinal lymphadenopathy
signify disease progression, and lung collapse may
occur due to airway obstruction or chronic damage.
These overlapping features are more pronounced in
DR-TB compared to drug-sensitive TB, adding to the
diagnostic complexity (Kuang et al., 2022; Libiseller-
Egger et al., 2020). This highlights the need for
computer-assisted diagnostic methods that can auto-
mate TB screening and identify DR-TB at a relatively
low cost to facilitate early treatment (Jonathan and
Barakabitze, 2023; Karki et al., 2022).
Artificial Intelligence (AI) has become a fasci-
nating technology for the automated diagnosis of tu-
berculosis using publicly available medical images
(Jonathan et al., 2024; Liang et al., 2022). For ex-
ample, AI using deep learning methods, particularly
CNN, has shown promising results in TB diagnosis by
identifying the resistance to TB regimens from chest
X-ray images (Ureta and Shrestha, 2021). The con-
volutional neural networks have been useful for ra-
diologists to interpret results and to reduce the prob-
lems associated with false results and limited human
resources (Naidoo and Perumal, 2023).
A customized CNN and pre-trained VGG16 mod-
els were trained to determine the presence of resis-
tance to TB drugs using the CXR images from Be-
larus. The results show that the models can auto-
matically discriminate tuberculosis between DR-TB
and DS-TB (Jaeger et al., 2018). Additionally, a pre-
trained VGG16 model to predict lung drug-resistant
TB was developed using chest X-rays from Image-
CLEF2017. After validation, the authors proposed
that the model shows potential in identifying the type
of resistance to TB drugs (Meshesha et al., 2024).
Furthermore, labeled X-ray images from a TB
Portals dataset were employed to train and validate
a specialized CNN to categorize drug-resistant TB
and drug-sensitive TB. The AUC results indicate that
the classifier effectively distinguishes between DR-
TB and DS-TB, showing improvement over previ-
ous deep learning models for DR-TB identification
(Ureta and Shrestha, 2021). Researchers, on the other
hand, used CXR images from TB Portals to train a
pre-trained InceptionV3 model with image augmen-
tation to determine resistance to tuberculosis drugs.
After model evaluation, the findings suggest that the
model can be useful in detecting the occurrence of
drug-resistant TB (Karki et al., 2022).
The need for further work is widely acknowledged
to improve performance for the classification of drug-
resistant and drug-sensitive TBs (Jaeger et al., 2018;
Ureta and Shrestha, 2021; Karki et al., 2022; Meshe-
sha et al., 2024). Potentially, transformer-based deep
learning algorithms may be used to achieve this. A
recent study compared the classification performance
of CNN, residual networks (ResNet), and transform-
ers using NIH X-ray images. The study found that the
transformer model had higher classification accuracy
than the other models in diagnosing lung conditions
(Jain et al., 2024).
Transformer is a deep learning model architec-
ture that was primarily developed for natural language
processing (NLP) tasks. Several fields, such as com-
puter vision, have made use of it. Vision Transformer
(ViT) is a neural network that adapts transformer-
based model processes to accomplish computer vi-
sion tasks (Dosovitskiy, 2020). The ViT is attract-
ing interest because of its potential to outperform
CNN in computer vision problems and to enhance
performance. To maintain its usefulness, the Vi-
sion Transformer has been improved and has vari-
ous types, including the Data-Efficient Image Trans-
former (DEiT). This model type was developed to ad-
dress data efficiency and feature extraction capabili-
ties, particularly for complex medical imaging tasks
like DR-TB detection while maintaining computa-
tional costs (Jumphoo et al., 2024). Furthermore, the
DEiT is particularly effective in tasks requiring both
Enhancing Diagnostic Accuracy of Drug-Resistant Tuberculosis on Chest X-Rays Using Data-Efficient Image Transformers
185

fine-grained and global context interpretation, making
it ideal for chest X-rays of DR-TB patients.
The DEiT has been designed in such a way that
it utilizes data augmentation and distillation tech-
niques for efficient training (Singh et al., 2024). This
model analyses the input image as follows: The in-
put image is split up into fixed-size patches using the
patch embedding technique, which then simplifies the
patches to form a sequence of vector patch embed-
dings. The positional encodings process adds infor-
mation to the model about the position of each patch
within the image to make it possible to understand
patches spatial relationships (Imagawa and Shiomoto,
2024). Moreover, self-attention mechanisms ensure
each patch attends to every other patch and captures
global dependencies using the encoder-decoder struc-
ture (Sethanan et al., 2023).
For classification tasks during the training, an im-
age representation is extracted and added to the fi-
nal layer of the classifier. Then, it is passed through
a Multi-Layer Perceptron (MLP) head to be trans-
formed into the final classification output (Imagawa
and Shiomoto, 2024). The ability of the network to
capture global context and spatial relationships makes
it suitable by enhancing classification performance
more than CNN, which is local context-based (Jain
et al., 2024). The application of ViT in healthcare
using medical imaging has demonstrated a high po-
tential for accurate diagnosis of different diseases, in-
cluding Alzheimer’s, COVID-19, pneumonia, and tu-
berculosis diseases.
Contributing to the decrease in the rate of
life-threatening neurodegenerative disorders and
Alzheimer’s disease, the authors developed a novel
vision transformer model, namely DEViT. The model
was validated, and when tested on unseen data, the
evaluation results indicated that the DEViT can iden-
tify dementia with higher accuracy (Sen et al., 2024).
Additionally, an effective method for identifying
pneumonia was implemented with the help of vision
transformers and images of the chest X-ray. The
results demonstrated that the model outperformed in
detecting pneumonia from chest X-rays (Singh et al.,
2024).
Furthermore, vision transformers were employed
to create models using chest X-ray images for a
multiclass COVID-19 classification problem. Subse-
quently, it was proposed that these models can ac-
curately detect COVID-19 with high AUC perfor-
mance (Chetoui and Akhloufi, 2022). Additionally,
a ViT model, pretrained using FastViT, was fine-
tuned to screen for tuberculosis by analyzing chest
X-rays, achieving high accuracy in predicting the
tuberculosis class (Ko et al., 2024). Another ViT
model, trained on the TBX11K dataset, was used to
identify TB-related bacteria from chest X-rays. As
a result, the model demonstrated exceptional effec-
tiveness with notable diagnostic accuracy (Kotei and
Thirunavukarasu, 2024).
The studies have revealed the usefulness of vision
transformer models in addressing tuberculosis chal-
lenges (Ko et al., 2024; Kotei and Thirunavukarasu,
2024). However, there is a need to enhance the effec-
tiveness of diagnosing anti-drug TB using variations
of vision transformers. To this end, this paper in-
tends to use a DEiT, a vision transformer-based trans-
fer learning method, to locate tuberculosis resistant
to medications from chest X-ray imaging. DEiT is
particularly suitable for this task due to its ability to
handle complex CXR patterns and effectively capture
the fine-grained details and global context of the sub-
tle and overlapping features characteristic of DR-TB
(Jumphoo et al., 2024). The following are the unique
contributions to this study:
• We present a DEiT model architecture for the de-
tection of drug-resistant tuberculosis using chest
X-rays.
• We evaluate the performance of the DEiT model
using metrics such as recall, precision, F1 score,
and AUC, utilizing a CXR dataset from TB Por-
tals.
• We provide a comprehensive comparison between
the DEiT model and existing CNN approaches.
The following sections make up this paper: Sec-
tion (2) introduces the methodology we followed in
this research, Section (3) presents the analysis and
findings, Section (4) addresses the results of the study,
Section (5) provides ethical considerations, and Sec-
tion (6) concludes the paper.
2 METHODOLOGY
This section presents the ViT deep learning model for
detecting TB bacteria that have developed resistance
to standard anti-TB drugs using chest X-rays from TB
Portals. The model was trained using a pre-trained
DEiT base model, a basic vision transformer.
2.1 Dataset
This study used anonymized clinical data and
grayscale CXR images in DICOM format from the
TB Portals of the National Institute of Allergy and
Infectious Diseases (NIAID)
1
, which were collected
over a period of 10 years. These portals offer open
1
https://tbportals.niaid.nih.gov
HEALTHINF 2025 - 18th International Conference on Health Informatics
186
access to anonymized multi-domain TB data from di-
verse domains of international TB patient cases, such
as diagnosis and treatment, for analysis and to im-
prove TB research. The portals are regularly updated,
and the data was publicly available in August 2023
and extracted on December 20, 2023. Radiologists
added clinical information and radiological features
based on manual annotations, ensuring that each pa-
tient record was associated with the corresponding
CXR image.
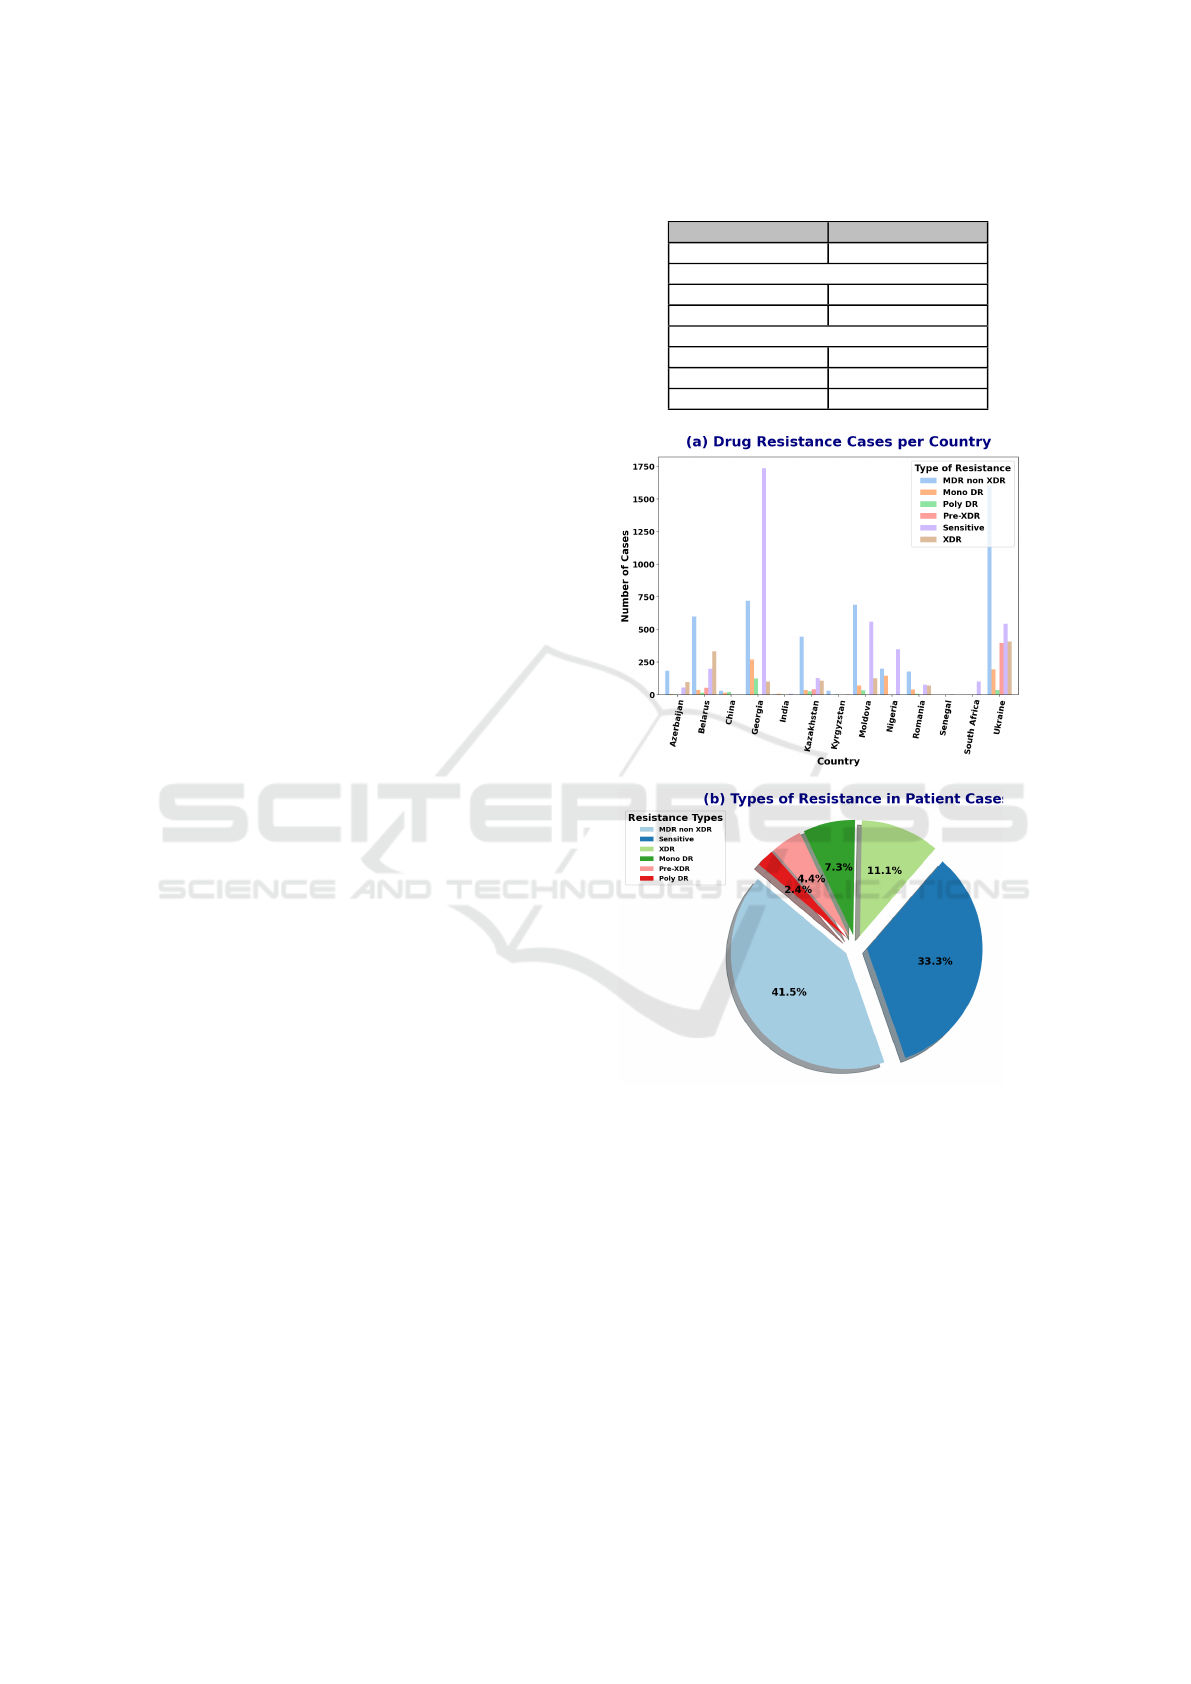
Figure (1) shows the distribution of TB drug resis-
tance cases by country and the overall proportion of
different drug resistance types. Initially, the dataset
consisted of 8,846 cases from 13 countries with a
high burden of drug-resistant TB. These cases were
classified into six categories of drug resistance, with
the MDR non-XDR category being significantly more
prevalent than the others, leading to a class imbalance.
A positive class, DR-TB, was created by combining
all cases from the resistant classes (MDR non-XDR,
XDR, Mono DR, Pre-XDR, and Poly DR) (Ureta and
Shrestha, 2021). Therefore, this study focused on an-
alyzing both resistant and sensitive class cases.
2.2 Pre-Processing
The variance of the Laplacian metric was computed to
ensure that high-quality images were used for model
performance and generalization. As a result, the study
relied on a comprehensive set of clear images, as sum-
marized in Table (1). The positive class, DR-TB, con-
tained the majority of the images, while the negative
class, DS-TB, consisted of fewer. The data were ran-
domly split into three sets: the majority were used
for training, with smaller portions allocated for vali-
dation and testing. This distribution ensures that the
model has sufficient data to learn meaningful patterns,
prevents overfitting, and provides robust generaliza-
tion to unseen data (Jaamour et al., 2023). The clear
grayscale images were transformed to RGB format,
resized to 224x224 pixels, and converted into tensors
to ensure uniform dimensions compatible with the vi-
sion transformer. The RGB values were normalized
to standardize the data, ensuring consistent mean and
standard deviation values across the dataset.
2.3 DEiT Model Training and
Development
The experiments were conducted using Python 3.9.19
and involved data augmentation techniques, such as
random horizontal flips, random vertical flips, and
random rotations (up to 20 degrees), applied to the
training dataset. The primary goal of these augmen-
Table 1: Dataset overview and split.
Category Number of Images
Total 7,961
Class Distribution
DR-TB 5,386
DS-TB 2,575
Dataset Split
Training Set 4,777
Validation Set 1,592
Testing Set 1,592
Figure 1: Distribution of TB drug resistance types across
countries and overall proportions of drug resistance types.
tations was to increase dataset diversity and prevent
overfitting, thereby improving classification perfor-
mance. No data augmentation was applied to the test
and validation datasets. The study employed the ViT
framework, specifically using the pre-trained DEiT-
B/16 model weights, which were trained on Ima-
geNet. DEiT, a type of Vision Transformer, incorpo-
rates knowledge distillation to enhance data efficiency
and training practicality, improving transformer per-
formance for image classification tasks (Jumphoo
et al., 2024). The DEiT model’s self-attention mecha-
nism overcomes the limitations of CNNs by enabling
the model to capture both local and global patterns,
Enhancing Diagnostic Accuracy of Drug-Resistant Tuberculosis on Chest X-Rays Using Data-Efficient Image Transformers
187
making it well-suited for extracting complex features
from medical images, such as DR-TB chest X-rays.
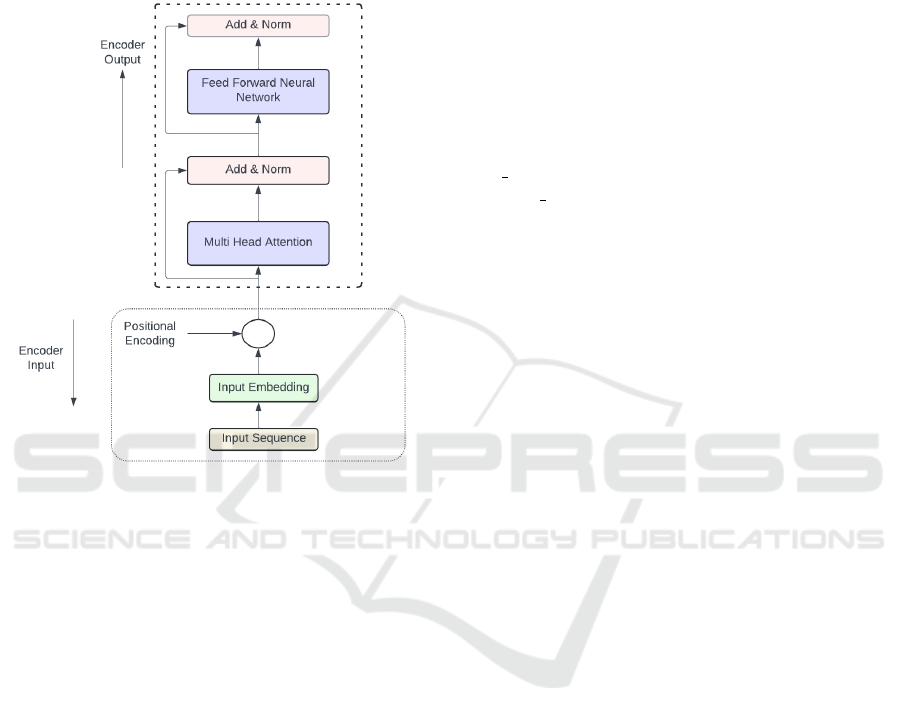
To predict a single output from a fixed set of classes,
an encoder-only model, based on the standard trans-
former encoder structure, was utilized, as shown in
Figure (2).
Figure 2: Transformer-encoder architecture.
During training the pre-trained DEiT-B/16, each
input image was first split into 16x16 non-overlapping
patches. These patches were then flattened into
single-dimensional vectors, and a sequence of patch
embeddings was produced. Afterward, the positional
embeddings were added to the sequence of patch em-
beddings to maintain the position information of each
patch. The transformer encoder receives the series of
patch embeddings, each with positional encoding, as
input and uses its layers to process the input. Multi-
head attention is one of the layers that allows a model
to perform multiple self-attention operations concur-
rently and concatenate the results. Moreover, the
Add and Norm layer plays a critical role in stabi-
lizing and improving training by combining residual
connections with layer normalization. Adding non-
linearity to the model, non-linear activation functions
are used between the fully connected layers of the
feedforward neural network (FFNN) layer. The fully
connected layers, namely MLP, contain multiple lay-
ers of neurons, which are essential to helping a model
learn complicated patterns. This training mechanism
is explained in Figure (2) and Section 2.5.
We extracted features by freezing all pre-trained
layers and training only the final layers, modifying
the classification head for binary classification with a
customized dataset. The pre-trained model was run
with a batch size of 64 for 50 epochs, shuffling the
dataset before each epoch. We used the AdamW op-
timizer with a weight decay of 1e-1 and a learning
rate of 1e-3, along with a Cosine Annealing Learning
Rate Scheduler to adjust the learning rate based on a
cosine function. The rate scheduler was used to help
the model converge more effectively with the follow-
ing parameters: T
max
= 10, η
min
= 1 × 10
−6
, which
are the maximum number of iterations for one cycle
and the minimum learning rate, respectively.
BCEWithLogitsLoss was used as the loss func-
tion for the binary classification task, combined with
pos weight to address the issue of data imbalance.
The pos weight was useful to change the weight of
positive cases in the loss calculation, allowing for
greater emphasis on that class and balancing the im-
pact of both classes on the loss. Thereafter, the train-
ing set was used to train the model, which was then
evaluated on the testing set. Early stopping was also
systematically implemented to determine the optimal
number of epochs and prevent overfitting.
2.4 DEiT Model Architecture
Only the encoder part of a typical transformer is
present in the recommended DEiT model architec-
ture. Further details regarding the process of generat-
ing the encoder input and the encoded output, which
serves as the MLP head’s input, can be found in Sec-
tion 2.3 and Figure 2. The MLP head processes the
output of the transformer encoder to produce the final
classification prediction. Given that the study used
the pre-trained weights of DEiT, only modifications
to the classification head for binary classification us-
ing the custom dataset were made, and the layers not
to be fine-tuned were frozen.
This architecture consists of two fully connected
linear layers. The first layer takes the input features
from the output of the transformer encoder and maps
them to 64 units (hidden layer), reducing the dimen-
sionality to 64 features. The ReLU activation function
is applied to introduce non-linearity, which enhances
the model’s learning capabilities and adaptability in
the classification head. Dropout is applied to reduce
overfitting by randomly deactivating neurons during
training, helping to improve generalization. The sec-
ond linear layer projects the 64 features to a single
output for binary classification. The BCEWithLogit-
sLoss is used, which combines the sigmoid activation
and binary cross-entropy loss with a positive weight
adjustment, addressing data imbalance. Figure (3) il-
lustrates the complete architecture of the DEiT model.
HEALTHINF 2025 - 18th International Conference on Health Informatics
188
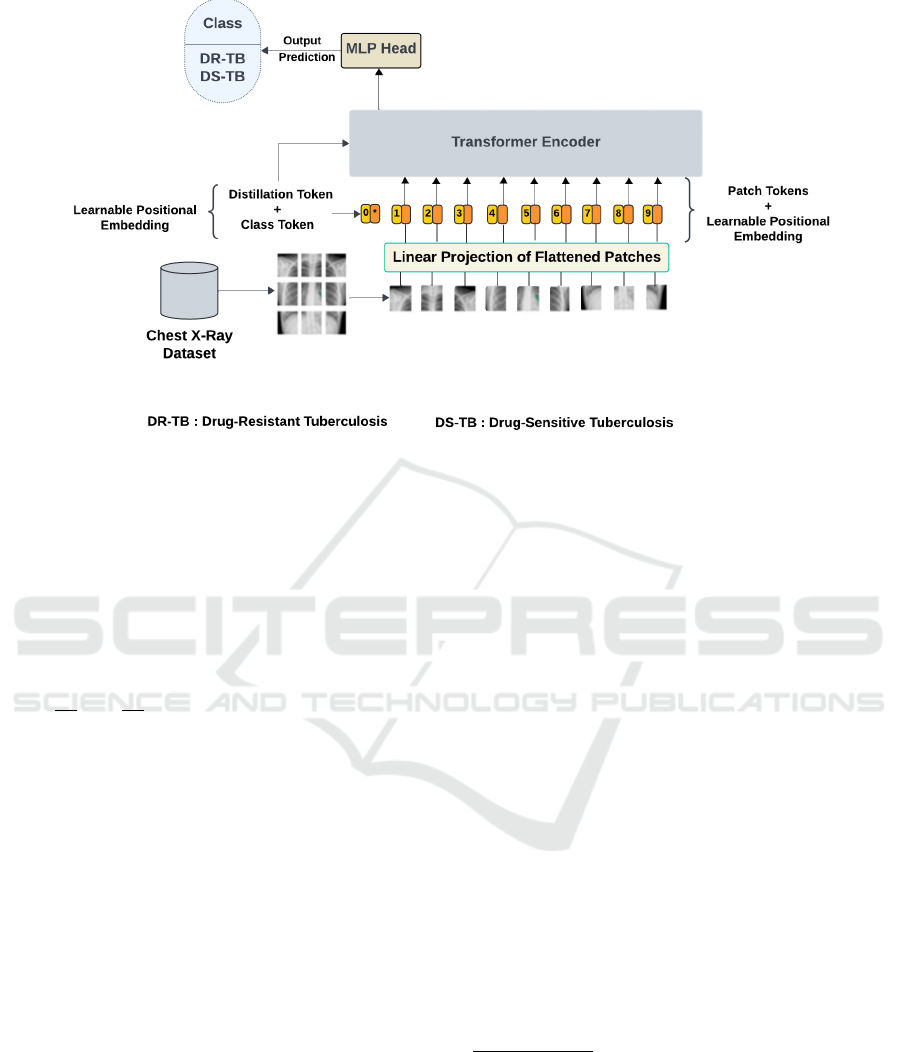
Figure 3: DEiT model architecture for detecting drug-resistant tuberculosis using chest X-rays.
2.5 DEiT Theoretical Framework
This section outlines the key mathematical concepts
behind DEiT, enabling efficient image processing and
analysis by capturing complex relationships and pat-
terns within the input images. The patch embed-
ding process transforms an input image with dimen-
sions 224 × 224 × 3 by partitioning it into patches
that are independent of size 16 × 16. This leads to
N =
224
16
×
224
16
= 14 × 14 = 196 patches, where
the height, width, and number of channels are rep-
resented by the dimensions 224, 224, and 3, respec-
tively. After being flattened into a 1D vector, each of
the 196 patches containing 16 × 16 × 3 = 768 pixel
values has a vector size of 768. A learnable lin-
ear transformation is then used to project these patch
vectors onto a lower-dimensional space, mapping the
768-dimensional patch vector to a d-dimensional vec-
tor of size 512. The transformer’s dimensionality re-
duction improves the model’s efficiency while also
lowering computational costs and memory usage. Af-
ter projection, we obtain a sequence of 196 patch vec-
tors, each with a dimension of 512. These vectors col-
lectively form a matrix X with dimensions 196 × 512
(i.e., N × d). The output of the matrix can be repre-
sented as:
X = [x
1
, x
2
, . . . , x
N
] X ∈ R
N×d
(1)
Then, a distinct class token, denoted as x
cls
∈ R
d
,
is added at the beginning of the sequence of patch em-
beddings, mainly for classification in the output layer.
The updated input sequence is as follows:
X
′
= [x
cls
, x
1
, x
2
, . . . , x
N
] X
′
∈ R
(N+1)×d
(2)
Subsequently, positional encodings (PE) are in-
corporated into the sequence of patch embeddings to
provide spatial information. The input to the trans-
former after adding positional encodings is:
Z
0
= X
′
+ PE (3)
Later, Multi-Head Self-Attention (MHSA
2
) en-
ables the model to utilize multiple heads to cap-
ture various relationships between patches. The self-
attention mechanism calculates the attention scores
for every pair of patch vectors, Xi.
The learned linear projections are then used to
convert each patch vector X
i
into Query (Q)
3
, Key
(K)
4
, and Value (V)
5
. The dot product of the query
and key vectors is then used to measure the attention
scores between patches. The attention scores are then
normalized using a softmax function to ensure that
they total up to 1. Finally, the output representation of
each patch is computed as a weighted sum of the value
vectors from all patches using the attention weights.
In terms of mathematics, it is expressed as:
Output(i) =
N
∑
j=1
Attention Weights(i, j)·V
j
(4)
2
MHSA enhances the self-attention mechanism by in-
troducing multiple independent attention heads that each
focus on different aspects or relationships within the input
data.
3
Q refers to the input for which the model is intended to
extract relevant information.
4
K represents the possible attributes or data that can be
handled.
5
V indicates the actual information utilized in the out-
put, determined by the attention scores.
Enhancing Diagnostic Accuracy of Drug-Resistant Tuberculosis on Chest X-Rays Using Data-Efficient Image Transformers
189

This mechanism allows self-attention to dynamically
adjust which patches influence each other based on
their content, thereby capturing dependencies be-
tween patches.
Following the self-attention block, the output is
processed by a feed-forward neural network, referred
to as the MLP block, which consists of two layers and
incorporates a GELU non-linearity function:
MLP(x) = GELU(xW
1
+ b
1
)W
2
+ b
2
(5)
Here, W
1
and W
2
are the weight matrices, while b
1
and b
2
are the bias vectors for the layers.
Non-linearity is applied to help the model capture
more complex relationships and patterns in the data
through feedforward neural networks and enhance
performance. Each block incorporates layer normal-
ization
6
for stabilizing and enhancing the training
process before both the MHSA and MLP
7
. After each
sub-layer, a residual connection is applied, adding the
input to the output.
In the attention sub-layer, this is formulated as:
Z
′
= LayerNorm(Z
0
+ MultiHead(Q, K, V ))
In the case of the MLP sub-layer:
Z
out
= LayerNorm(Z
′
+ MLP(Z
′
))
At the end of the transformer layers, the class to-
ken, which has been processed through the attention
and feed-forward layers, is input into a linear layer to
predict class probabilities. This linear transformation
of the class token produces the final output:
output = softmax(W
cls
x
cls
) (6)
Where W
cls
is a weight matrix that has been learned to
transform the final class token into the class space.
3 RESULTS AND ANALYSIS
This section presents and analyzes the results ob-
tained from the DEiT model for binary classification.
We first assess the model’s performance using met-
rics, followed by its significance test.
6
Layer normalization stabilizes and enhances the train-
ing process by maintaining the mean and variance of feature
distributions, resulting in faster convergence and improved
performance.
7
MLP improves transformer capabilities by enabling
powerful feature transformations, non-linear mapping, and
essential architectural components.
3.1 DEiT Model Classification
Performance
After training and validating the DEiT model for the
classification of DR-TB and DS-TB on the training
and validation sets. We subjected the model to the
unseen data to evaluate the results. This study used
recall, precision, F1-score, and AUC scores to mea-
sure the model classification performance when deal-
ing with imbalanced data. Table (2) shows the met-
ric results of the model when evaluated on the unseen
data. Comparative results of different deep learning
models with the DEiT are summarized in Table (3).
Table 2: Classification performance of the DEiT model.
to force placement
Our model Recall Precision F1 Score AUC
DEiT 82.8% 82.6% 82.7% 80%
In medical diagnosis, particularly when dealing
with imbalanced data, recall plays a critical role in en-
suring that true positive cases are identified, as miss-
ing these cases can have serious consequences. For
this study, detecting drug-resistant tuberculosis as the
target class was prioritised. As shown in Table (2), the
model demonstrates strong performance in recall, ef-
fectively identifying a large portion of actual DR-TB
cases. Furthermore, precision is vital for evaluating
the reliability of positive predictions guaranteeing that
the detected cases of drug-resistant tuberculosis are
accurate. The results confirm that the model achieves
a balance between detecting DR-TB and minimising
false positives. Previous work, such as (Ureta and
Shrestha, 2021), highlights the importance of preci-
sion for addressing class imbalance and improving the
identification of drug-resistant tuberculosis, which is
resistant to standard treatments.
In addition, to balance the identification of posi-
tive cases (recall) and maintain the accuracy of pos-
itive predictions (precision), the F1 score was used
as a unified metric to assess this trade-off. The re-
sults demonstrate that the model achieves an optimal
balance between recall and precision, which makes
it effective in distinguishing between drug-resistant
TB and drug-sensitive TB. Previous studies (Scholz
et al., 2024) have shown that the F1 score is particu-
larly reliable for binary classification tasks with class
imbalance, as observed in this study. Furthermore,
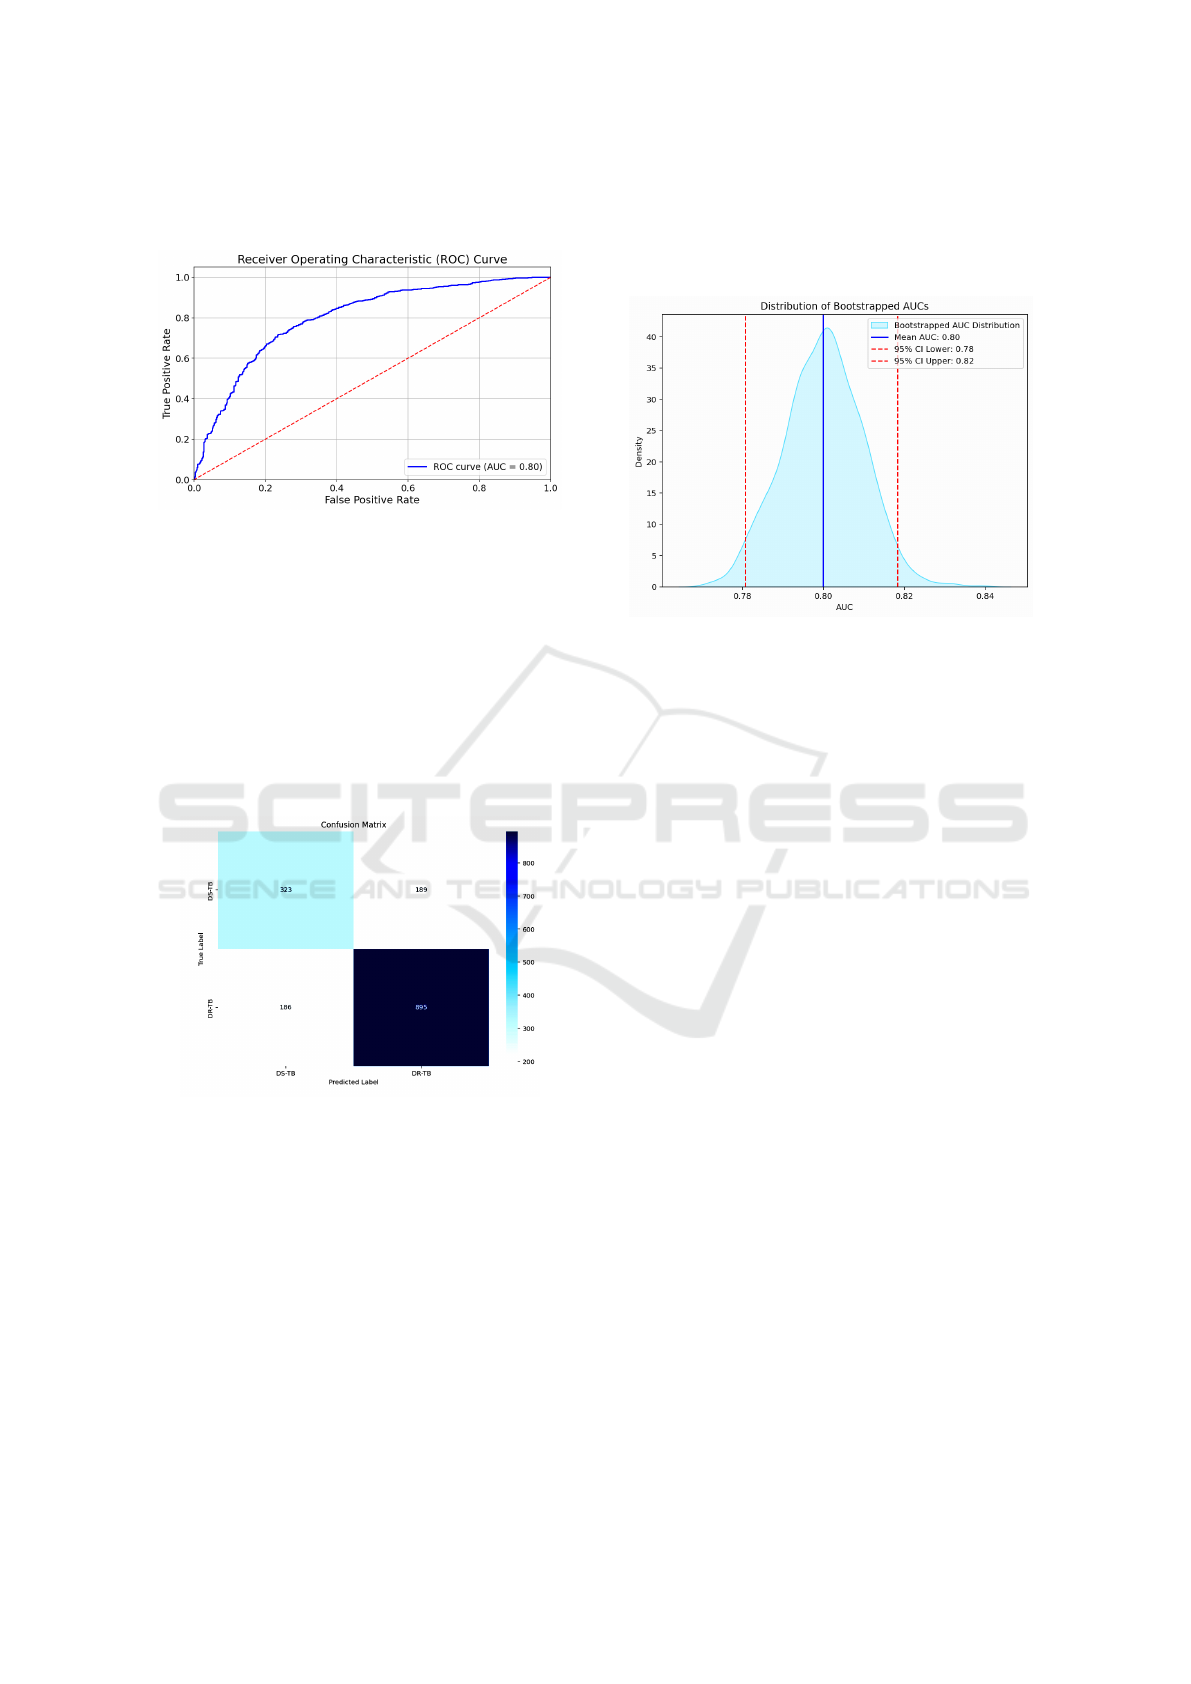
the model exhibits strong performance in terms of the
area under the curve (AUC), successfully differenti-
ating DR-TB from DS-TB across various threshold
settings. As illustrated in Figure (4), the AUC score
highlights the model’s superior accuracy compared to
HEALTHINF 2025 - 18th International Conference on Health Informatics
190
other deep learning approaches reported in related re-
search (Singh et al., 2024).
Figure 4: ROC curve showing the AUC of the DEiT model.
The confusion matrix in Figure (5) demonstrates
the classification performance of the DEiT model.
The model identifies a large majority of drug-resistant
TB and drug-sensitive TB cases, with relatively low
misclassification rates. This performance translates
into a test accuracy of 76.5%. Compared to the pre-
trained VGG16 model, which achieved an accuracy
of 64%, our DEiT model shows a significant im-
provement in classification accuracy (Meshesha et al.,
2024).
Figure 5: Confusion matrix derived from the test data for
the DEiT model.
3.2 Bootstrap Significance Test
We applied the bootstrap significance test to estimate
the confidence interval (CI) of the AUC for the DEiT
model. This interval helps assess whether the per-
formance difference in AUCs between our model and
existing models is statistically significant. Using the
bootstrap algorithm (Noma et al., 2021), the test data
were randomly resampled with replacement, and the
AUC for each resampled dataset was computed. The
average AUC, along with the 2.5 and 97.5 percentiles
of the AUC distribution, was then calculated. Figure
(6) shows that the model achieved a mean AUC, and
the confidence interval suggests that with 95% confi-
dence, the true AUC of the model lies within a certain
range.
Figure 6: The AUC distribution of the DEiT model high-
lights its performance and robustness across different data
subsets.
4 DISCUSSION
To evaluate the performance of the DEiT model, we
compared our results with those from other studies
that used chest X-ray images from TB Portals and
Belarus for deep learning-based classification. Table
(3) presents this comparison. A customized CNN and
a pre-trained VGG16 model were developed to dis-
tinguish between drug-sensitive and drug-resistant tu-
berculosis using the Belarusian dataset. These models
achieved lower classification performance compared
to our DEiT model, which can be attributed to the lim-
ited dataset size, which likely impacted their ability to
generalize effectively to unseen data.
Additionally, a specialized CNN model was cre-
ated using a dataset from TB Portals, achieving no-
table performance in distinguishing between drug-
resistant and drug-sensitive tuberculosis (Ureta and
Shrestha, 2021). The use of data augmentation tech-
niques enhanced the model’s performance by generat-
ing synthetic variations of the existing data. Similarly,
a pre-trained InceptionV3 model was fine-tuned using
a larger dataset of chest X-rays, which demonstrated
improved performance in classifying DR-TB and DS-
TB after evaluation (Karki et al., 2022).
When comparing the performance of the DEiT
model to existing deep learning models for classify-
ing tuberculosis as drug-resistant or drug-sensitive,
the DEiT model showed significant improvement.
As illustrated in Figure (6), the confidence interval
for the DEiT model’s performance does not overlap
Enhancing Diagnostic Accuracy of Drug-Resistant Tuberculosis on Chest X-Rays Using Data-Efficient Image Transformers
191

Table 3: Comparison of classification performance across different models.
to force placement
Authors Dataset Images Method AUC
Jaeger et al. (2018) Belarus 135
Customized CNN 62%
Pre-trained VGG16 57%
Ureta and Shrestha
(2021)
TB Portals 2,973 Specialized CNN 66% - 67%
Karki et al. (2022) TB Portals 3,642 Pre-trained InceptionV3 66%
Our model TB Portals 7,961 Pre-trained DEiT 80%
with those of previous models, indicating a statisti-
cally significant difference. DEiT’s capacity to effi-
ciently capture intricate chest X-ray patterns, espe-
cially the subtle and overlapping characteristics of
drug-resistant tuberculosis, is responsible for this im-
provement. In order to overcome the difficulties in
precisely identifying drug-resistant tuberculosis, the
model’s self-attention mechanism allows it to concen-
trate on minute features as well as the larger environ-
ment.
5 ETHICAL CONSIDERATIONS
The University of Plymouth Faculty of Sci-
ence and Engineering Research Ethics and In-
tegrity Committee (IRAS ID 5029), Medical
Research Coordinating Committee of Tanzania
(NIMR/HQ/R.8a/Vol.1X/4645), and Tanzania Mis-
sion for Science and Technology authorized the study
(CST00000774-2024-2024-00781). The National
Institute of Allergy and Infectious Diseases (NIAID)
TB Portals approved the use of TB Portal data
(B92A8156-AD1A-4035-9DA5-E8C09F755F).
6 CONCLUSIONS
This study investigates a DEiT model along with its
architecture to discriminate drug-resistant TB from
drug-sensitive TB using the CXR from the TB Por-
tal. In pre-processing, we used methods including re-
sizing, normalization, and the variance of the Lapla-
cian metric to obtain the required format and im-
prove the quality of the data. To prevent the model
from overfitting and increase diversity in the train-
ing data, data augmentation techniques, such as hor-
izontal flipping, vertical flipping, and rotation, were
utilised. The model was trained, validated, and tested
with the customised preprocessed dataset, demon-
strating strong performance across various evaluation
metrics, including recall, precision, F1 score, and
AUC. This demonstrates the ability of the model to
effectively address the challenges of DR-TB detec-
tion by uncovering complex patterns in chest X-rays.
Ultimately distinguishing between drug-resistant and
drug-sensitive tuberculosis.
In our work, the DEiT model surpasses exist-
ing deep learning models, such as customized CNN,
VGG-16, and InceptionV3, in terms of AUC. The ex-
perimental results show a significant improvement in
classification performance, with a statistically signif-
icant difference. This model shows promise in as-
sisting radiologists in interpreting results in regions
with limited resources and a high prevalence of drug-
resistant tuberculosis. For future work, we anticipate
focusing on the interpretability of the classification re-
sults with the additional radiological features to pro-
vide more insights into the performance of the model.
Shapley Additive exPlanations (SHAP) will be used
to determine the extent to which every feature con-
tributes to the model output. Moreover, we will train
the model with a balanced class dataset to address the
challenge of an imbalanced dataset.
REFERENCES
Chetoui, M. and Akhloufi, M. A. (2022). Explainable vi-
sion transformers and radiomics for covid-19 detec-
tion in chest x-rays. Journal of Clinical Medicine,
11(11):3013.
Dosovitskiy, A. (2020). An image is worth 16x16 words:
Transformers for image recognition at scale. arXiv
preprint arXiv:2010.11929.
Ereso, B. M., Sagbakken, M., Gradmann, C., and Yimer,
S. A. (2023). Total delay and associated factors
HEALTHINF 2025 - 18th International Conference on Health Informatics
192

among tuberculosis patients in jimma zone, southwest
ethiopia. PLoS One, 18(2):e0281546.
Imagawa, K. and Shiomoto, K. (2024). Evaluation of effec-
tiveness of pre-training method in chest x-ray imag-
ing using vision transformer. Computer Methods in
Biomechanics and Biomedical Engineering: Imaging
& Visualization, 12(1):2345823.
Jaamour, A., Myles, C., Patel, A., Chen, S., McMil-
lan, L., and Harris-Birtill, D. (2023). A divide and
conquer approach to maximise deep learning mam-
mography classification accuracies. PLOS ONE,
18(5):e0280841.
Jaeger, S., Juarez-Espinosa, O. H., Candemir, S., Poostchi,
M., Yang, F., Kim, L., and Thoma, G. (2018). Detect-
ing drug-resistant tuberculosis in chest radiographs.
International Journal of Computer Assisted Radiology
and Surgery, 13:1915–1925.
Jain, A., Bhardwaj, A., Murali, K., and Surani, I. (2024).
A comparative study of cnn, resnet, and vision trans-
formers for multi-classification of chest diseases.
arXiv preprint.
Jonathan, J. and Barakabitze, A. (2023). Ml technologies
for diagnosing and treatment of tuberculosis: a survey.
Health and Technology, 13(1):17–33.
Jonathan, J., Barakabitze, A., Fast, C., and Cox, C. (2024).
Machine learning for prediction of tuberculosis de-
tection: Case study of trained african giant pouched
rats. Online Journal of Public Health Informatics,
16:e50771.
Jumphoo, T., Phapatanaburi, K., Pathonsuwan, W., An-
chuen, P., Uthansakul, M., and Uthansakul, P.
(2024). Exploiting data-efficient image transformer-
based transfer learning for valvular heart diseases de-
tection. IEEE Access.
Karki, M., Kantipudi, K., Yang, F., Yu, H., Wang, Y. X. J.,
Yaniv, Z., and Jaeger, S. (2022). Generalization chal-
lenges in drug-resistant tuberculosis detection from
chest x-rays. Diagnostics, 12(1):188.
Ko, J., Park, S., and Woo, H. G. (2024). Optimization
of vision transformer-based detection of lung diseases
from chest x-ray images. BMC Medical Informatics
and Decision Making, 24(1):191.
Kotei, E. and Thirunavukarasu, R. (2024). Tuberculosis de-
tection from chest x-ray image modalities based on
transformer and convolutional neural network. IEEE
Access.
Kuang, X., Wang, F., Hernandez, K. M., Zhang, Z., and
Grossman, R. L. (2022). Accurate and rapid predic-
tion of tuberculosis drug resistance from genome se-
quence data using traditional machine learning algo-
rithms and cnn. Scientific Reports, 12(1):2427.
Liang, S., Ma, J., Wang, G., Shao, J., Li, J., Deng, H.,
and Li, W. (2022). The application of artificial in-
telligence in the diagnosis and drug resistance predic-
tion of pulmonary tuberculosis. Frontiers in Medicine,
9:935080.
Libiseller-Egger, J., Phelan, J., Campino, S., Mohareb, F.,
and Clark, T. G. (2020). Robust detection of point
mutations involved in multidrug-resistant mycobac-
terium tuberculosis in the presence of co-occurrent
resistance markers. PLOS Computational Biology,
16(12):e1008518.
Lv, X., Li, Y., Cai, B., He, W., Wang, R., Chen, M., Pan, J.,
and Hou, D. (2023). Utility of machine learning and
radiomics based on cavity for predicting the therapeu-
tic response of mdr-tb. Infection and Drug Resistance,
pages 6893–6904.
Meshesha, A., Abeba, G., Getnet, S., and Sreenivas, N.
(2024). Lung tuberculosis detection using chest x-
ray images based on deep learning approach. Interna-
tional Journal of Computer Applications, 975:8887.
Mnyambo, J. J. and Barakabitze, A. (2023). A smarttb:
An integrated digital patient-centric tool for promot-
ing adherence to treatment among people living with
tb in tanzania. East African Journal of Science, Tech-
nology and Innovation, 4.
Naidoo, K. and Perumal, R. (2023). Advances in tubercu-
losis control during the past decade. The Lancet Res-
piratory Medicine, 11(4):311–313.
Noma, H., Matsushima, Y., and Ishii, R. (2021). Confidence
interval for the AUC of SROC curve and some re-
lated methods using bootstrap for meta-analysis of di-
agnostic accuracy studies. Communications in Statis-
tics: Case Studies, Data Analysis and Applications,
7(3):344–358.
Sachan, R. S. K., Mistry, V., Dholaria, M., Rana, A., Dev-
gon, I., Ali, I., and Karnwal, A. (2023). Overcoming
mycobacterium tuberculosis drug resistance: novel
medications and repositioning strategies. ACS Omega,
8(36):32244–32257.
Scholz, D., Erdur, A. C., Buchner, J. A., Peeken, J. C.,
Rueckert, D., and Wiestler, B. (2024). Imbalance-
aware loss functions improve medical image classifi-
cation. In Medical Imaging with Deep Learning.
Sen, A., Roy, S., Debnath, A., Jha, G., and Ghosh,
R. (2024). De-vit: State-of-the-art vision trans-
former model for early detection of alzheimer’s dis-
ease. In 2024 National Conference on Communica-
tions (NCC), pages 1–6. IEEE.
Sethanan, K., Pitakaso, R., Srichok, T., Khonjun, S., Weer-
ayuth, N., Prasitpuriprecha, C., and Nanthasamroeng,
N. (2023). Computer-aided diagnosis using embedded
ensemble deep learning for multiclass drug-resistant
tuberculosis classification. Frontiers in Medicine, 10.
Silva, B. P. M. D., Almeida, A. S. D., S
´
ergio, M. G.
D. M., Gatto, T. C., Carasek, V. P., and Yamamura,
M. (2023). Drug-resistant tuberculosis and covid-
19: A scoping review on a new threat to antimicro-
bial resistance. Revista Brasileira de Enfermagem,
76:e20220803.
Singh, S., Kumar, M., Kumar, A., Verma, B. K., Abhishek,
K., and Selvarajan, S. (2024). Efficient pneumonia
detection using vision transformers on chest x-rays.
Scientific Reports, 14(1):2487.
Ureta, J. and Shrestha, A. (2021). Identifying drug-resistant
tuberculosis from chest x-ray images using a simple
convolutional neural network. In Journal of Physics:
Conference Series, volume 2071, page 012001. IOP
Publishing.
Vats, S., Sharma, V., Singh, K., Katti, A., Ariffin, M. M.,
Ahmad, M. N., and Salahshour, S. (2024). Incremen-
Enhancing Diagnostic Accuracy of Drug-Resistant Tuberculosis on Chest X-Rays Using Data-Efficient Image Transformers
193

tal learning-based cascaded model for detection and
localization of tuberculosis from chest x-ray images.
Expert Systems with Applications, 238:122129.
World Health Organization (2023). Global tuberculosis re-
port. Published by the World Health Organization.
W
´
ang, Y., Chung, M., Skrahin, A., Rosenthal, A.,
Gabrielian, A., and Tartakovsky, M. (2018). Radi-
ological signs associated with pulmonary multi-drug
resistant tuberculosis: an analysis of published evi-
dence. Quantitative Imaging in Medicine and Surgery,
8(2):161.
Yang, F., Yu, H., Kantipudi, K., Karki, M., Kassim, Y. M.,
Rosenthal, A., and Jaeger, S. (2022). Differentiating
between drug-sensitive and drug-resistant tuberculo-
sis with machine learning for clinical and radiologi-
cal features. Quantitative Imaging in Medicine and
Surgery, 12(1):675.
HEALTHINF 2025 - 18th International Conference on Health Informatics
194
