
Comparative Analysis of Simulated Annealing and Particle Swarm
Optimization for Multi-Robot Task Allocation in ROS
Dhruv Kumar Sharma
a
, Ujjwal Singh
b
, Snehal Nalawade
c
and Pratik Shah
d
Indian Institute of Information Technology Vadodara, Gujarat, India
Keywords:
Multi-Robot System, Garbage Cleaning, Task Scheduling Algorithms, ROS2, Gazebo, Simulated Annealing,
Particle Swarm Optimization.
Abstract:
A comparative analysis of two prominent optimization techniques—simulated annealing (SA) and particle
swarm optimization (PSO)—is conducted within the framework of multi-robot systems (MRS). The research
investigates how each algorithm effectively allocates tasks among multiple robots, focusing on performance
metrics, convergence speed, and robustness in dynamic environments. Through extensive simulations in ROS,
utilizing a dedicated testbed for real-world scenario emulation, distinct advantages and limitations of both
algorithms are revealed across various setups. The testbed integrates realistic garbage generation, dynamic
obstacles, and robot interactions, allowing for detailed empirical evaluations. The study highlights the practical
implications of using SA and PSO for multi-robot coordination, laying the groundwork for future research on
hybrid approaches and algorithmic enhancements in complex robotic applications.
1 INTRODUCTION
In recent years, the integration of multi-robot systems
has gained significant attention due to their potential
to execute complex tasks more efficiently than single-
robot counterparts. These systems leverage the col-
laborative capabilities of multiple robots to achieve
objectives that would be infeasible for a single entity,
thereby enhancing both robustness and scalability.
Latest studies have focused on multi-robot task
allocation strategies in uncertain environments for
cleaning. (Wang et al., 2023) developed a robust
optimization model using mixed-integer linear pro-
gramming, comparing techniques like simulated an-
nealing, genetic algorithms, particle swarm optimiza-
tion, and deep reinforcement learning (DRL) for task
distribution. (Jeon et al., 2015) studied the realloca-
tion strategies for tasks. Performance Maximization
was considered the most effective strategy to achieve
cleanliness and efficiency. (Orr and Dutta, 2023) sur-
veyed Applications of Multi-Agent DRL, which in-
clude GNNs, attention mechanisms and simulators
for path planning as well as task allocation. (Le et al.,
a
https://orcid.org/0009-0007-8928-6947
b
https://orcid.org/0009-0001-4828-3834
c
https://orcid.org/0009-0002-6325-7201
d
https://orcid.org/0000-0002-4558-6071
2020), and (Le et al., 2018) focused task assignment
and reallocation task with efficiency and obstacle han-
dling. The work of (Hong et al., 2021) introduced task
reassignment efficiency under constraints when using
replicator dynamics. (Elfakharany and Ismail, 2021)
proposed decentralized task allocation under end-to-
end DRL, optimizing coordination in the unstructured
environment. (Park et al., 2022) demonstrated real-
time cooperative task allocation using reinforcement
learning, improving adaptability and performance.
While most research on multi-robot systems has
focused on coverage path planning or task alloca-
tion, this paper presents an efficient algorithm for task
allocation and scheduling in a multi-robot cleaning
system. By leveraging the modular architecture of
the Robot Operating System (ROS), we enable syn-
chronized communication and coordination, enhanc-
ing overall system performance.
Our study highlights the potential of ROS-based
multi-robot systems utilizing either SA or PSO to im-
prove efficiency and reliability. Comprehensive simu-
lations compare the performance of these algorithms,
demonstrating their effectiveness and applicability to
real-world scenarios.
Sharma, D. K., Singh, U., Nalawade, S. and Shah, P.
Comparative Analysis of Simulated Annealing and Particle Swarm Optimization for Multi-Robot Task Allocation in ROS.
DOI: 10.5220/0013192000003890
In Proceedings of the 17th International Conference on Agents and Artificial Intelligence (ICAART 2025) - Volume 1, pages 481-488
ISBN: 978-989-758-737-5; ISSN: 2184-433X
Copyright © 2025 by Paper published under CC license (CC BY-NC-ND 4.0)
481

2 PROBLEM STATEMENT
We designed a multi-robot cleaning system for large
areas, featuring drones for image capture, ground
cleaning robots, and a central control system coordi-
nating all operations. Drones, equipped with sensors,
send environmental data to the central system, which
updates a map and dynamically assigns cleaning tasks
based on real-time garbage and obstacle detection.
We developed a testbed to evaluate robot con-
figurations, task allocation, and scheduling strategies
in realistic scenarios. It includes a garbage genera-
tion routine and uses ROS2 for robot control. The
slam toolbox (Macenski, 2019), (Macenski and Jam-
brecic, 2021) package handles dynamic obstacle de-
tection, while nav2 (Macenski et al., 2020) ensures
efficient navigation. Simulations are conducted in
Gazebo for realistic and flexible testing.
2.1 Problem Formulation
In a large public area with randomly generated
garbage and obstacles such as vehicles and pedestri-
ans, the goal is to ensure continuous cleaning while
optimizing robot utilization. The area is represented
as an environment map—a numerical matrix encod-
ing objects and conditions—to facilitate algorithmic
processing.
The system employs N cleaning robots, M drones,
and a central management unit. Drones survey the
area at set altitudes, capturing ground images and
transmitting them to the central unit. A YOLOv8
model, trained on the area, processes these images
to identify garbage and obstacles, updating the envi-
ronment map accordingly. This map informs a task
scheduling algorithm that assigns cleaning tasks to
robots, optimizing their movement across regions and
dynamically adjusting to changes in garbage distribu-
tion. Task schedules are communicated to robots via
the central unit, which continuously monitors and up-
dates the map, reassigning tasks as needed.
Key variables:
• N → Total number of robots
• K → Total number of tasks
• n
r
→ Number of tasks allocated to robot r
• P → Precedence adjacency list; where P
r
repre-
sents a list of tasks assigned to robot r, and task
P
ri
precedes P
r j
∀ i < j
• D → Distance matrix. A K × K matrix containing
distances between tasks.
• litter[i] → Amount of litter present at task i
• l
r
→ Total litter collected by robot r after task al-
location
• t
r
→ Time taken by robot r to complete its as-
signed tasks
• L
r
→ Litter capacity of robot r
• T
r
→ Time capacity of robot r
• α → Litter penalty constant
• β → Time penalty constant
• C
r
→ Cost associated with robot r after task allo-
cation
System performance is evaluated by the ability to
maintain cleanliness, with robots efficiently covering
regions and removing garbage to ensure optimal area
cleanliness. The objective is to minimize the aver-
age waiting time, reducing the mean interval between
garbage accumulation and its removal.
2.2 Constraints
Several constraints are taken into consideration while
devising the task assignment & scheduling algorithm.
1. The robot’s battery level (time remaining) is
checked before assigning new tasks to ensure suf-
ficient charge.
2. The robot’s garbage load (current dump) is
monitored, and it is directed to the dumping
ground if the load approaches the tank’s capac-
ity (dump capacity) before resuming collection
tasks.
3. Both robots and the central system are informed
of the locations of charging stations and dumping
grounds.
All the constraints and objective functions in-
volved are as follows:
l
r
=
n
r
∑
i=1
litter[P
ri
] (1)
Equation (1) determines the total amount of litter col-
lected by robot r following the task allocation process.
The tasks assigned to the robot are retrieved from the
Precedence list P
r
, and the litter corresponding to each
task is accessed from litter[P
ri
]. This is then summed
across all tasks to yield the total litter collected by
robot r.
t
r
=
n
r
∑
i=1
D[P
r(i−1)
][P
ri
]
s
+ litter[P
ri
] ×t
(2)
Equation (2) calculates the time taken by robot r
to complete its assigned tasks. The time includes
ICAART 2025 - 17th International Conference on Agents and Artificial Intelligence
482
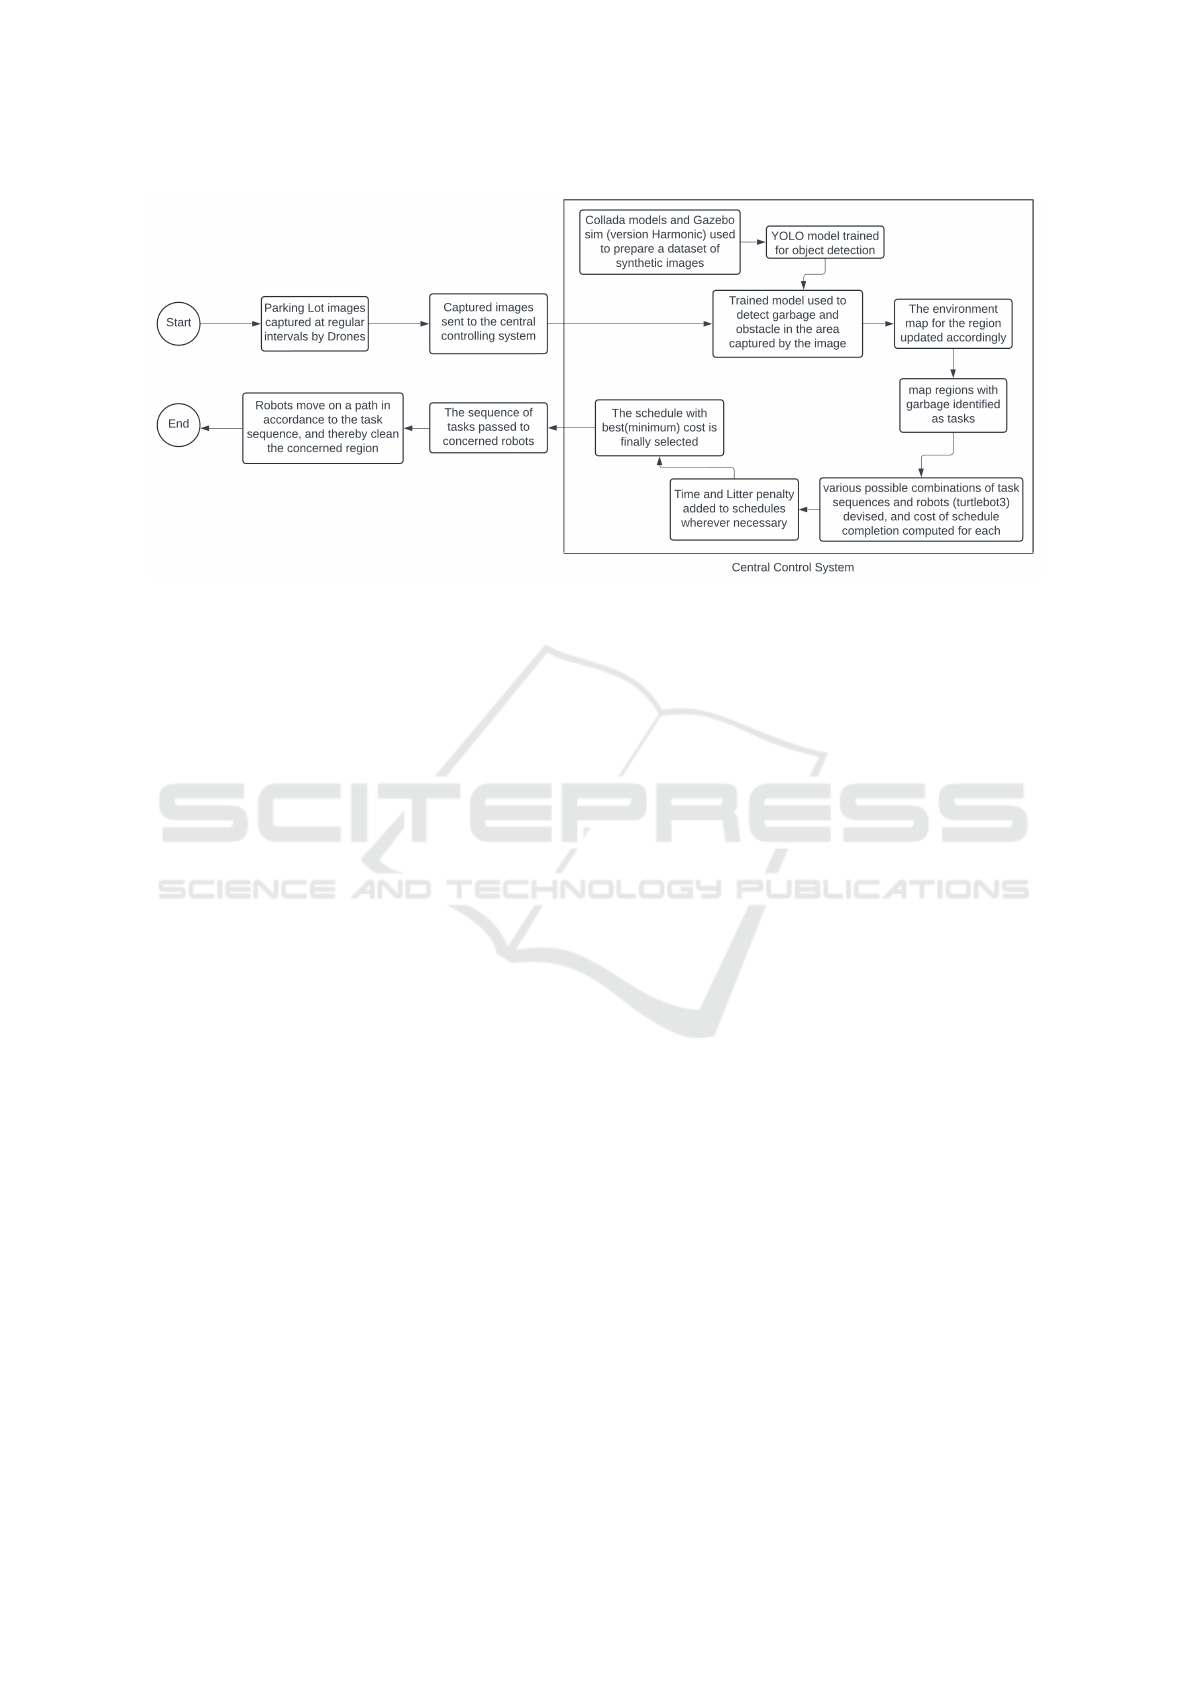
Figure 1: Multi-Robot garbage detection & task allocation system: The termination conditions for the algorithm includes
completion of all tasks, i.e. the algorithm terminates when all garbage and obstacle tasks in the mapped region are assigned
and completed by the robots as per the computed optimal schedule.
both the travel time from task P
r(i−1)
to task P
ri
and the time required to clean the litter at task P
ri
.
D[P
r(i−1)
][P
ri
] represents the distance between the two
tasks, and s is the speed of the robot. litter[P
ri
] rep-
resents the amount of litter present at task P
ri
, and t
represents the time required to clean unit litter.
C
r
= t
r
+ max(0,α × (l
r
− L
r
))
+max(0,β× (t
r
− T
r
))
(3)
Equation (3) calculates the total cost associated with
robot r after task allocation. The cost includes the
time taken to complete the tasks, the litter penalty (if
applicable), and the time penalty (if applicable). This
cost function is critical in evaluating the efficiency of
each robot.
C
max
≥ t
r
+ max(0,α × (l
r
− L
r
))
+max(0,β× (t
r
− T
r
))
(4)
Equation (4) determines the maximum cost C
max
among all robots. It represents the worst-case sce-
nario in terms of task allocation and is essential for
identifying bottlenecks in the system.
min
x∈X
C
max
(x) (5)
Finally, The goal of the optimization process is to
minimize the maximum cost C
max
among all robots.
By achieving this, the system ensures that tasks are
allocated in a manner that optimizes the overall per-
formance, leading to the best possible outcome.
3 ENVIRONMENT-AGENT
FORMULATION
The environment is represented by a matrix A with
values a
i j
∈ {0,1,2}, where 0 denotes a clean region,
1 denotes waste, and 2 indicates an obstruction.
The cost-function-driven task scheduler assigns
tasks according to the current map and robot state
in real time, ensuring efficiency. After that, robots
clean the designated regions, and constant updates
on robot conditions and environmental factors ensure
seamless operations. This well-coordinated strategy,
which combines robots to carry out tasks and drones
to gather data, guarantees an effective cleaning proce-
dure.
On a testbed, environment photos were manu-
ally labeled on the Roboflow platform and divided
into training, testing, and validation sets to create the
dataset used to train the YOLOv8 garbage detection
model. Because of its excellent garbage detection ac-
curacy, the trained YOLOv8 model is an essential part
of our system.
A cost optimization function is critical in task
scheduling and resource allocation, aiming to min-
imize operational costs by considering factors like
time, energy consumption, and resource utilization. It
evaluates various candidate solutions to balance per-
formance metrics with system constraints, ensuring
efficient resource allocation while reducing costs. In
research involving robotic systems or complex envi-
ronments, such functions enhance system efficiency
and scalability by guiding real-time decision-making
Comparative Analysis of Simulated Annealing and Particle Swarm Optimization for Multi-Robot Task Allocation in ROS
483
Data: Robots, Distance matrix, P matrix,
Dump capacity, Speed, Dump location,
Penalty coefficients α,β, Time limit T
0
Result: Total cost total cost
total cost ← 0
for each robot i do
Initialize travel time ← 0,
total litter ← 0, previous task ← depot
for each task j ∈ P
i
do
if total litter + litter[ j] >
dump capacity then
travel time +=
time to dump and back to next task
total litter ← litter[ j]
end
else
total litter += litter[ j]
end
travel time += time to next task
previous task ← j
end
total time ← travel time +total litter ×t
robot cost ← total time
Add penalties if applicable:
if total litter > dump capacity then
robot cost +=
(total litter − dump capacity) · α
end
if total time > T
0
then
robot cost += (total time − T
0
) · β
end
total cost ← max(total cost, robot cost)
end
return total cost
Algorithm 1: Calculate Cost.
based on dynamic factors like workload, task priority,
and resource availability. The cost function used is
given in Algorithm 1. In our study, we employ Sim-
ulated Annealing (SA) and Particle Swarm Optimiza-
tion (PSO) within the cost optimization framework to
explore and exploit the solution space, enabling the
reduction of costs while satisfying system constraints.
For more details on the SA and PSO algorithms,
refer to APPENDIX A and APPENDIX B.
4 TESTBED DEMONSTRATION
The testbed developed consists of three main com-
ponents: a 3D model representing the cleaning en-
vironment, models of the cleaning robots, and mod-
els of surveying drones. The communication between
the simulated environment and the central control sys-
tem, as well as the tasks of path planning and naviga-
tion, are managed using ROS (Robot Operating Sys-
tem) along with its associated packages, specifically
slam toolbox and nav2.
We consider a generic parking lot as the testbed
environment. The 3D model is sourced from Sketch-
fab. This environment model is used to generate a
dataset, which is essential for training the garbage de-
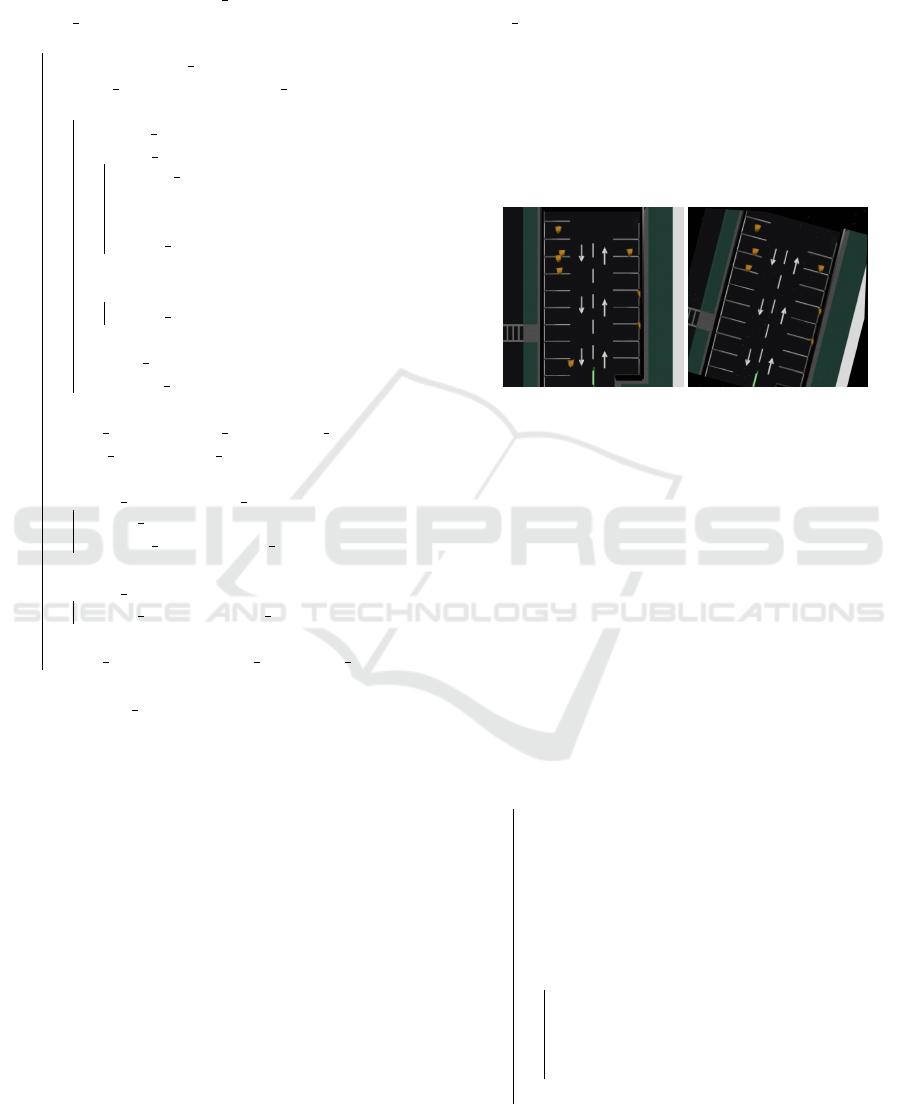
tection model. Sample augmented images from the
simulation are provided in Figure 2, illustrating the
environment used for model training.
(a) (b)
Figure 2: Augmented images from the simulation used for
training the garbage detection model.
To simulate the generation of garbage in a dy-
namic environment, a garbage spawning routine (Al-
gorithm 2) is used, relying on three probabilistic com-
ponents: time intervals (modeled by an exponential
distribution), the number of garbage bags (following
a Poisson distribution), and their spatial coordinates
(determined by a uniform distribution). These proba-
bilistic models enable varied and realistic scenarios.
Data: Initial spawn rate λ
Result: Garbage bags spawned at random
coordinates
initialize λ;
while true do
draw time interval T from exponential
distribution;
schedule the next garbage spawn event
after T seconds;
draw the number of garbage bags N from
the Poisson distribution, at scheduled
time;
for i = 1 to N do
draw x and y coordinates from the
uniform distribution;
spawn garbage bag i at the specified
coordinates (x,y);
end
end
Algorithm 2: Garbage Spawning Routine.
ICAART 2025 - 17th International Conference on Agents and Artificial Intelligence
484

The cleaning robots in the simulation are based on
the TurtleBot3, a ROS-enabled mobile robot platform.
For the surveying tasks, an X3 UAV model, obtained
from Gazebo Fuel, is used. Modifications were made
to the drone model, including the addition of a Li-
DAR sensor for altitude measurement and adjusting
the onboard camera to capture images of the ground
beneath the drone. These modifications enhance the
drone’s capability for environmental monitoring and
data collection.
The implementation of the described testbed is
available at this GitHub repository.
5 EXPERIMENT AND
SIMULATIONS
5.1 Performance Analysis with Varying
Robot Counts and Task Complexity
This study evaluates how performance metrics—cost,
time elapsed, and energy—vary with the number of
robots and garbage spawning rates. The number of
robots is varied from 1 to 10, and the Poisson distri-
bution parameter (λ), governing garbage generation
rates, is varied from 1 to 10. For each combination of
robot count and λ, metrics are calculated as the mean
of 10 independent observations to ensure reliability.
Results demonstrate that Particle Swarm Opti-
mization (PSO) outperforms Simulated Annealing
(SA) across all metrics. PSO consistently achieves
lower costs, faster task completion, and reduced en-
ergy consumption. For example, with λ = 2 and 8
robots, PSO incurs a cost of 134.2 compared to SA’s
168.6, while for λ = 9 and 9 robots, PSO’s cost is
403.2 compared to SA’s 556.2. Similarly, in terms
of time and energy, PSO completes tasks more effi-
ciently. For λ = 4 and 8 robots, PSO reduces time
to 211.4 units compared to SA’s 268.8, and for λ = 9
and 9 robots, PSO uses 317.0 energy units, signifi-
cantly lower than SA’s 3170.0. These findings high-
light PSO’s superior optimization capability in dy-
namic, resource-intensive environments.
The penalties (α and β) play a critical role in in-
fluencing the total cost of the system. Robots that ex-
ceed their litter capacity or battery limitations incur
these penalties, which substantially increase the over-
all costs. This effect is especially pronounced in sce-
narios with fewer robots, as each robot must cover a
larger area, leading to greater chances of surpassing
these thresholds. Generally, the total cost, time, and
energy required to complete cleaning tasks decrease
as the number of robots increases. This is because a
larger number of robots can share the workload, al-
lowing tasks to be completed more quickly and with
lower energy consumption. However, an excessive
number of robots may introduce coordination chal-
lenges, reflecting the ”law of diminishing returns,”
where the benefits of adding more robots are offset
by the overhead of managing them.
Performance metrics improve with an increasing
number of robots, as task distribution reduces indi-
vidual workload. However, excessive robots lead to
diminishing returns due to coordination challenges.
Higher λ values increase costs, time, and energy, par-
ticularly with fewer robots, as each must cover larger
areas. Efficient task allocation requires balancing
robot count with task complexity, ensuring minimized
costs and energy consumption. Tables 1 and 2 sum-
marize the optimal configurations for SA and PSO.
Table 1: Summary of optimal Number of Robots, Lambda
Poisson, Cost, Time, and Energy for Different Configura-
tions (SA).
Robots Lambda Poisson Cost Time Energy
3 1 68.5 68.5 169.0
8 2 168.6 168.6 546.4
4 3 252.4 252.4 730.8
9 4 268.8 268.8 1314.6
8 5 319.4 319.4 1486.2
6 6 395.3 395.3 1602.6
8 7 493.4 493.4 2344.0
8 8 565.1 565.1 2782.8
9 9 556.2 556.2 3170.0
Table 2: Summary of optimal Number of Robots, Lambda
Poisson, Cost, Time, and Energy for Different Configura-
tions (PSO).
Robots Lambda Poisson Cost Time Energy
3 1 35.4 36.2 35.4
8 2 134.2 134.6 457.2
8 3 289.8 294.8 871.2
10 4 246.4 271.6 942.4
9 5 351.8 385.4 548.8
5 6 282.6 345.2 423.6
10 7 341.8 475.2 341.8
9 8 402.4 550 402.4
10 9 403.2 563.8 317
5.2 Impact of Robot Battery Capacity
on Cleaning Cost Efficiency
This experiment focuses on a controlled setup where
several parameters are fixed, and the focus is placed
on the effect of time capacity. The parameters in-
volved are:
Poisson Distribution (fixed): λ is set to a constant
value of 4. This reflects a moderate rate of task arrival
Comparative Analysis of Simulated Annealing and Particle Swarm Optimization for Multi-Robot Task Allocation in ROS
485
(garbage generation) in the system.
Number of Robots (fixed): Set to 3 robots, provid-
ing a baseline capacity for task allocation.
Dump Capacity (fixed): Set to a high value of
100,000 units to avoid penalties associated with ex-
ceeding the dump capacity. This ensures that the ex-
periments focus on other factors without the influence
of dump-related penalties.
Time Capacity (variable): The time capacity is
varied in this setup. By modifying the time capacity,
the system is tested under different operational con-
straints, allowing an exploration of how time restric-
tions affect the overall performance.
The rationale behind this setup is to isolate the im-
pact of time capacity on the task allocation process,
while minimizing other variables (such as penalties
related to dump capacity). This controlled experiment
provides insights into the algorithms’ efficiency when
time becomes the primary limiting factor.
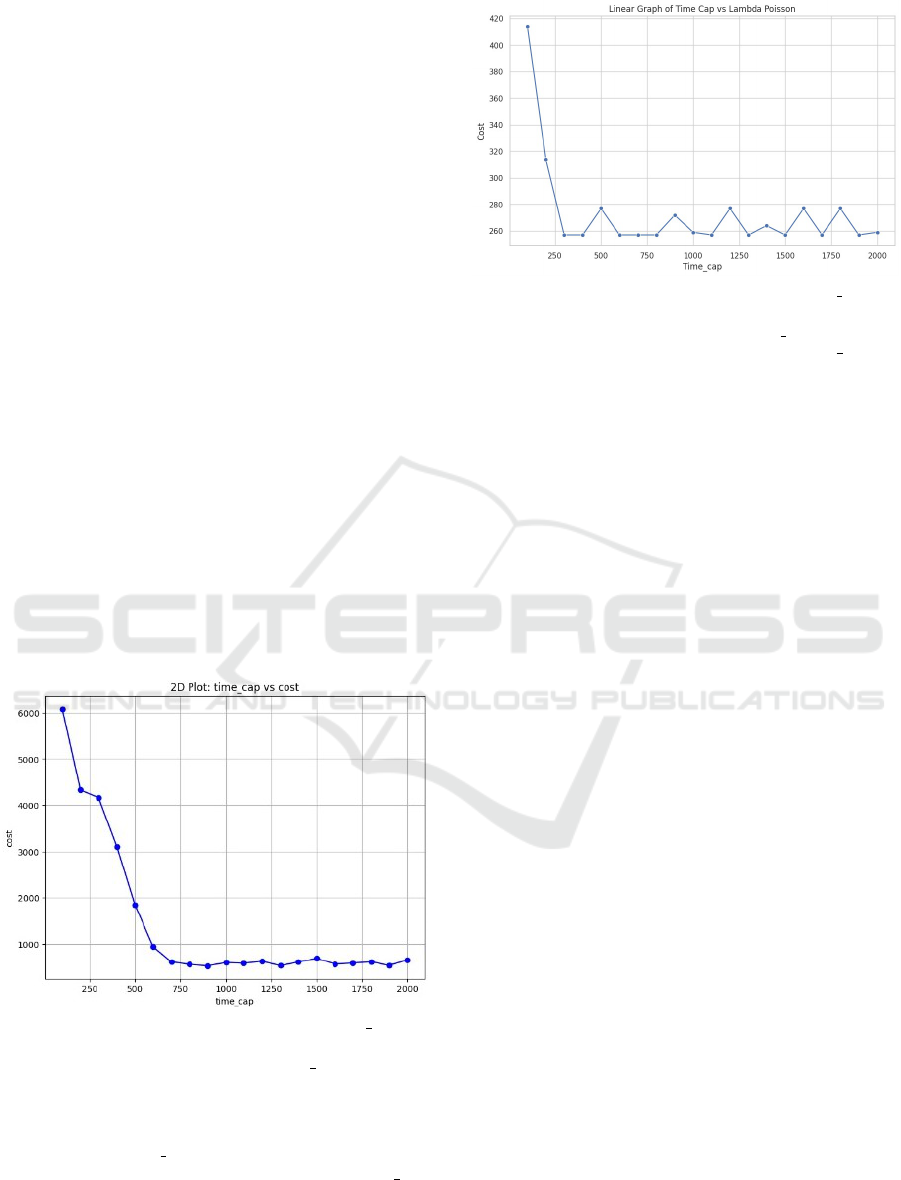
Figure 3 and Figure 4 indicate the relationship of
time-capacity for the set of batteries and cost incurred
by the multi-robot system. Cost decreases steeply
with the increase in battery capacities primarily be-
cause of decreased charging demands, or time and
energy spent going to the charging station and back
to cleaning zones, after which it reaches a cost range.
This indicates that optimizing battery capacity can
significantly reduce operational costs up to a certain
point, after which the cost stabilizes.
Figure 3: Effect of Robot Battery Capacity(time cap) on
System Cost [SA] (Time Capacity vs. Cost). The parame-
ters kept constant here are: λ = 4, and num robots = 3.
Figure 3 represents a system where costs are ini-
tially much higher and more significantly affected by
increasing the time cap. The model stabilizes after
some point, indicating that increasing the time cap
further offers diminishing returns.
Figure 4 represents a system where the cost is
much lower from the start, but there is less stability
Figure 4: Effect of Robot Battery Capacity(time cap) on
System Cost [PSO] (Time Capacity vs. Cost). The parame-
ters kept constant here are: λ = 4, and num robots = 3.
over time, with more fluctuations as the time cap in-
creases.
5.3 Limitations
The study assumes homogeneous abilities of ground
robots and uniform environments, which simplifies
simulations but may not accurately capture the com
plexities of real-world scenarios. Additionally, the
use of fixed robot speeds and constant garbage gener
ation rates does not account for dynamic factors, such
as varying terrain conditions or human activity, which
could significantly impact performance in practical
applications.
6 CONCLUSION
This research underscores the efficacy of multi-robot
systems when integrated with the ROS framework
and an optimized algorithm for task scheduling. The
implementation of algorithms like simulated anneal-
ing (SA) and particle swarm optimization (PSO)
within the ROS ecosystem has demonstrated signif-
icant improvements in task coordination, resource
utilization, and operational efficiency. By facilitat-
ing seamless communication and synchronization be-
tween multiple robots, our system effectively ad-
dresses the complexities associated with dynamic task
environments.
In conclusion, the findings from this study
contribute valuable insights into the design and
deployment of multi-robot systems, offering a viable
solution for complex tasks in diverse domains.
Future research may focus on further refining the
task scheduling algorithms, expanding the system’s
capabilities, and exploring its application in more
challenging and dynamic environments. The ad-
vancements achieved here lay the groundwork for
ICAART 2025 - 17th International Conference on Agents and Artificial Intelligence
486

more sophisticated multi-robot applications, paving
the way for broader adoption in both industrial and
research settings.
REFERENCES
Elfakharany, A. and Ismail, Z. H. (2021). End-to-end deep
reinforcement learning for decentralized task alloca-
tion and navigation for a multi-robot system. Applied
Sciences, 11(7).
Hong, L., Cui, W., and Chen, H. (2021). A novel multi-
robot task allocation model in marine plastics clean-
ing based on replicator dynamics. Journal of Marine
Science and Engineering, 9(8).
Hu, J., Lennox, B., and Arvin, F. (2021). Collaborative cov-
erage for a network of vacuum cleaner robots. In An-
nual Conference Towards Autonomous Robotic Sys-
tems, pages 112–115. Springer.
Jeon, S., Jang, M., Lee, D., Cho, Y.-J., and Lee, J. (2015).
Multiple robots task allocation for cleaning a large
public space. In 2015 SAI Intelligent Systems Con-
ference (IntelliSys), pages 315–319.
Le, C. P., Pham, A. Q., La, H. M., and Feil-Seifer, D.
(2020). A multi-robotic system for environmental dirt
cleaning. In 2020 IEEE/SICE International Sympo-
sium on System Integration (SII), pages 1294–1299.
Le, C. P., Pham, H. X., and La, H. M. (2018). A multi-
robotic system for environmental cleaning. ArXiv,
abs/1811.00690.
Macenski, S. (2019). On use of slam toolbox, a fresh(er)
look at mapping and localization for the dynamic
world. In Proceedings of ROSCon 2019.
Macenski, S. and Jambrecic, I. (2021). Slam toolbox: Slam
for the dynamic world. Journal of Open Source Soft-
ware, 6(61):2783.
Macenski, S., Mart
´
ın, F., White, R., and Gin
´
es Clavero, J.
(2020). The marathon 2: A navigation system. In
2020 IEEE/RSJ International Conference on Intelli-
gent Robots and Systems (IROS).
Ni, J., Gu, Y., Tang, G., Ke, C., and Gu, Y. (2024). Cooper-
ative coverage path planning for multi-mobile robots
based on improved k-means clustering and deep rein-
forcement learning. Electronics, 13(5).
Orr, J. and Dutta, A. (2023). Multi-agent deep reinforce-
ment learning for multi-robot applications: A survey.
Sensors, 23(7).
Park, B., Kang, C., and Choi, J. (2022). Cooperative multi-
robot task allocation with reinforcement learning. Ap-
plied Sciences, 12(1).
Wang, Y., Hernandez, A., Shen, L., and Zhang, H. (2024).
Path planning of water surface garbage cleaning robot
based on improved immune particle swarm algorithm.
AIP Advances, 14(2).
Wang, Y., Hong, X., Ma, Z., Ma, T., Qin, B., and Su, Z.
(2023). Towards practical multi-robot hybrid tasks
allocation for autonomous cleaning. arXiv preprint
arXiv:2303.06531.
APPENDIX A
Simulated Annealing
Simulated Annealing (SA) is an optimization algo-
rithm that navigates the solution space by allowing
both upward and downward adjustments, helping es-
cape local minima and move toward a global solution.
It gradually reduces a ”temperature” parameter to bal-
ance exploration and refinement, making it effective
for complex problems.
Cooling Rate: The cooling rate (α) is defined as
T
new
= α · T
old
, where it controls the rate of temper-
ature decrease. Its value varies between 0 and 1. A
higher α (closer to 1) promotes broader exploration,
reducing the risk of getting trapped in local minima,
while a lower α focuses on refining the current so-
lution but risks suboptimal outcomes. Proper tuning
ensures an optimal balance between exploration and
exploitation. The employed algorithm is given in Al-
gorithm 3.
Data: Initial temperature T
0
, Cooling rate r
Result: Best solution and Cost
Initialize T ← T
0
, random P matrix,
current cost ← cost of P matrix
best cost ← current cost,
best solution ← P matrix
while T > T
s
do
for i ← 1 to L
k
do
Apply a random operation: swap(),
invert(), or move(); Compute ∆ ←
cost change
if ∆ < 0 or random() < exp(−∆/T )
then
Update current solution,
current cost
if current cost < best cost then
Update best solution,
best cost
end
end
end
T ← T · r
end
return best solution,best cost
Algorithm 3: Simulated Annealing (SA).
APPENDIX B
Particle Swarm Optimization
Particle Swarm Optimization (PSO) is a collabora-
tive optimization algorithm where a swarm of parti-
Comparative Analysis of Simulated Annealing and Particle Swarm Optimization for Multi-Robot Task Allocation in ROS
487

cles explores the solution space, adjusting their posi-
tions based on their own experience and the best so-
lutions found by others. This information sharing en-
ables an efficient balance between exploration of new
areas and exploitation of promising regions, making
PSO effective for complex problems.
Inertia Factor (ω): The inertia factor (ω) governs
the influence of a particle’s current velocity on its next
velocity. A higher ω encourages broad exploration,
while a lower ω focuses on refining around the best-
known solutions. The velocity update formula is:
v
i
(t +1) = ω· v
i
(t)+c
1
·r
1
·(p
i
−x
i
)+c
2
·r
2
·(g −x
i
),
where v
i
(t) is the current velocity of particle i, p
i
is
its personal best position, and g is the global best po-
sition. A decaying ω is often used to start with global
exploration and gradually shift to local exploitation
for better convergence. The employed algorithm is
given in Algorithm 4.
Data: N: Number of particles, T : Max
iterations, w,c
1
,c
2
: PSO factors
Result: global best: Optimal solution,
global best cost: Optimal cost
Initialize global best cost ← ∞, particles with
random positions and velocities
for each particle do
if particle.personal best cost <
global best cost then
Update global best and
global best cost
end
end
for t = 1 to T do
for each particle do
Update velocity:
particle.velocity ← w · velocity + c
1
·
rand · (personal best − position)+
c
2
· rand · (global best − position)
Update position using velocity
new cost ← particle.calculate cost()
if new cost <
particle.personal best cost then
Update personal best
if new cost < global best cost
then
Update global best and
global best cost
end
end
end
end
return global best, global best cost
Algorithm 4: Particle Swarm Optimization (PSO).
ICAART 2025 - 17th International Conference on Agents and Artificial Intelligence
488
