
Enhancing the Efficiency of the Grouping-Scoring-Modeling
Framework with Statistical Pre-Scoring Component for
Transcriptomic Data Analysis
Maham Khokhar
1a
, Burcu Bakir-Gungor
2b
and Malik Yousef
3 c
1
Department of Data Science, Social Sciences Institute, Abdullah Gul University, Kayseri, 38080, Turkey
2
Department of Computer Engineering, Faculty of Engineering, Abdullah Gul University, Kayseri, 38080, Turkey
3
Department of Information Systems, Galilee Digital Health Research Center, Zefat Academic College, 13206, Zefat, Israel
Keywords: Transcriptomics Data Analysis, Feature Selection, Machine Learning, Biomarker Discovery.
Abstract: The advent of high-throughput transcriptomic technologies has generated vast transcriptomic datasets,
challenging current analytical methodologies with their sheer volume and complexity. The Grouping-Scoring-
Modeling (G-S-M) approach is one of the recent approaches that treat groups of genes (or clusters of genes)
by embedding prior biological knowledge with machine learning in order to detect the most significant groups
for classification tasks. The G-S-M might need to treat thousand ten thousand of groups (scoring those groups)
which might affect the speed and performance of the algorithm. In response, this study introduces the Pre-
Scoring G-S-M model, an enhancement of the established Grouping-Scoring-Modeling (G-S-M) framework.
This approach incorporates a Pre-Scoring component that leverages the Limma package for its empirical
Bayes methods to optimize initial transcriptomic data evaluation through a percentage-based selection of
statistically significant gene groups. Aimed at reducing computational demand and streamlining feature
selection, the model also addresses data redundancy by eliminating duplicate gene-disease associations.
Application to nine human gene expression datasets from the GEO database showed promising results. It
demonstrated improvements in computational efficiency and analytical precision while reducing the number
of features selected per dataset compared to the traditional G-S-M approach, without compromising accuracy.
These initial findings highlight the Pre-Scoring G-S-M model's potential to enhance transcriptomic data
analysis, indicating a promising direction for future bioinformatics research.
1 INTRODUCTION
Advancements in high-throughput technologies and
cost reductions have greatly expanded transcriptomic
data generation, providing valuable insights into
biological systems (Wong, 2019). Instead of studying
diseases through isolated “omic” lenses, researchers
now employ a multi-omics approach for a
comprehensive understanding of molecular
mechanisms (Subramanian et al., 2020). This
integrative strategy is vital for elucidating disease
onset and progression (Wekesa & Kimwele, 2023).
Yet, the volume and complexity of data pose
analytical challenges that are increasingly addressed
a
https://orcid.org/0009-0007-7248-4891
b
https://orcid.org/0000-0002-2272-6270
c
https://orcid.org/0000-0001-8780-6303
by machine learning and cloud computing,
facilitating the discovery of new biomarkers,
improved drug development, and personalized
medicine (Oh et al., 2021; Camacho et al., 2018).
Machine learning models, both supervised and
unsupervised, can uncover hidden patterns in large
datasets, enabling accurate disease prediction, the
identification of subgroups for targeted therapies, and
better patient profiling (Reel et al., 2021). However,
the high dimensionality of omics data necessitates
rigorous feature selection techniques to avoid
overfitting and data bottlenecks (Li et al., 2022;
Bhadra et al., 2022; Xu & Jackson, 2019). By
isolating the most relevant features, researchers can
more easily interpret results, discover novel
Khokhar, M., Bakir-Gungor, B. and Yousef, M.
Enhancing the Efficiency of the Grouping-Scoring-Modeling Framework with Statistical Pre-Scoring Component for Transcriptomic Data Analysis.
DOI: 10.5220/0013192600003911
Paper published under CC license (CC BY-NC-ND 4.0)
In Proceedings of the 18th International Joint Conference on Biomedical Engineering Systems and Technologies (BIOSTEC 2025) - Volume 1, pages 479-488
ISBN: 978-989-758-731-3; ISSN: 2184-4305
Proceedings Copyright © 2025 by SCITEPRESS – Science and Technology Publications, Lda.
479

biomarkers, and refine disease classification (He &
Yu, 2010). Approaches range from individual feature
selection (IFS) to group-based feature selection
(GFS), each with distinct advantages depending on
computational resources and the need to capture
feature interdependencies (Zheng et al., 2021;
Kuzudisli et al., 2023). Strengthening these methods
will be crucial for future breakthroughs in multi-
omics research and personalized healthcare
(Remeseiro & Bolon-Canedo, 2019; Pudjihartono et
al., 2022).
To address the challenges of feature selection in
omics research, new tools incorporating biological
filters have been developed (Pudjihartono et al.,
2022). Among these advancements, the Grouping-
Scoring-Modeling (G-S-M) framework stands out for
its rigorous approach to omics data analysis. The G-
S-M technique is a systematic method to integrate
biological data into machine learning models,
enhancing the understanding of complex biological
systems (Yousef et al., 2020). Utilizing databases like
DisGeNET (Piñero et al., 2015) and KEGG
PATHWAY (Kanehisa & Goto, 2000), G-S-M
organizes omics data into biologically meaningful
groups and merges this domain knowledge with
statistical approaches (Yousef et al., 2024).
G-S-M has been used in many different
bioinformatic tools such as PriPath (Yousef et al.,
2023), CogNet (Yousef et al., 2021), maTE (Yousef
et al., 2019), GediNET (Qumsiyeh et al., 2022),
miRcorrNet (Yousef et al., 2021), 3Mint (Unlu Yazici
et al., 2023), TextNetTopics (Yousef & Voskergian,
2022), and miRdisNET (Jabeer et al., 2023).
However, a significant challenge within the
traditional G-S-M framework and its related tools is
the extensive number of groups they generate, which
then need to be scored using computationally
intensive machine learning models. This process is
both time-consuming and inefficient, as not all groups
equally contribute to meaningful biological insights.
To address this, our research introduces a
preprocessing enhancement: the Pre-Scoring
component. This new addition efficiently prioritizes
biological groups based on their statistical
significance before the more resource-intensive
scoring phase. By initially ranking and prioritizing
gene groups through statistical filtering, the Pre-
scoring component facilitates quicker data processing
and reduces computational demands. Early results
indicate that this adaptation not only streamlines the
analytical process but also enhances the precision of
feature selection, representing a substantial
advancement in bioinformatics.
2 METHODS
2.1 G-S-M Framework Overview
2.1.1 Grouping Component
The "G" component initiates the G-S-M process by
organizing features into smaller, distinct groups based
on pre-existing biological knowledge. Using a user-
provided grouping file, features are categorized
according to their associations with specific diseases
or biological pathways, sourced from open-source
databases. This step ensures the analysis is focused on
biologically coherent groups, enhancing the
contextual relevance and accuracy of the
investigation.
2.1.2 Scoring Component
Following grouping, the "S" component evaluates the
groups. Training data is split into 90% training and
10% testing set. A classifier is trained on the training
set and used to predict outcomes on the testing set,
generating performance metrics. This process is
repeated five times, and the average metrics are used
to score each group. Groups are then ranked by their
scores.
2.1.3 Modeling Component
In the final phase, the Modeling component uses the
top-ranked groups from the scoring phase to develop
predictive models. Models begin with features from
the highest-ranking group, then are incrementally
enriched by adding features from the next highest-
ranked groups—up to ten cumulative groups. This
sequential integration highlights the incremental
value each group offers. A consistent machine
learning algorithm (e.g., Decision Tree, Support
Vector Machine, or Random Forest) ensures reliable
evaluation, while accuracy, specificity, and other
metrics help identify the most effective combination
of groups.
The operational workflow of the G-S-M approach
relies heavily on Monte Carlo cross-validation
(MCCV) for robustness and reliability. MCCV
repeatedly partitions the data into training and testing
sets, ensuring consistent predictive performance
across different data subsets and addressing potential
overfitting and biases. Undersampling is also used to
manage data imbalance, ensuring fair representation
of all classes in the training data. Together, MCCV
and undersampling bolster the G-S-M framework’s
capability to deliver dependable insights from
BIOINFORMATICS 2025 - 16th International Conference on Bioinformatics Models, Methods and Algorithms
480
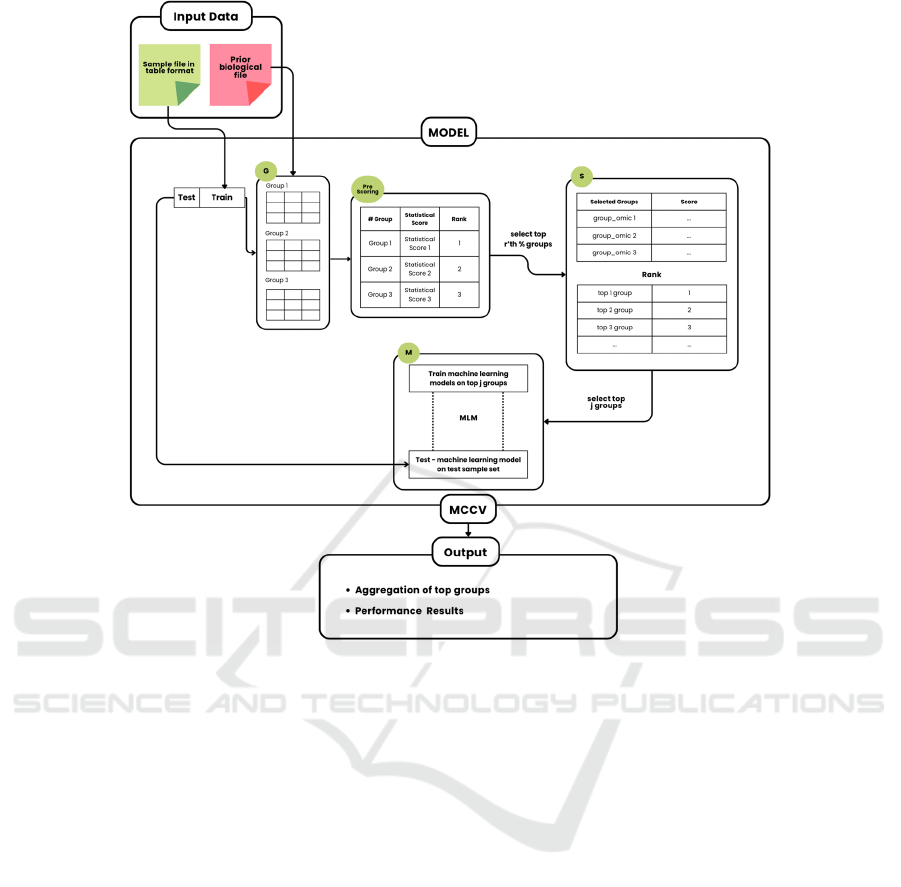
Figure 1: Displays the operation of the Pre-Scoring G-S-M Tool. The primary function of Pre-Scoring G-S-M is to combine
existing biological data to categorize genes according to their association with a grouping factor, such as diseases. This
information is supplied by the user.
complex biological data. Figure 1 depicts the basic
flow of the Pre-Scoring G-S-M approach.
2.2 Data Collection and Preparation
While G-S-M is adaptable for various omics data, the
validation used a disease-gene association database
and gene expression datasets from GEO, focusing on
gene-disease pairs.
Data for training and testing the machine learning
model comes from DisGeNET and GEO. DisGeNET
is a discovery platform with extensive gene-disease
associations. It compiles data from scientific
literature, public databases, and expert-curated
resources, using NLP to extract relevant information.
DisGeNET's v7 dataset includes 30,170 diseases and
21,666 genes, with 3,241,576 associations (Piñero et
al., 2021). Filters were applied to manage data size,
focusing on 'disease' entries and 'Neoplastic Process'
or 'Disease' tags, resulting in 15,991 genes and 3,929
diseases with 329,936 associations. The Gene
Expression Omnibus (GEO) database is an
international repository for gene expression and
functional genomics datasets (Clough & Barrett,
2016). Researchers submit data from experiments
designed to investigate gene expression patterns
(Wang et al., 2019). Nine datasets related to human
gene expression for various diseases were sourced
from GEO, each cataloged by disease and sample
count, distinguishing between positive and negative
samples.
2.3 G Component: Creating a
Two-Class sub-Dataset Based on
Disease Biological Knowledge
Sub-datasets specific to each group or disease are
created by isolating relevant gene columns and class
labels. These sub-datasets are input into the Pre-
Scoring component. Figure 2 illustrates this process,
showing the input panels with gene expression
matrices and pre-existing biological knowledge, such
as disease
associations.
Enhancing the Efficiency of the Grouping-Scoring-Modeling Framework with Statistical Pre-Scoring Component for Transcriptomic Data
Analysis
481
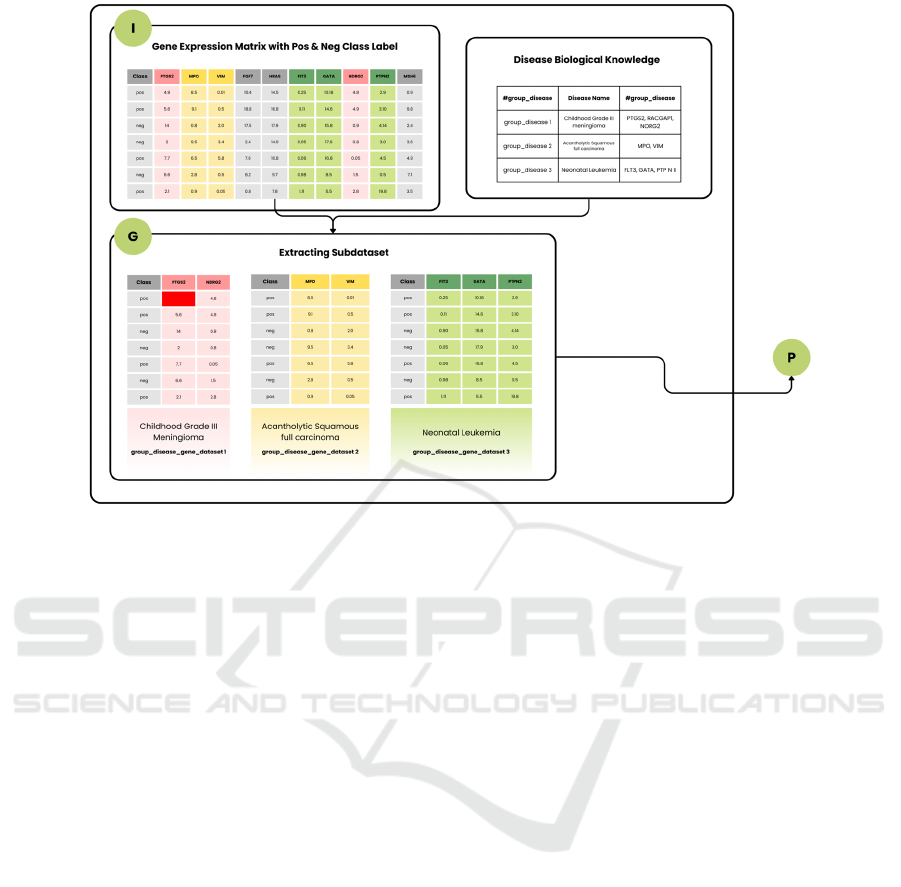
Figure 2: Illustrates the formation of two-class sub-datasets derived from disease-group names, subsequently processed by
the Pre-Scoring component for statistical scoring.
2.4 Introducing the Pre-Scoring
Component with Limma
Integration in the G-S-M Approach
The introduction of the Pre-Scoring component into
the G-S-M approach represents a methodological
enhancement in preprocessing. Central to this
enhancement is the Limma package, widely
recognized for its ability to analyze differential
expression in gene datasets. The Limma package's
strength lies in its empirical Bayes method, which
effectively stabilizes the variance estimates,
especially beneficial when dealing with small sample
sizes often encountered in gene expression studies
(Smyth, 2004). For example, one of our datasets,
GDS3257, has only 107 samples, making variance
stabilization particularly crucial. This stabilization
allows for more reliable inferences about differential
expression across a wide array of genes. Furthermore,
Limma employs moderated t-statistics, leveraging
information from all genes to improve variance
estimates, thereby providing more stable and accurate
statistical inferences (Phipson et al., 2016). The
package also offers robust linear model fitting,
accommodating complex experimental designs to
ensure precise modeling of the relationship between
gene expression and experimental conditions.
A key feature of Limma, is its adept control of the
false discovery rate (FDR), crucial in studies where
thousands of genes are tested simultaneously. By
using the Benjamini-Hochberg adjustment method,
Limma adjusts p-values to control the FDR, ensuring
that the proportion of false positives among the
significant results is minimized (Ritchie et al., 2015).
This multiple-testing correction is essential for the
validity of findings in high-dimensional data analysis.
The adjusted p-value metric, which corrects for
multiple testing, ensures that the likelihood of
identifying genes as differentially expressed is not
due to random chance alone. This statistical
validation is crucial in high-dimensional data
analysis, where false positives are a significant
concern. By focusing on the adjusted p-values, we
enhance the reliability of our differential expression
analysis, providing a more robust and interpretable
set of results.
The use of mean adjusted p-values in our Pre-
Scoring phase, therefore, is not arbitrary but a
deliberate choice to bolster the robustness of the
feature selection process. By incorporating these
rigorous statistical techniques, we ensure that our
analysis is not only reliable but also reproducible,
underscoring the methodological integrity of our
approach. Within this newly established component,
we implemented two key elements to enhance
efficiency and specificity further.
First, the Pre-Scoring component introduces a
percentage-based selection mechanism. This
BIOINFORMATICS 2025 - 16th International Conference on Bioinformatics Models, Methods and Algorithms
482
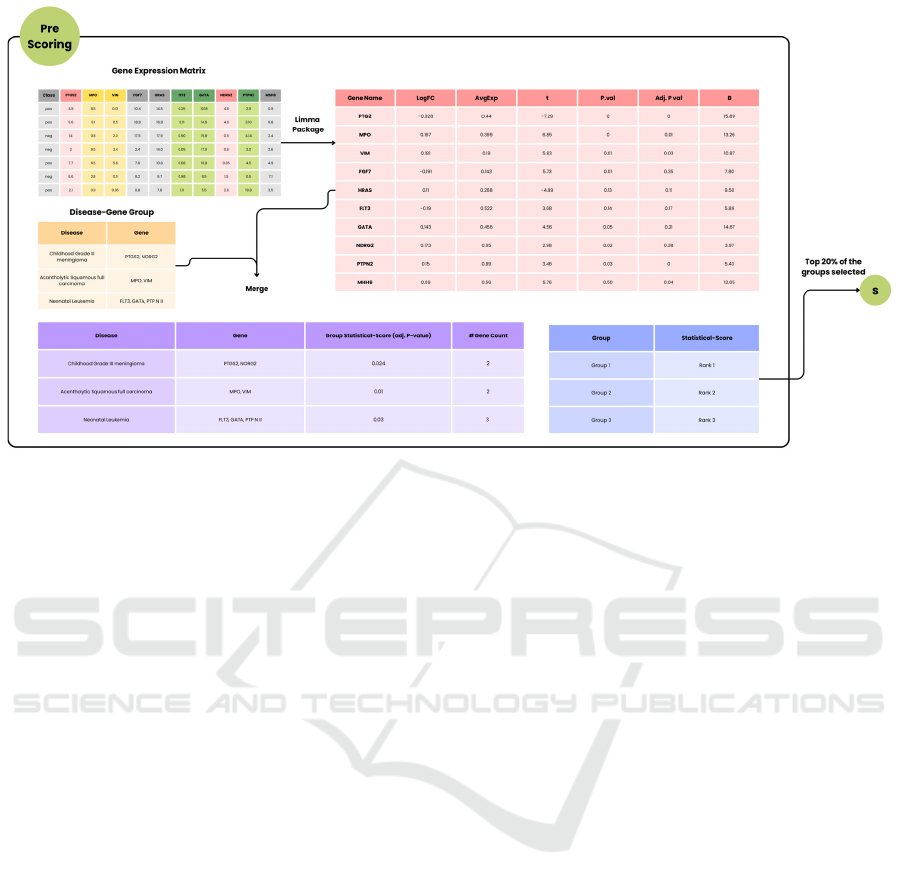
Figure 3: Illustrates the Pre-Scoring process used in the G-S-M framework for enhanced feature selection in transcriptomic
data.
functionality addresses the variability in the number
of groups generated by different datasets. With a
fixed percentage-based system, researchers can
dynamically adjust the selection to the dataset size.
For instance, one dataset might produce 2,809 groups,
while another yields 3,000; choosing the top 20%
adapts seamlessly to each. Second, the Pre-Scoring
component systematically removes duplicate gene-
disease associations, preserving unique gene
representations and preventing the dilution of
statistical significance. After processing with Limma,
average adjusted p-values are computed for each
group, determining final scores. As illustrated in
Figure 3, the top 20% are then selected for further
analysis in our experiment.
2.5 Scoring Component of the
Pre-Scoring G-S-M Framework
After selecting the top 20% of gene groups based on
their statistical scores, these groups are processed in
the Scoring component. In this phase, each group
undergoes secondary scoring using a Random Forest
classifier within a structured cross-validation
framework to assess their potential for accurate
disease prediction. This process involves dataset
splitting, analysis through the S-Fit Test Model, and
evaluation of gene groups with the Random Forest
classifier. The accuracy average of the r splits is then
calculated to determine the group score, and all group
scores are compiled into a table. In the Modeling (M)
component, this table is sorted in descending order,
and the top-ranked j groups of diseases are chosen.
Their genes are merged to form the top-ranked
associated genes (as shown in Fig. 1, Modeling
panel). A sub-dataset (90% training, 10% testing) is
created using these top-ranked genes. An RF model is
subsequently trained on this sub-dataset, and the
model’s performance is evaluated on the testing
dataset. Performance results are documented for j = 1
to 10.
3 RESULTS
The Pre-Scoring G-S-M is evaluated using standard
G-S-M practices, employing a Random Forest
classifier with a 90% training and 10% testing split.
To address dataset imbalance, an undersampling
method is applied to achieve a 2:1 ratio of positive to
negative samples during model training. Monte Carlo
cross-validation (MCCV) with 10 iterations is used to
average performance metrics, including accuracy,
sensitivity, specificity, and area under the curve
(AUC), ensuring reduced variance and reliable
results.
Enhancing the Efficiency of the Grouping-Scoring-Modeling Framework with Statistical Pre-Scoring Component for Transcriptomic Data
Analysis
483

Table 1: Presents an example of cumulative averages from a performance table for 10 MCCV, highlighting the top 10 ranked
groups from the Pre-Scoring G-S-M for the GDS1962 dataset.
#Groups #Genes Accuracy AUC Precision Specificity F-measure Sensitivity
1.00 4.30 0.91 0.95 0.98 0.95 0.93 0.90
2.00 10.20 0.93 0.96 0.98 0.95 0.95 0.92
3.00 17.70 0.94 0.98 0.98 0.95 0.96 0.94
4.00 20.90 0.94 0.97 0.98 0.95 0.96 0.94
5.00 23.60 0.94 0.96 0.98 0.95 0.96 0.94
6.00 27.20 0.94 0.96 0.98 0.95 0.96 0.94
7.00 30.20 0.94 0.96 0.98 0.95 0.96 0.94
8.00 34.40 0.94 0.97 0.98 0.95 0.96 0.94
9.00 37.20 0.94 0.96 0.98 0.95 0.96 0.94
10.00 41.20 0.96 0.97 1.00 1.00 0.97 0.94
3.1 Performance Evaluation of
Pre-Scoring G-S-M
Table 1 presents an example of the average 10-fold
MCCV performance for the top 10 groups in the
GDS1962 dataset. The first row shows the performan-
ce of the top-ranked group achieving an AUC of 95%
using an average of 4.30 genes. The performance
metrics for the top 2 groups are also included, where
genes from the first and second-highest-scoring groups
are combined.
This process is repeated for all top 10
groups to evaluate their collective and individual
contributions to model performance.
The output of the Pre-Scoring G-S-M, similar to
standard G-S-M tools, includes a ranked list of
disease groups assigned p-values by the
RobustRankAggreg package (Kolde et al., 2012). The
framework also compiles a list of significant genes
aggregated by the RobustRankAggreg tool, which
can be used in facilitating functional and enrichment
analyses using platforms like David, EnrichR, and
GeneMANIA.
3.2 Comprehensive Evaluation Across
Diverse Datasets
The Pre-Scoring G-S-M model was applied to nine
diverse human gene expression datasets from the
GEO database, testing the model’s efficiency and
precision across varying genetic expression profiles
as shown in table 2. The Pre-Scoring G-S-M
framework efficiently manages these complexities
and preserves key biological insights, comparable to
the standard G-S-M approach. Integrating the Pre-
Scoring component significantly enhances both
computational efficiency and analytical precision. By
pre-filtering and prioritizing gene groups based on
their statistical relevance, it reduces processing time
and resource consumption, which is particularly
advantageous in computationally constrained
environments. The Limma package improves
analytical precision by focusing on statistically
significant groups, maintaining the quality of
biological insights despite a reduced data volume. For
example, on the GDS1962 dataset, the standard G-S-
M achieved 0.92 accuracy with 81.1 features,
whereas Pre-Scoring G-S-M attained 0.94 accuracy
with only 17.7 features, illustrating the approach’s
efficiency and precision. Figure 4 presents
performance metrics for both standard G-S-M and
Pre-Scoring G-S-M across nine datasets.
BIOINFORMATICS 2025 - 16th International Conference on Bioinformatics Models, Methods and Algorithms
484
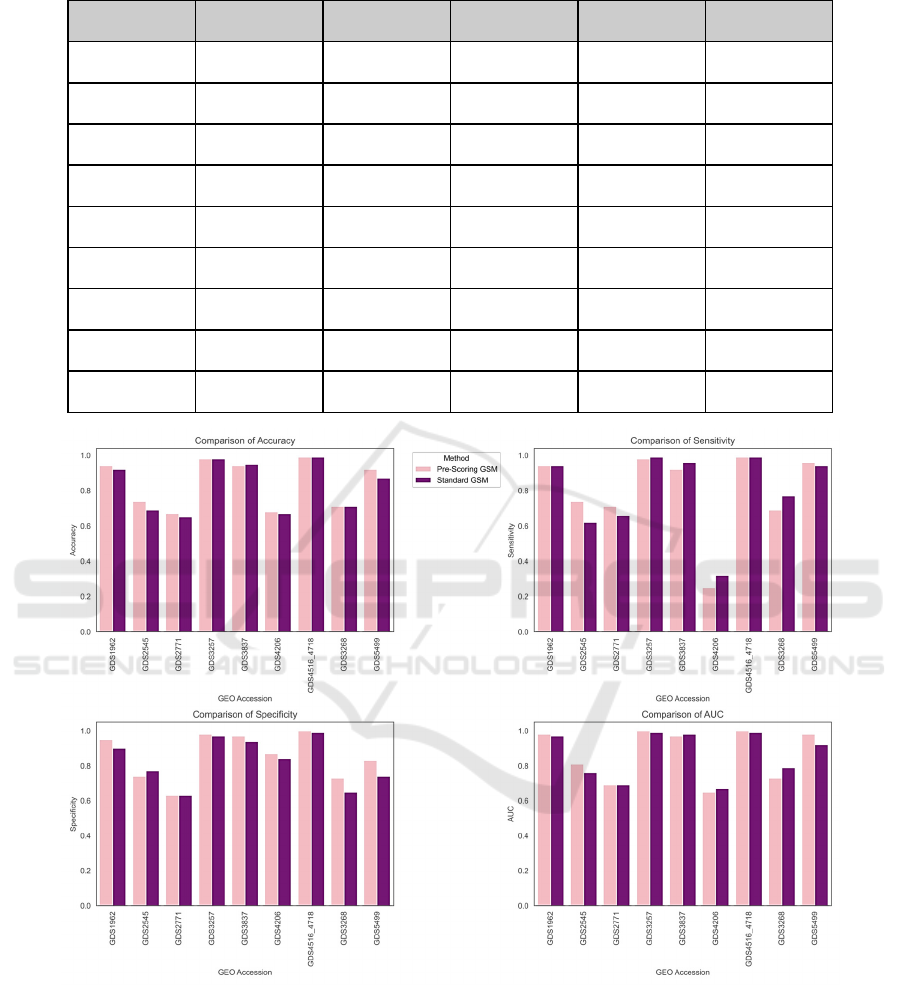
Table 2: Pre-Scoring G-S-M performance results over the top-ranked groups for 9 GEO Dataset.
GEO Accession # Genes Accuracy Sensitivity Specificity AUC
GDS1962 45.57 0.93 0.93 0.93 0.97
GDS2545 113.76 0.73 0.72 0.74 0.81
GDS2771 97.83 0.64 0.69 0.59 0.70
GDS3257 74.81 0.97 0.99 0.94 0.99
GDS3837 21.00 0.92 0.83 1.00 0.92
GDS4206 83.00 0.66 0.30 0.82 0.58
GDS4516_4718 40.72 0.99 0.99 0.99 1.00
GDS3268 115.70 0.67 0.70 0.63 0.73
GDS5499 80.23 0.90 0.96 0.77 0.95
Figure 4: Showcases the comparison of 4 different performance metrics of Pre-Scoring G-S-M (in pink) vs Standard G-S-M
(in purple) across nine GEO datasets. The first graph on the top right is accuracy comparison, the top left is sensitivity, the
right bottom compares specificity and the bottom right compares AUC for both models.
The Pre-Scoring G-S-M model achieves comparable
results to the standard G-S-M across all metrics but
with significantly fewer features, as shown in Figure
5, highlighting the efficiency and precision of this
approach in transcriptomic data analysis. Further
validation will investigate the broader potential of the
framework’s capabilities. To reduce data redundancy,
the Pre-Scoring component filters out duplicate gene-
disease associations within groups, specifically
targeting cases where relevant and statistically
significant genes appear multiple times under
different disease names. For instance, the gene ALP
Enhancing the Efficiency of the Grouping-Scoring-Modeling Framework with Statistical Pre-Scoring Component for Transcriptomic Data
Analysis
485
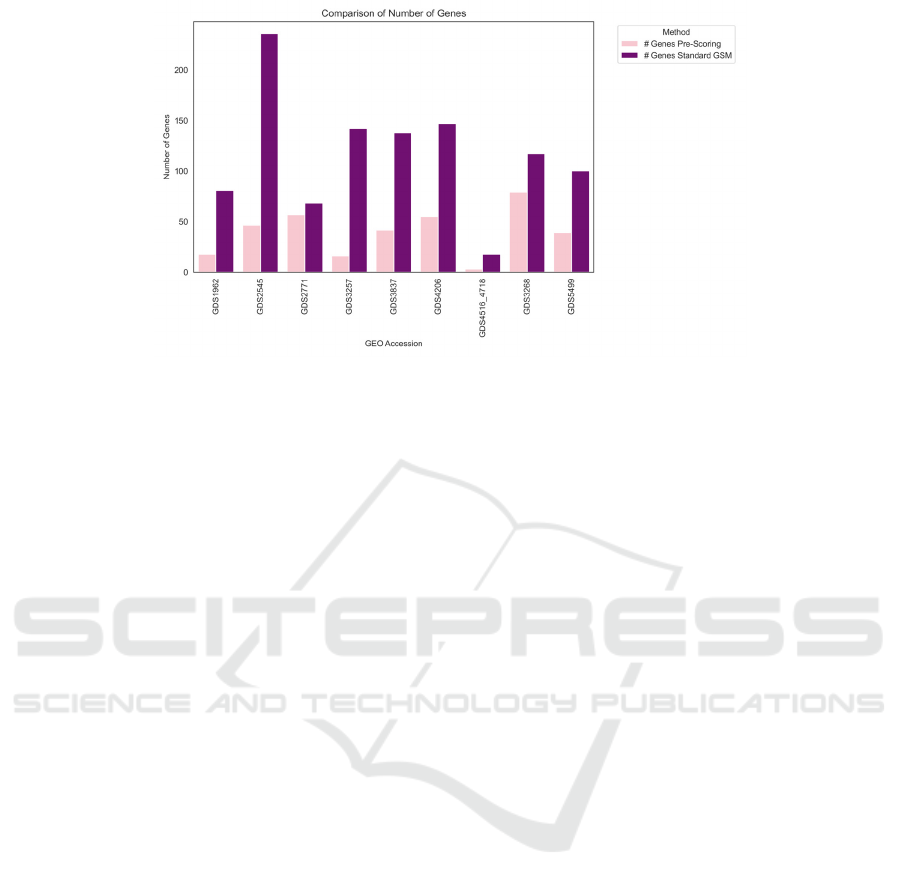
Figure 5: Depicts the number of genes (features) selected by standard G-SM in purple vs number of genes selected by Pre-
Scoring G-S-M in pink.
appeared nine times, each with a different disease.
Removing these duplicates retains only one instance
of the gene per disease group, thereby reducing noise
and complexity and enhancing the model’s
performance by focusing on informative biological
signals.
4 DISCUSSION
4.1 Relevance of the Pre-Scoring
Component in Existing G-S-M
Tools
In this study, we introduce a Pre-Scoring component
to address a critical bottleneck in the G-S-M
framework: the computational intensity of scoring
vast numbers of gene groups. For instance, in the
GDS2545 dataset, which has a relatively smaller set
of gene features, the standard grouping process
initially generates 2809 groups. However, with the
Pre-Scoring component, only 563 of these groups are
selected for detailed scoring. This selective
advancement is crucial because each group is still
scored five times per Monte Carlo cross-validation
(MCCV) iteration, cumulatively requiring substantial
computational resources.
By focusing on groups with higher statistical
significance, the Pre-Scoring component eliminates
the need to score every group from the initial phase.
This streamlines the entire scoring process, ensuring
that computational efforts concentrate on the groups
most likely to yield pertinent biological insights.
Consequently, it enhances the efficiency of the G-S-
M framework, reducing both the computational load
and the time required for processing. This example
underscores the value of the Pre-Scoring component
in optimizing the analysis workflow.
4.2 Impact on Bioinformatics Tools
The integration of the Pre-Scoring component into
tools like PriPath (Yousef et al., 2023), CogNet
(Yousef et al., 2021), and GediNET (Qumsiyeh et al.,
2022) could significantly improve their efficiency
and effectiveness. These tools, which use similar
methodologies, could benefit from the reduced
computational demands and enhanced focus on
statistically significant gene groups.
4.3 Potential Limitations and Future
Plans
One limitation of the Pre-Scoring component is the
variance in group sizes, which might bias the
statistical relevance, favoring either larger or smaller
groups during the scoring process. Additionally,
noisy genes within a group could negatively impact
the overall classification performance, a limitation
that does not affect feature selection methods
evaluating genes individually. Both issues can be
addressed by considering a fixed number of
representative genes from each group.
5 CONCLUSION
The Pre-Scoring G-S-M model's initial application
showcases promising strides in enhancing
computational efficiency and precision in
BIOINFORMATICS 2025 - 16th International Conference on Bioinformatics Models, Methods and Algorithms
486

transcriptomic analysis. By integrating this additional
Pre-Scoring component alongside the standard G-S-
M scoring mechanism, we introduce a dual-layered
evaluation system, promising a more nuanced
analysis process.
These advancements suggest a significant impact
on feature selection, potentially streamlining
biomarker discovery and disease classification
processes. While these findings are preliminary, they
underscore the potential for the Pre-Scoring G-S-M
approach to facilitate more accessible and efficient
transcriptomic research, even in settings with limited
computational resources.
REFERENCES
Bhadra, T., Mallik, S., Hasan, N., & Zhao, Z. (2022).
Comparison of five supervised feature selection
algorithms leading to top features and gene signatures
from multi-omics data in cancer. BMC Bioinformatics,
23(Suppl 3), 153. https://doi.org/10.1186/s12859-022-
04678-y
biomarker identification for NSCLC prediction using multi-
omics data integration. Biomolecules, 12(12), 1839.
https://doi.org/10.3390/biom12121839
Camacho, D. M., Collins, K. M., Powers, R. K., Costello,
J. C., & Collins, J. J. (2018). Next-generation machine
learning for biological networks. Cell, 173(7), 1737-
1750. https://doi.org/10.1016/j.cell.2018.05.015
Clough, E., & Barrett, T. (2016). The Gene Expression
Omnibus database. In Methods in Molecular Biology
(Vol. 1418, pp. 93). Humana Press.
https://doi.org/10.1007/978-1-4939-3578-9_5
He, Z., & Yu, W. (2010). Stable feature selection for
biomarker discovery. Computational Biology and
Chemistry, 34(4), 215-225. https://doi.org/10.1016/
j.compbiolchem.2010.07.002
Jabeer, A., Temiz, M., Bakir-Gungor, B., & Yousef, M.
(2023). miRdisNET: Discovering microRNA
biomarkers that are associated with diseases utilizing
biological knowledge-based machine learning.
Frontiers in Genetics, 13.
Kanehisa, M., & Goto, S. (2000). KEGG: Kyoto
encyclopedia of genes and genomes. Nucleic Acids
Research, 28(1), 27-30. https://www.ncbi.nlm.nih.gov/
pmc/articles/PMC102409/
Kolde, R., Laur, S., Adler, P., & Vilo, J. (2012). Robust
rank aggregation for gene list integration and meta-
analysis. Bioinformatics, 28(5), 573–580.
https://doi.org/10.1093/bioinformatics/btr709
Kuzudisli, C., Bakir-Gungor, B., Bulut, N., Qaqish, B., &
Yousef, M. (2023). Review of feature selection
approaches based on grouping of features. PeerJ, 11.
https://doi.org/10.7717/peerj.15666
Li, Y., Mansmann, U., Du, S., & Hornung, R. (2022).
Benchmark study of feature selection strategies for
multi-omics data. BMC Bioinformatics, 23, 412.
https://doi.org/10.1186/s12859-022-04962-x
Oh, M., Park, S., Kim, S., & Chae, H. (2021). Machine
learning-based analysis of multi-omics data on the
cloud for investigating gene regulations. Briefings in
Bioinformatics, 22(1), 66-76. https://pubmed.ncbi.nl
m.nih.gov/322270
Phipson, B., Lee, S., Majewski, I. J., Alexander, W. S., &
Smyth, G. K. (n.d.). Robust hyperparameter estimation
protects against hypervariable genes and improves
power to detect differential expression. Nature
Methods. https://www.ncbi.nlm.nih.gov/pmc/articles
Picard, M., Scott-Boyer, P., Bodein, A., Périn, O., & Droit,
A. (2021). Integration strategies of multi-omics data for
machine learning analysis. Computational and
Structural Biotechnology Journal, 19, 3735-3746.
https://doi.org/10.1016/j.csbj.2021.06.030
Piñero, J., Queralt-Rosinach, N., Bravo, À., Deu-Pons, J.,
Bauer-Mehren, A., Baron, M., Sanz, F., & Furlong, L.
I. (2015). DisGeNET: A discovery platform for the
dynamical exploration of human diseases and their
genes. Database: The Journal of Biological Databases
and Curation, 2015. https://doi.org/10.1093/database/
bav028
Piñero, J., Saüch, J., Sanz, F., & Furlong, L. I. (2021). The
DisGeNET cytoscape app: Exploring and visualizing
disease genomics data. Computational and Structural
Biotechnology Journal, 19, 2960-2967. https://doi.org/
10.1016/j.csbj.2021.05.015
Pudjihartono, N., Fadason, T., W., A., & M., J. (2022). A
review of feature selection methods for machine
learning-based disease risk prediction. Frontiers in
Bioinformatics, 2, 927312. https://doi.org/10.3389/
fbinf.2022.927312
Qumsiyeh, E., Showe, L., & Yousef, M. (2022). GediNET
for discovering gene associations across diseases using
knowledge-based machine learning approach. Scientific
Reports, 12(1), 19955. https://doi.org/10.1038/s41598-
022-24421-0
Reel, P. S., Reel, S., Pearson, E., Trucco, E., & Jefferson,
E. (2021). Using machine learning approaches for
multi-omics data analysis: A review. Biotechnology
Advances, 49, 107739. https://doi.org/10.1016/j.bio
techadv.2021.107739
Remeseiro, B., & Bolon-Canedo, V. (2019). A review of
feature selection methods in medical applications.
Computers in Biology and Medicine, 112, 103375.
https://doi.org/10.1016/j.compbiomed.2019.103375
Ritchie, M. E., Phipson, B., Wu, D., Hu, Y., Law, C. W.,
Shi, W., & Smyth, G. K. (2015). limma powers
differential expression analyses for RNA-sequencing
and microarray studies. Nucleic Acids Research, 43(7),
e47. https://doi.org/10.1093/nar/gkv007
Smyth, G. K. (2004). Linear models and empirical Bayes
methods for assessing differential expression in
microarray experiments. Statistical Applications in
Genetics and Molecular Biology, 3(1).
https://doi.org/10.2202/1544-6115.1027
Subramanian, I., Verma, S., Kumar, S., Jere, A., &
Anamika, K. (2020). Multi-omics data integration,
Enhancing the Efficiency of the Grouping-Scoring-Modeling Framework with Statistical Pre-Scoring Component for Transcriptomic Data
Analysis
487

interpretation, and its application. Bioinformatics and
Biology Insights, 14. https://doi.org/10.1177/11779322
19899051
Unlu Yazici, M., Marron, J. S., Bakir-Gungor, B., Zou, F.,
& Yousef, M. (2023). Invention of 3Mint for feature
grouping and scoring in multi-omics. Frontiers in
Genetics, 14, 1093326. https://doi.org/10.3389/fge
ne.2023.1093326
Wang, Z., Lachmann, A., & Ma’ayan, A. (2019). Mining
data and metadata from the Gene Expression Omnibus.
Biophysical Reviews, 11, 103–110. https://doi.org/
10.1007/s12551-018-0490-8
Wekesa, J. S., & Kimwele, M. (2023). A review of multi-
omics data integration through deep learning
approaches for disease diagnosis, prognosis, and
treatment. Frontiers in Genetics, 14.
https://doi.org/10.3389/fgene.2023.1199087
Wong, C. (2019). Big data challenges in genome
informatics. Biophysical Reviews, 11(1), 51-54.
https://doi.org/10.1007/s12551-018-0493-5
Xu, C., & Jackson, S. A. (2019). Machine learning and
complex biological data. Genome Biology, 20, 76.
https://doi.org/10.1186/s13059-019-1689-0
Yousef, M., & Voskergian, D. (2022). TextNetTopics: Text
classification based word grouping as topics and topics’
scoring. Frontiers in Genetics, 13.
Yousef, M., Abdallah, L., & Allmer, J. (2019). maTE:
Discovering expressed interactions between
microRNAs and their targets. Bioinformatics, 35(20),
4020–4028. https://doi.org/10.1093/bioinformatics/btz
204
Yousef, M., Allmer, J., İnal, Y., & Bakir Gungor, B. (2024).
G-S-M: A comprehensive framework for integrative
feature selection in omics data analysis and beyond.
bioRxiv. https://doi.org/10.1101/2024.03.30.585514
Yousef, M., Goy, G., Mitra, R., Eischen, C. M., Jabeer, A.,
& Bakir-Gungor, B. (2021). miRcorrNet: Machine
learning-based integration of miRNA and mRNA
expression profiles, combined with feature grouping
and ranking. PeerJ, 9, e11458. https://doi.org/10.77
17/peerj.11458
Yousef, M., Kumar, A., & Bakir-Gungor, B. (2020).
Application of biological domain knowledge-based
feature selection on gene expression data. Entropy,
23(1), 2. https://doi.org/10.3390/e23010002
Yousef, M., Ozdemir, F., Jaber, A., Allmer, J., & Bakir-
Gungor, B. (2023). PriPath: Identifying dysregulated
pathways from differential gene expression via
grouping, scoring, and modeling with an embedded
feature selection approach. BMC Bioinformatics, 24(1),
60. https://doi.org/10.1186/s12859-023-05187-2
Yousef, M., Ülgen, E., & Uğur Sezerman, O. (2021).
CogNet: Classification of gene expression data based
on ranked active-subnetwork-oriented KEGG pathway
enrichment analysis. PeerJ Computer Science, 7, e336.
https://doi.org/10.7717/peerj-cs.336
Zheng, L., Chao, F., Parthaláin, N. M., Zhang, D., & Shen,
Q. (2021). Feature grouping and selection: A graph-
based approach. Information Sciences, 546, 1256-1272.
https://doi.org/10.1016/j.ins.2020.09.022
BIOINFORMATICS 2025 - 16th International Conference on Bioinformatics Models, Methods and Algorithms
488
