
Unraveling Urban Traffic Congestion Patterns in Bangladesh
Md. Babul Hasan
1 a
and Manash Sarker
2 b
1
Faculty of Computer Sc. and Engr., Patuakhali Sc. and Tech. University, Dumki, Patuakhali, Bangladesh
2
Institute of Information Technology, University of Dhaka, Dhaka, Bangladesh
Keywords:
Traffic Patterns, Seasonal Components, Trend Components, Hierarchical Clustering, Dynamic Time Warping
(DTW).
Abstract:
This research presents a comprehensive study on divisional traffic analysis and clustering in Bangladesh, lever-
aging Google Maps and image processing techniques for traffic intensity data collection across all divisions
from January 2023 to June 2023. A total of 1,39,008 snapshots were captured at 15-minute intervals, yielding
a detailed traffic dataset. We conducted an in-depth analysis of the collected time series data, focusing on its
decomposition into trend, seasonal, and random components (Y = T * S * R). To enhance clustering accu-
racy, we proposed a modification technique by dividing traffic intensity (Y) by the random fluctuations (R)
to minimize random noise in the data preprocessing stage. We implemented Modified Hierarchical Cluster-
ing with Dynamic Time Warping (DTW) for clustering, demonstrating superior similarities-pattern extraction
compared to traditional hierarchical clustering. Our results identified four distinct traffic clusters. This study
provides insights into regional traffic behaviors and offers a robust approach to clustering traffic data, con-
tributing to Bangladesh’s more effective traffic management strategies.
1 INTRODUCTION
Bangladesh is facing rapid growth in urbanization and
motorization, which combine to cause severe traffic
congestion in urban areas of the country. The scenario
has worsened over the last ten years due to the rapid
increase in vehicles and insufficient roads to accom-
modate them (Mahmud et al., 2012). Traffic conges-
tion is a critical problem for a highly populated coun-
try like Bangladesh, where it causes traffic delays,
waste of time, and an increase in vehicle emissions
and fuel usage, leading to environmental and health
problems. Bangladesh has gradually shifted from in-
fectious to non-communicable diseases and injuries
in the past few years (TRL et al., 2004). Limited
resources invested for the development of transport
facilities, the rapid population growth together with
limited space available for new roads, coupled with
the rapid rise in transport demand, the existence of a
vast number of non-motorized vehicles on roads, and
the lack of application of adequate and proper traffic
management schemes are producing severe transport
problems in almost all the urban areas of Bangladesh
(Ali et al., 2023). Urban traffic congestion is a global
a
https://orcid.org/0009-0001-9953-4584
b
https://orcid.org/0009-0009-9622-8352
issue, with local characteristics that affect a city’s
transportation system and people’s everyday lives.
Understanding and detecting congestion on different
roads or areas of a city is very crucial for taking ini-
tiatives to reduce traffic congestion. Identification of
various congestion patterns in a city is a necessary in-
put for traffic management policy or systems. This
includes developing more advanced traffic informa-
tion systems to inform drivers about road conditions,
pricing initiatives, and policy-making. Yet there are
few works on predicting large-scale spatiotemporal
patterns, and even fewer on predicting specific abnor-
mal events such as traffic congestion, despite the in-
terest from transportation researchers and practition-
ers. Machine learning and data mining have recently
become critical methodological drivers for transporta-
tion research. Yet, there is still a lack of consensus on
the best methods to use in many urban transportation
contexts, and few studies have rigorously evaluated a
range of methods. Our research aims to fill this gap
by testing various machine learning methods for spa-
tiotemporal prediction of urban traffic congestion in
Bangladesh. This paper presents a novel approach to
traffic congestion analysis in Bangladesh using a hi-
erarchical clustering method combined with Dynamic
Time Warping (DTW) for time-series data analysis.
Hasan, M. B. and Sarker, M.
Unraveling Urban Traffic Congestion Patterns in Bangladesh.
DOI: 10.5220/0013193600003941
In Proceedings of the 11th International Conference on Vehicle Technology and Intelligent Transport Systems (VEHITS 2025), pages 319-325
ISBN: 978-989-758-745-0; ISSN: 2184-495X
Copyright © 2025 by Paper published under CC license (CC BY-NC-ND 4.0)
319

Our primary contributions are as follows:
• We compiled a comprehensive dataset containing
over 139,000 traffic snapshots collected from all
divisions of Bangladesh over six months (January
2023 to June 2023) using Google Maps and image
processing techniques.
• A data modification method was proposed to en-
hance clustering accuracy by eliminating random
noise from the traffic intensity data, thereby im-
proving the quality of the clustering process.
• We employed a modified hierarchical clustering
algorithm, using DTW as the distance metric in-
stead of traditional Euclidean distance. This ap-
proach significantly improved the alignment of
traffic patterns over time, capturing similarities
between traffic patterns.
This research offers insights into regional traffic
patterns and provides a framework for more effective
traffic management strategies. It enables urban plan-
ners to design tailored congestion mitigation policies
for different areas of Bangladesh. This study inte-
grates advanced clustering techniques with spatiotem-
poral analysis, offering a nuanced understanding of
traffic congestion in rapidly urbanizing contexts like
Bangladesh.
2 RELATED WORK
Urban traffic congestion has been extensively stud-
ied due to its significant impact on transportation ef-
ficiency, economic costs, and quality of life. Re-
searchers have employed various data-driven and
machine-learning methodologies to analyze and man-
age traffic congestion patterns, aiming to develop
effective strategies for urban traffic management.
Xiong introduced an innovative method using Dy-
namic Time Warping (DTW) to detect spatiotempo-
ral propagation patterns of traffic congestion (Xiong
et al., 2023). Analyzing fine-grained vehicle tra-
jectory data reveals how localized congestion events
can propagate across road networks, providing new
insights for managing urban traffic systems. Simi-
larly, Chen employed taxi trajectory data to model
the spread of traffic congestion across neighboring
road segments, offering a method for anticipating and
mitigating congestion through effective traffic control
measures (Chen et al., 2018). Zang applied a self-
organizing map (SOM) to cluster traffic congestion
patterns based on the Traffic Performance Index (TPI)
in Beijing (Zang et al., 2023). The study identified
specific congestion patterns for weekdays, weekends,
and holidays, providing a temporal perspective on
traffic management and policy planning. Kanchana-
mala explored Hadoop-based hierarchical clustering
for large-scale traffic data analysis, demonstrating
how big data analytics can improve the scalability and
efficiency of traffic monitoring and management in
megacities (Kanchanamala et al., 2016). Amb
¨
uhl fur-
ther contributed by analyzing macroscopic fundamen-
tal diagrams (MFDs) to track urban traffic rhythms
over time, providing insights into long-term traffic
management strategies (Amb
¨
uhl et al., 2021). Wang
proposed a Spatio-Temporal Non-Negative Matrix
Factorization (ST-NMF) approach to address the chal-
lenges of analyzing noisy, high-dimensional data in
large-scale urban networks (Wang et al., 2021). ST-
NMF enhances traffic data reconstruction and pre-
dicts future traffic states by decomposing traffic states
into spatial and temporal patterns. This approach pro-
vides a robust framework for managing intelligent
transportation systems through a clearer understand-
ing of spatio-temporal traffic dynamics. Akbar con-
ducted a comprehensive analysis of traffic speeds in
1,200 cities across 152 countries, revealing that cities
in more affluent countries tend to have faster travel
speeds due to their larger urban areas and more ex-
tensive road infrastructure (Akbar et al., 2023b). The
study found that uncongested speed, rather than con-
gestion reduction, is the primary driver of faster travel
speeds in wealthier countries. This finding under-
scores the importance of infrastructure investment in
improving urban mobility. Li employed a weighted
K-means clustering method to analyze traffic conges-
tion patterns in Beijing, focusing on the effects of ur-
ban policies such as vehicle license plate restrictions
(Li et al., 2023). Their study illustrates the poten-
tial of big data analytics for identifying spatial and
temporal congestion patterns across different city dis-
tricts, contributing valuable insights for traffic man-
agement strategies. Akbar investigated traffic conges-
tion in Indian cities using simulated trip data, finding
that uncongested speed plays a more significant role
than congestion in determining travel speed differ-
ences across cities (Akbar et al., 2023a) . This chal-
lenges conventional beliefs that traffic management
efforts should focus primarily on reducing conges-
tion instead of emphasizing the need for infrastruc-
ture development. In the context of Bangladesh, our
study builds upon these methodologies by employing
a hierarchical clustering approach combined with Dy-
namic Time Warping (DTW) to analyze urban traf-
fic patterns. This research collected traffic intensity
data using Google Maps data and image processing
techniques across all divisions of Bangladesh, identi-
fying four distinct traffic clusters. By enhancing the
clustering accuracy with a noise reduction technique,
VEHITS 2025 - 11th International Conference on Vehicle Technology and Intelligent Transport Systems
320
the study provides a robust approach to understand-
ing regional traffic behaviors. It contributes valuable
insights for more effective traffic management strate-
gies in Bangladesh.
3 METHODOLOGY
3.1 Data Collection Strategy
Traffic intensity data were collected from all divisions
in Bangladesh using a Google Maps data and image
processing system. The data acquisition process in-
volved capturing traffic snapshots at 15-minute inter-
vals, leading to a comprehensive dataset of 1,39,008
snapshots. To capture traffic conditions across all di-
visions in Bangladesh, we employed a systematic data
collection approach using GPS-enabled imaging tech-
nology.
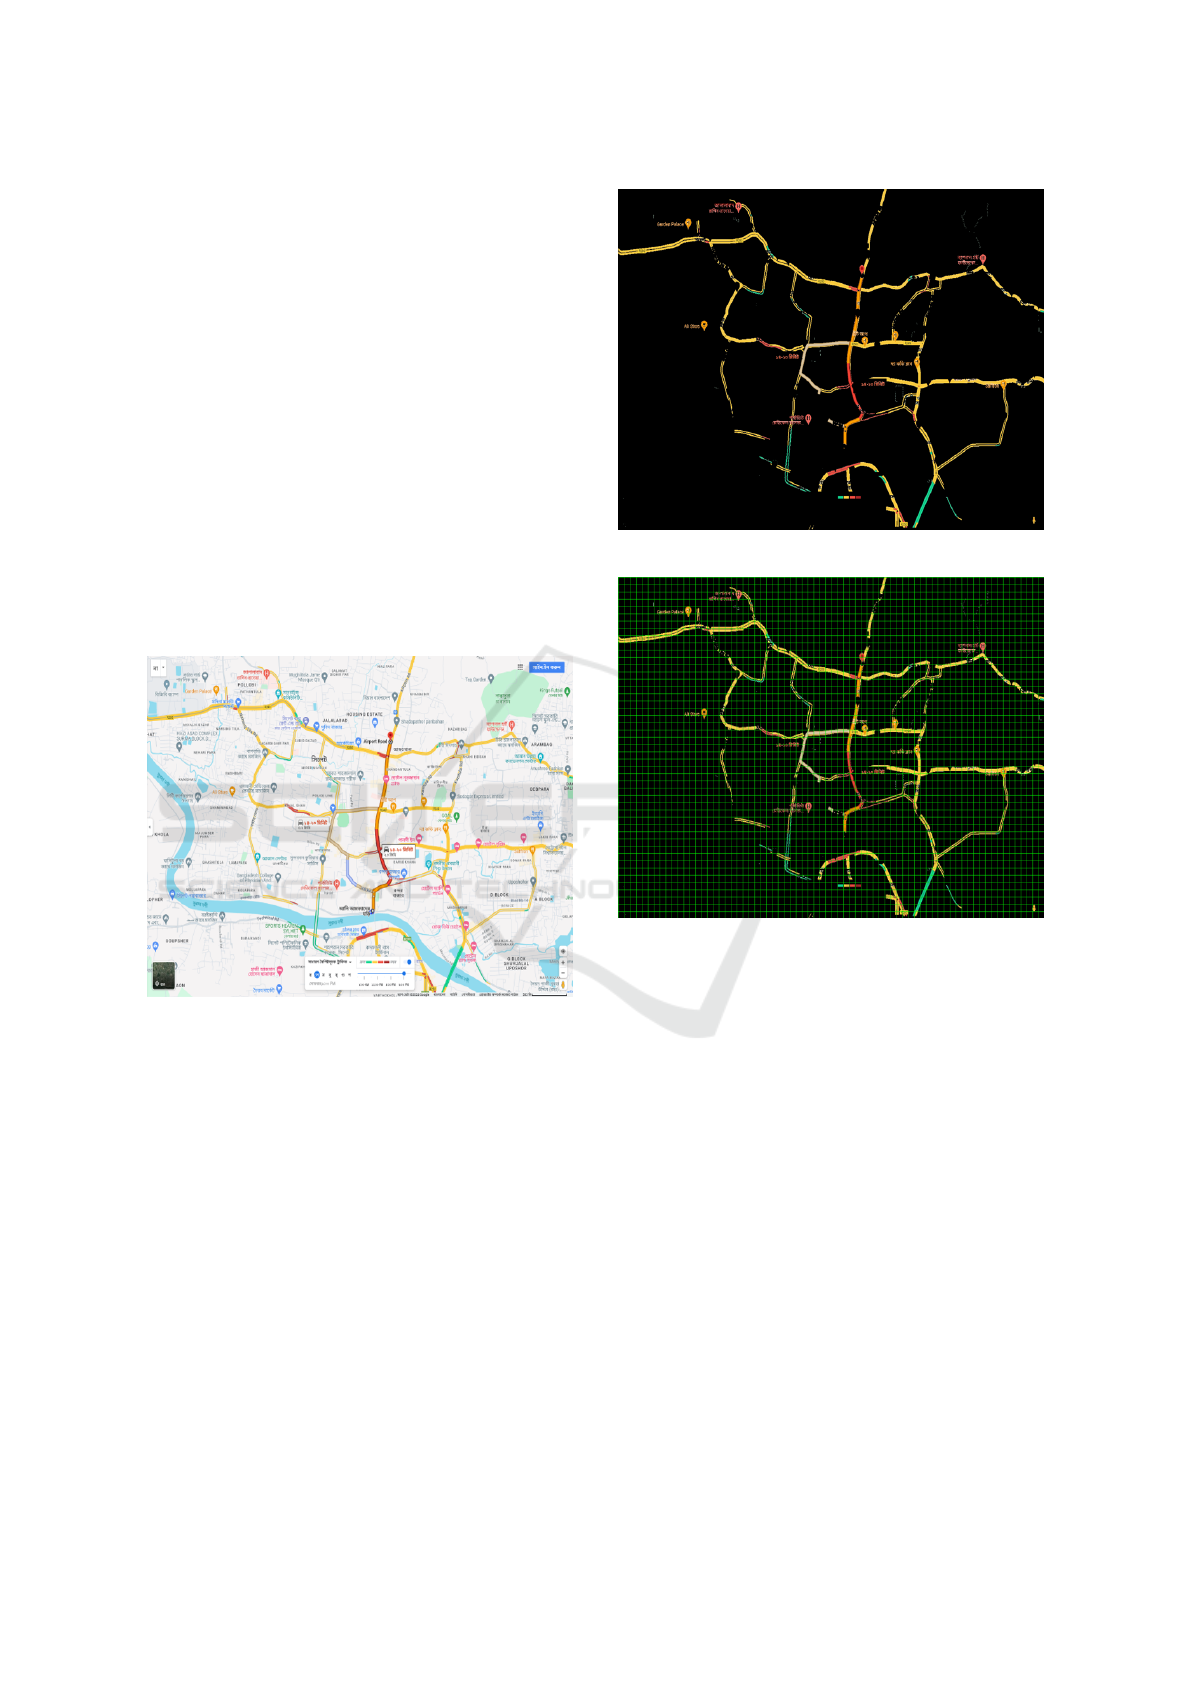
Figure 1: Traffic Snapshot.
The process began with capturing snapshots of
traffic using Google Maps to obtain geolocated im-
ages of roads under study, as shown in Fig. 1. To
ensure that only the relevant portions of the road were
analyzed, each image was cropped to a standardized
size of 940x1440 pixels, focusing on the areas most
pertinent to traffic flow and intensity.
A color masking technique was then applied to
isolate traffic-related elements. Red, yellow, and
green were highlighted, representing varying levels of
traffic intensity, while all other colors were converted
to black. This step effectively emphasized traffic den-
sity and flow information in Fig. 2.
Then, the images were subsequently divided into
smaller segments in Fig. 3 using a grid-based ap-
proach, splitting each image into 3,384 grid cells of
20x20 pixels each, facilitating more granular analy-
Figure 2: Masked Image.
Figure 3: Image splitted to grid.
sis. Each grid cell’s traffic intensity was determined
based on the dominant color, assigning values Red =
3, Yellow = 2, Green = 1, and Black = 0. The over-
all traffic intensity of each snapshot was computed by
summing the intensity values across all grid cells.
This method allowed us to quantify and ana-
lyze traffic patterns systematically, creating a com-
prehensive dataset that accurately reflects traffic con-
ditions across the targeted regions. This approach
provides detailed temporal resolution, capturing the
variability and complexity of traffic conditions across
Bangladesh.
3.2 Time Series Analysis and
Modification
The collected time series data were analyzed using
Harvey’s multiplicative formula Y=T×S×R (Harvey,
1990) . Y represents traffic intensity, T denotes the
trend component, S signifies the seasonal component,
Unraveling Urban Traffic Congestion Patterns in Bangladesh
321
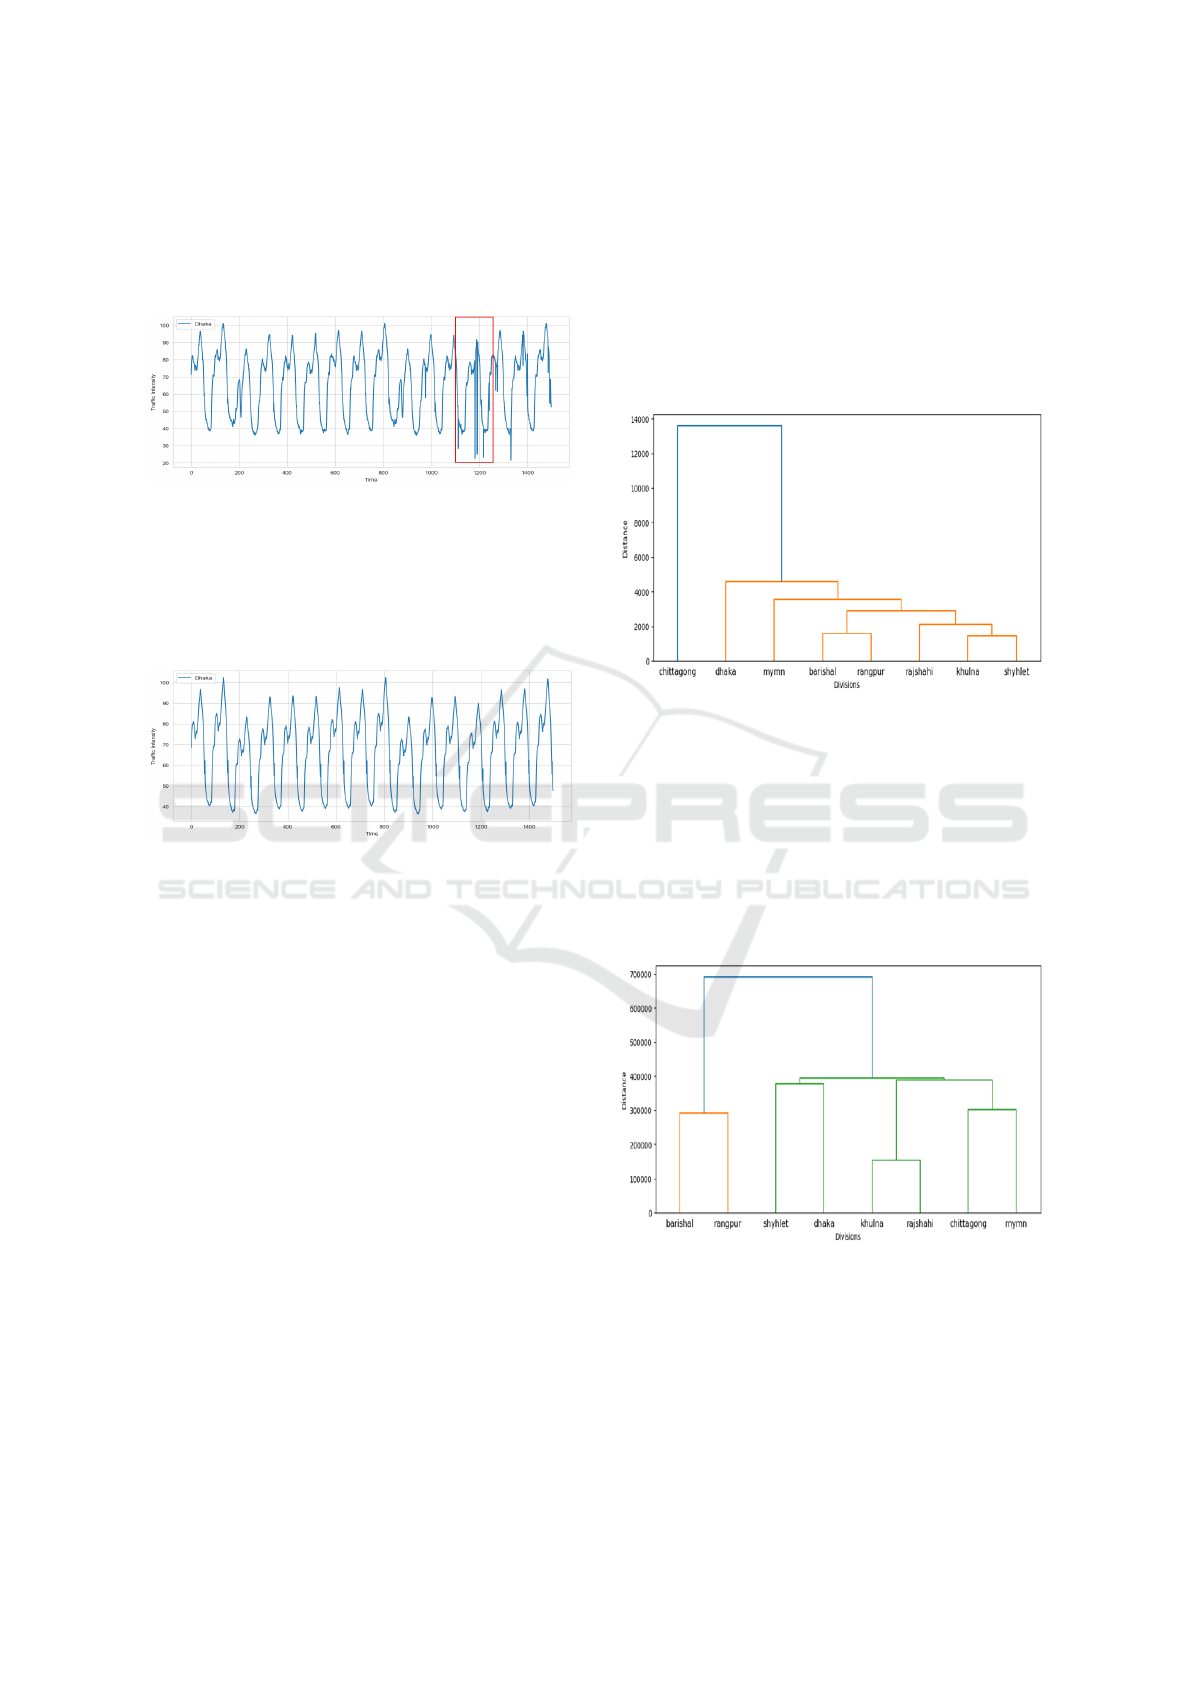
and RR accounts for random fluctuations(Zhao and
Hu, 2019). This decomposition allowed for a detailed
examination of the underlying patterns in the traffic
data, distinguishing systematic changes from irregu-
lar variations.
Figure 4: Traffic intensity with random fluctuation.
A novel data modification approach was intro-
duced to enhance clustering accuracy. This involved
dividing the observed traffic intensity (Y) by the ran-
dom component (R), effectively minimizing the im-
pact of random noise on the data.
Figure 5: Fluctuation reduced after data modification.
Since random fluctuations occur unpredictably,
they behave like outliers within the traffic pattern, ob-
scuring the true underlying trends and seasonal vari-
ations, as shown in Fig. 4. Treating these random
changes as outliers and reducing their impact in Fig.
5 and made it easier to see the consistent traffic pat-
terns, which improved the clustering process.
3.3 Modified Hierarchical Clustering
with DTW
Hierarchical clustering is a cluster analysis tech-
nique that constructs a hierarchy of clusters. It is
a widely utilized tool in data analysis to group and
distinguish similar data points from dissimilar ones.
This approach organizes data into clusters of homo-
geneous variables. Each data point is sequentially
merged or split in hierarchical clustering, creating
nested clusters forming a tree-like structure, visu-
ally representing the data’s inherent grouping pat-
terns(Kanchanamala et al., 2016).
In this study, we employed Modified Hierarchi-
cal Clustering with Dynamic Time Warping (DTW)
as the distance metric instead of the traditional Eu-
clidean distance as shown in Fig. 6 and Fig. 7. DTW
is particularly effective for time series data because it
accommodates temporal distortions. It allows for the
alignment of sequences that may vary in speed or tim-
ing but share similar underlying patterns(Xiong et al.,
2023)(Muller, 2007). This capability makes DTW su-
perior for clustering tasks where recognizing tempo-
ral patterns accurately is crucial.
Figure 6: General hierarchical clustering using Euclidean
distance.
DTW provides a more robust clustering outcome
by aligning data points dynamically, thereby captur-
ing subtle temporal shifts that conventional hierarchi-
cal clustering methods might overlook. This approach
effectively identified four primary clusters, each re-
flecting distinct regional traffic behaviors, demon-
strating its efficacy in extracting meaningful patterns
from complex time series data.
Figure 7: Modified hierarchical clustering using DTW dis-
tance.
By leveraging DTW, we achieved a more nuanced
understanding of traffic intensity variations across dif-
ferent regions, facilitating improved traffic manage-
ment strategies.
VEHITS 2025 - 11th International Conference on Vehicle Technology and Intelligent Transport Systems
322
4 TRAFFIC CLUSTERS AND
THEIR CHARACTERISTICS
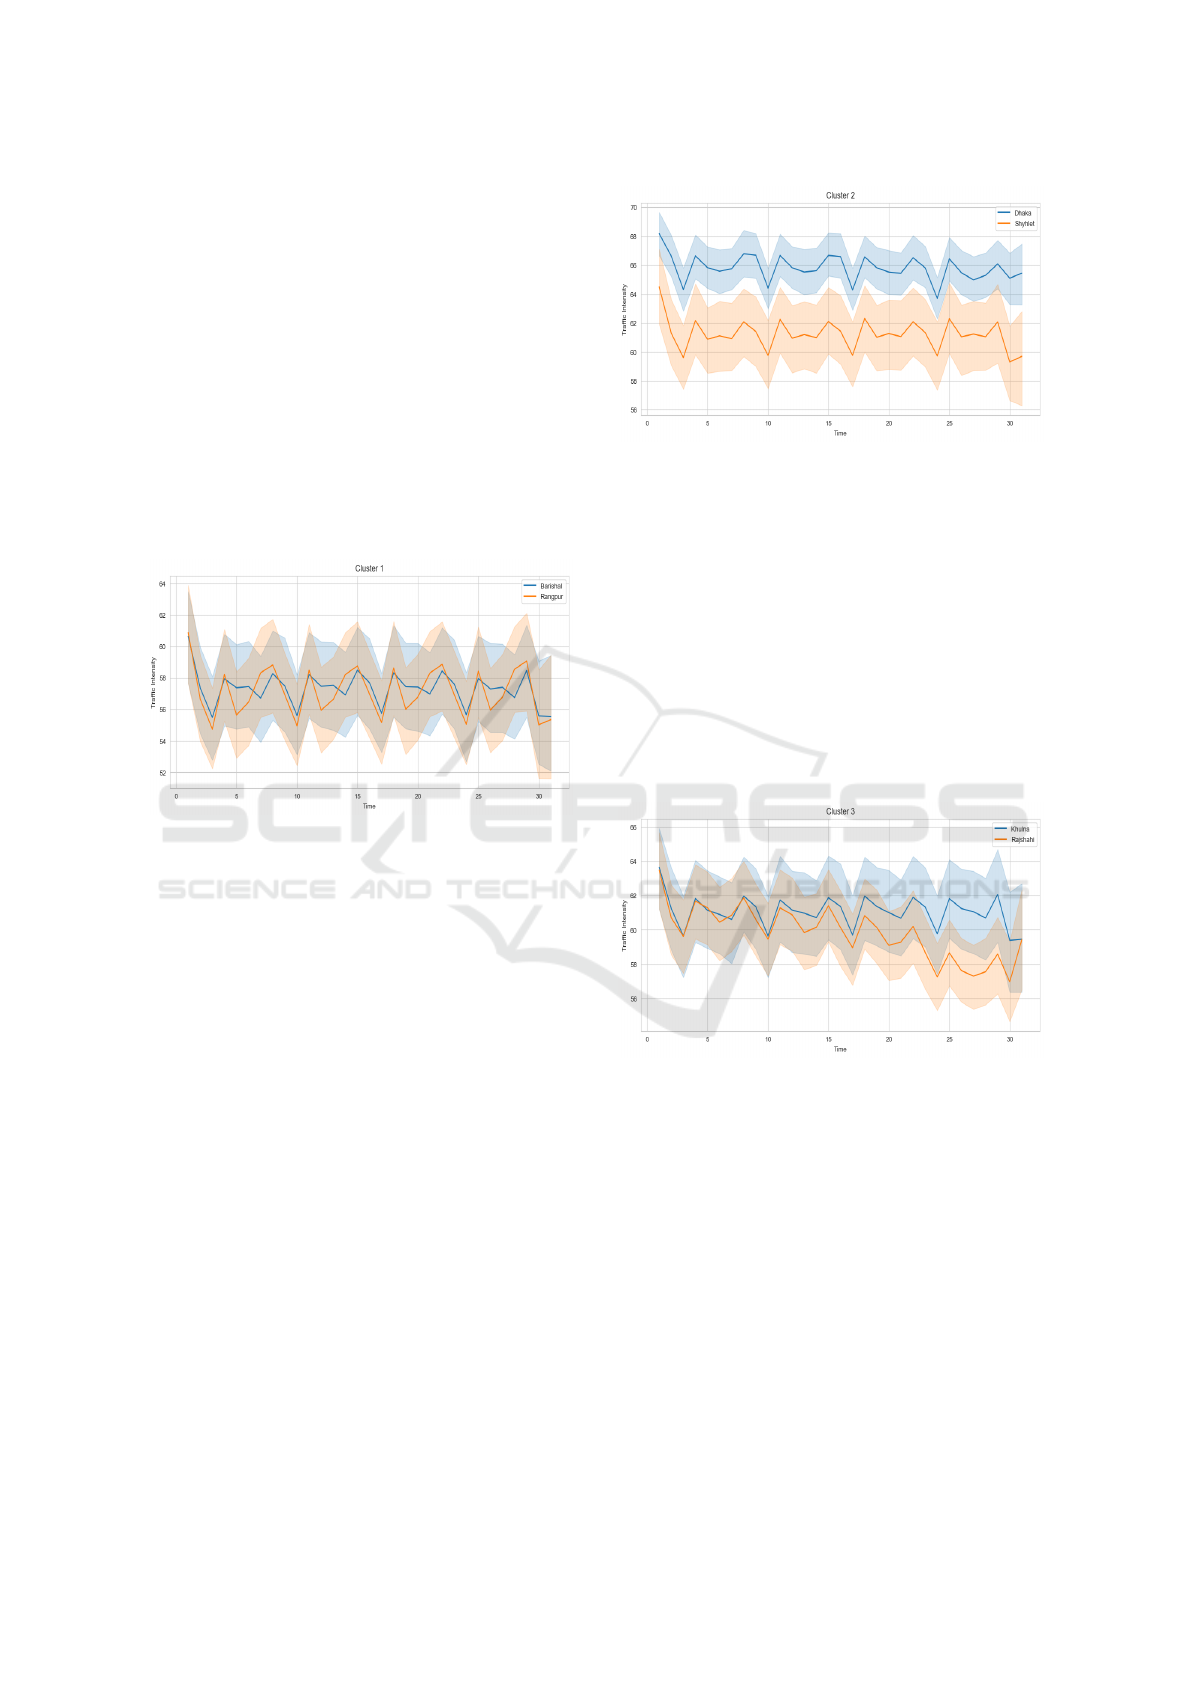
4.1 Cluster 1 (Barishal and Rangpur)
This cluster generally shows moderate traffic inten-
sity levels, oscillating fast. As shown in Fig. 8,
both regions have similar traffic patterns character-
ized by regular fluctuations, indicating a mix of mod-
erate congestion. There is noticeable variability in
traffic intensity within the cluster, with confidence in-
tervals indicating periodic highs and lows. The in-
tensity pattern in Cluster 1 is characterized by recur-
ring peaks and dips, suggesting intermittent conges-
tion and clearance periods.
Figure 8: Cluster 1 (Barishal and Rangpur).
Moderate, cyclical intensity patterns characterize
cluster 1. Traffic intensity consistently oscillates with
regular peaks and troughs, indicating periodic conges-
tion and clearance cycles. The intensity does not show
extreme highs or lows, suggesting moderate traffic
conditions that are relatively balanced between the
two regions. This cluster’s pattern is more dynamic
than Clusters 2 and 4, showing regular fluctuations in
intensity that are neither too high nor too low, indicat-
ing mid-level congestion.
4.2 Cluster 2 (Dhaka and Sylhet)
Cluster 2 displays a relatively steady intensity pattern,
mainly dominated by Dhaka’s higher and more con-
sistent congestion levels. Sylhet shows slight variabil-
ity, but overall, the intensity pattern remains stable
compared to other clusters. Fig. 9 suggests ongoing,
high-intensity traffic without pronounced variations,
reflecting the urban nature of the areas in this cluster.
Cluster 2 has the highest and most stable inten-
sity pattern among all clusters, especially compared to
Clusters 1 and 3, where fluctuations are more promi-
nent. The steady pattern in Cluster 2 contrasts with
the oscillating and variable patterns observed else-
Figure 9: Cluster 2 (Dhaka and Sylhet).
where. This suggests that Cluster 2 represents areas
with higher urban congestion.
4.3 Cluster 3 (Khulna and Rajshahi)
In Fig. 10, we see moderate oscillations mark the in-
tensity pattern in Cluster 3, similar to Cluster 1 but
with slightly higher peaks. Khulna and Rajshahi show
recurring rising and falling intensity patterns, suggest-
ing regular but somewhat more pronounced conges-
tion phases than Cluster 1. The traffic intensity re-
mains moderate, with some variability but without ex-
treme changes.
Figure 10: Cluster 3 (Khulna and Rajshahi).
Cluster 3’s pattern is similar to Cluster 1 in vari-
ability but generally presents slightly higher intensi-
ties. This cluster stands between the more stable,
high-intensity patterns of Cluster 2 and the distinct,
contrasting patterns of Cluster 4.
4.4 Cluster 4 (Mymensingh and
Chittagong)
This cluster exhibits the most divergent intensity pat-
terns within a single cluster, as shown in Fig. 11.
Chittagong shows consistently high intensity with
minimal fluctuations. At the same time, Mymensingh
displays significantly lower intensity with more vari-
Unraveling Urban Traffic Congestion Patterns in Bangladesh
323

ability. This stark contrast highlights a unique pattern
where one area remains persistently congested, and
the other experiences low and variable traffic inten-
sity.
Figure 11: Cluster 4 (Mymensingh and Chittagong).
Cluster 4 is unique due to the significant dispar-
ity between its two regions. Unlike the other clusters,
where intensity patterns are somewhat synchronized,
Cluster 4 reflects two extremes—high, stable conges-
tion in Chittagong and lower, more fluctuating condi-
tions in Mymensingh.
5 RESULTS AND ANALYSIS
After analyzing the clusters, we found that Clus-
ter 2-(Dhaka and Sylhet) has the most stable and
high traffic intensity, indicating sustained congestion
typical of dense urban areas. Clusters 1-(Barishal
and Rangpur) and 3-(Khulna and Rajshahi) display
moderate oscillating patterns, with Cluster 3 having
slightly higher peaks. Cluster 4-(Mymensingh and
Chittagong) shows the most contrasting patterns, re-
flecting two distinct traffic conditions.
Clusters 1 and 3 show rhythmic, periodic fluctu-
ations in intensity, indicative of mixed traffic condi-
tions that alternate between congestion and clearance.
In contrast, Cluster 2 maintains a steady pattern; these
regions experience periodic congestion that alternates
with periods of clearance, indicating a less severe but
still notable traffic issue. Cluster 4 captures high-
stability and low-variability extremes within its re-
gions. This stark contrast highlights the diverse urban
and infrastructural dynamics within the same clus-
ter, requiring tailored solutions to manage high and
low traffic conditions efficiently. Cluster 2 best repre-
sents consistently congested urban traffic, while Clus-
ter 4 effectively highlights contrasting traffic dynam-
ics, making it the most diverse cluster regarding inten-
sity patterns. Clusters 1 and 3 provide insights into
moderate, variable traffic conditions typical of areas
with balanced urban and rural influences.
6 CONCLUSIONS
This study examined traffic congestion patterns across
various divisions in Bangladesh using a hierarchi-
cal clustering approach combined with dynamic time
warping for time series analysis. The research utilized
a comprehensive dataset comprising 121,632 traffic
snapshots collected over six months. To enhance the
data quality, we proposed a data modification tech-
nique to eradicate random fluctuation in traffic inten-
sity in data preprocessing. These modifications en-
abled a refined classification of traffic congestion lev-
els.
The analysis identified distinct traffic patterns
across different clusters, highlighting the variability
in congestion between urban and mixed urban-rural
areas. Traditional distance metrics, such as Euclidean
distance, were found to be less effective in capturing
the temporal dynamics of traffic data. Instead, dy-
namic time warping was employed to align time se-
ries data more accurately, allowing the identification
of unique congestion behaviors in each cluster, rang-
ing from stable high-intensity traffic in urban settings
to fluctuating patterns in less urbanized regions.
By modifying and analyzing the data effectively,
the study provides a robust framework for understand-
ing traffic patterns, aiding urban planners and traffic
management authorities in developing targeted con-
gestion mitigation strategies. Future research could
build upon these methods by integrating real-time
traffic data and exploring advanced clustering tech-
niques to enhance traffic pattern analysis and predic-
tive accuracy in diverse urban environments.
REFERENCES
Akbar, P., Couture, V., Duranton, G., and Storeygard, A.
(2023a). Mobility and congestion in urban india.
American Economic Review, 113(4).
Akbar, P. A., Couture, V., Duranton, G., and Storeygard, A.
(2023b). The fast, the slow, and the congested: Urban
transportation in rich and poor countries. Technical
report, National Bureau of Economic Research.
Ali, Y., Rafay, M., Khan, R. D. A., Sorn, M. K., and Jiang,
H. (2023). Traffic problems in dhaka city: causes,
effects, and solutions (case study to develop a business
model). Open Access Library Journal, 10(5):1–15.
Amb
¨
uhl, L., Loder, A., Leclercq, L., and Menendez, M.
(2021). Disentangling the city traffic rhythms: A lon-
gitudinal analysis of mfd patterns over a year. Trans-
VEHITS 2025 - 11th International Conference on Vehicle Technology and Intelligent Transport Systems
324

portation Research Part C: Emerging Technologies,
126:103065.
Chen, Z., Yang, Y., Huang, L., Wang, E., and Li, D. (2018).
Discovering urban traffic congestion propagation pat-
terns with taxi trajectory data. IEEE Access, 6:69481–
69491.
Harvey, A. C. (1990). Forecasting, structural time series
models and the kalman filter.
Kanchanamala, P., Vineela, V., and Neelima, G. (2016).
Traffic data analysis using hadoop based hierarchical
clustering.
Li, X., Gui, J., and Liu, J. (2023). Data-driven traffic con-
gestion patterns analysis: A case of beijing. Journal
of Ambient Intelligence and Humanized Computing,
14(7):9035–9048.
Mahmud, K., Gope, K., and Chowdhury, S. M. R. (2012).
Possible causes & solutions of traffic jam and their
impact on the economy of dhaka city. J. Mgmt. &
Sustainability, 2:112.
Muller, M. (2007). Dynamic time warping in information
retrieval for music and motion. Dynamic time warping
Information retrieval for music and motion, pages 69–
84.
TRL, M. A. A.-T., Sexton, G. J. T. M. B., Gururaj, G., and
Rahman, F. (2004). The involvement and impact of
road crashes on the poor: Bangladesh and india case
studies.
Wang, Y., Zhang, Y., Wang, L., Hu, Y., and Yin, B. (2021).
Urban traffic pattern analysis and applications based
on spatio-temporal non-negative matrix factorization.
IEEE transactions on intelligent transportation sys-
tems, 23(8):12752–12765.
Xiong, H., Zhou, X., and Bennett, D. A. (2023). Detecting
spatiotemporal propagation patterns of traffic conges-
tion from fine-grained vehicle trajectory data. Interna-
tional Journal of Geographical Information Science,
37(5):1157–1179.
Zang, J., Jiao, P., Liu, S., Zhang, X., Song, G., and Yu, L.
(2023). Identifying traffic congestion patterns of ur-
ban road network based on traffic performance index.
Sustainability, 15(2):948.
Zhao, P. and Hu, H. (2019). Geographical patterns of traffic
congestion in growing megacities: Big data analytics
from beijing. Cities, 92:164–174.
Unraveling Urban Traffic Congestion Patterns in Bangladesh
325
