
A Highly Nonlinear Survival Network for Hospital Readmission
Prediction of Cardiac Patients
Yuejing Zhai
1 a
, Yiping Li
2
, Lihua He
1
and Wuman Luo
1
1
Macao Polytechnic University, Macao, China
2
Macau University of Science and Technology, Macao, China
Keywords:
Survival Network, Hospital Readmission, Cardiac Patients.
Abstract:
Hospital readmission prediction of cardiac patients is an increasingly important survival analysis problem
these days. So far, three groups of methods for cardiac readmission have been proposed: statistical-based,
machine learning-based and deep learning-based. However, the assumptions of the statistical-based methods
limit their practicality in real-world applications. The traditional machine learning-based methods suffer from
the problem of over-reliance on feature engineering. Deep learning-based methods can be further classified
into two groups in terms of how they deal with first hitting times: discrete strategy-based and continuous
strategy-based. It is nontrivial for the discrete strategy-based methods to find the optimal granularity of out-
put time intervals. The continuous strategy-based methods assume nonlinear proportional hazards condition,
which often limits the model performance in practical applications. Besides, existing deep learning-based
methods still have room for improvement in calculating the mean value of fitted dropout models. To address
these issues, in this paper, we propose a highly nonlinear survival network called Environment-Aware Max-
out Deep Survival Neural Network (EMaxSurv) to predict the risk value of hospital readmission of cardiac
patients. EMaxSurv is based on a key observation that environmental conditions have a significant impact
on the health of cardiac patients. The basic idea of EMaxSurv is to adopt maxout deep networks combined
with environmental information to better capture the relationship between covariates and the distribution of
the first-hitting times. To evaluate the proposed model, we conduct extensive experiments on three real world
datasets. The experimental results show that EMaxSurv outperforms the other baselines in all three datasets.
1 INTRODUCTION
Hospital readmission prediction is a widely recog-
nised survival analysis problem which aims to pre-
dict the likelihood of a patient experiencing hospital
readmission before a specific time. Effective predic-
tion of hospital readmission has many benefits, such
as improving medical treatment plans, reducing the fi-
nancial burden of both patients and governments, op-
timising hospital resource arrangements, etc. Accord-
ing to the study report (Heidenreich et al., 2022) of the
American Heart Association (AHA) in 2022, millions
of people worldwide are hospitalised for acute heart
failure each year. The report shows that the risk of
readmission within one month after discharge is 20%,
the risk of death is 5%, the risk of readmission within
one year after discharge is 60%, and the risk of death
is 25%, and these data are on an upward trend (Joglar
a
https://orcid.org/0000-0001-7877-2375
et al., 2024). In this paper, we focus on hospital read-
mission prediction of cardiac patients.
Existing methods for predicting readmission can
be divided into three categories: statistical-based,
machine learning-based and deep learning-based.
Statistical-based models mainly adopted statistical
methods such as Kaplan-Meier estimator (KM) (Ka-
plan and Meier, 1958) and Cox (Cox, 1972). How-
ever, statistical methods usually assume that the log
risk of patient readmission is a linear combination
of patient covariates (i.e., linear proportional hazards
condition) or can only analyse a single factor at a
time, which is too simple and impractical in real-
world applications. Machine learning-based mod-
els (Zhai et al., 2023) usually utilise machine learn-
ing methods to do readmission prediction, and do
not assume the linear proportional hazards condi-
tion. However, when dealing with complex nonlinear
survival data, the performance of machine learning-
based methods often suffers from severe degradation
Zhai, Y., Li, Y., He, L. and Luo, W.
A Highly Nonlinear Survival Network for Hospital Readmission Prediction of Cardiac Patients.
DOI: 10.5220/0013195300003944
In Proceedings of the 10th International Conference on Internet of Things, Big Data and Security (IoTBDS 2025), pages 183-190
ISBN: 978-989-758-750-4; ISSN: 2184-4976
Copyright © 2025 by Paper published under CC license (CC BY-NC-ND 4.0)
183

due to over-reliance on feature engineering.
Deep learning-based models have superior ability
in automatic feature detection, and they focus on de-
tect the relationship between covariates and the dis-
tribution of first-hitting times, i.e., the risk of hospi-
tal readmission. Specifically, there are two different
ways in dealing with first hitting times: discrete strat-
egy and continuous strategy. Discrete strategy (Lee
et al., 2018) transforms the first hitting times into pre-
defined discrete intervals. However, this approach in-
conveniently introduces a trade-off between the num-
ber of parameters and the granularity of the output
time intervals, which increases the training difficulty.
On the contrary, the continuous strategy (Katzman
et al., 2018) regards the variation of first-hitting times
as a continuous variable, thereby avoiding the afore-
mentioned problem. However, continuous strategy-
based models assume that the log risk of patient read-
mission is a nonlinear combination of patient covari-
ates. This assumption often results in suboptimal per-
formance in many application scenarios (Gensheimer
and Narasimhan, 2019). The reason is that the ex-
isting continuous strategy-based models cannot fit the
non-linear relationship between covariates and first-
hitting time distribution well.
Another problem of the deep learning-based cat-
egory is that most of them contain dropout layers,
which are essentially the mean of multiple neural net-
works. However, these models typically use curved
activation functions almost everywhere, resulting in
lower accuracy. In addition, some studies (Mi
ˇ
si
´
c
et al., 2020) (Chen et al., 2022) treat the readmis-
sion prediction as a traditional classification problem.
The major problem of these studies is that they can-
not fully utilise the patient information. For exam-
ple, these studies often remove information about the
patients who died during hospitalisation. However,
information on patients who died often helps predict
readmission rates. Last, existing readmission mod-
els fail to note the impact of environmental conditions
on the physical well-being of cardiac patients, which
limits the performance of the models.
To address the above issues, in this paper, we
propose a highly nonlinear survival network called
Environment-Aware Maxout Deep Survival Neural
Network (EMaxSurv) to predict the risk value of hos-
pital readmission of cardiac patients. The basic idea
is to adopt maxout deep networks (Goodfellow et al.,
2013) combined with environmental information to
better capture the relationship between covariates and
the distribution of the first-hitting times. The max-
out network has a more powerful nonlinear modelling
ability. It can fit any convex function and learn more
complex features and patterns without using nonlin-
ear activation functions. Thus, the linear and max-
imisation operations in the maxout network allow the
dropout’s fitted model to be averaged with high ac-
curacy. Additionally, the multiple activation paths of
the maxout network act like a built-in regularization
mechanism, helping to reduce the risk of over fitting
the model.
Besides, EMaxSurv is based on a key observation
that environmental conditions have a significant im-
pact on the health of cardiac patients. For example,
high ambient temperatures can increase the patient’s
metabolism, blood flow, and heart’s demand for oxy-
gen, thereby increasing the burden on the heart (Bai
et al., 2018) (Schwartz et al., 2004). Conversely, low
ambient temperatures can narrow blood vessels and
increase vascular resistance, thereby increasing the
risk of hypertension and blood clots (Pan et al., 1995).
To the best of our knowledge, we are the first to use
environmental information for hospital readmission
prediction of heart disease patients.
In summary, the main contributions of this paper
are listed as follows:
• We propose a network called EMaxSurv for hos-
pital readmission prediction of heart disease pa-
tients. The EMaxSurv consists of two modules:
preprocessing and MaxSurv.
• We proposed to utilise the maxout network and
the environmental information to better detect the
relationship between covariates and the distribu-
tion of first-hitting times.
• We validated the performance of EMaxSurv and
MaxSurv on three real-world datasets. Experi-
mental results show that EMaxSurv outperforms
the baseline, with a c-index improvement of 33%
compared to the best baseline model.
The remainder of this paper is organised as fol-
lows. Section 2 presents the related work. Section 3
describes the components of EMaxSurv in detail. In
Section 4, we evaluate the performance of EMaxSurv
in real-world datasets. We conclude the paper in Sec-
tion 5.
2 RELATED WORK
Statistical-Based Survival Method: One of the
first survival models that began to be used was
the Kaplan-Meier estimator (KM), a non-parametric
technique. Pepe (Pepe and Fleming, 1989) introduced
the weighted Kaplan-Meier statistic as a distance test
for a class of censored data, providing a new perspec-
tive for analysing survival data. However, the KM
IoTBDS 2025 - 10th International Conference on Internet of Things, Big Data and Security
184

method can only analyse a single factor, cannot simul-
taneously consider the effects of multiple risk factors,
and may produce unstable estimates for small samples
and low event count data.
In contrast, the Cox proportional risk model can
incorporate multiple risk factors simultaneously. The
Cox model is the most commonly used regression
analysis method for survival data. It is based on the
proportional hazards assumption and uses partial
likelihood for parameter estimation. Grzyb (Model,
2017) extended the Cox proportional risk model
with multitask learning by exploring alternatives to
existing models. However, Statistical methods often
assume a linear combination of patient covariates
or can only analyze a single factor, making them
impractical for real-world applications.
Machine Learning and Deep Learning-Based
Models: Assuming a linear function is too simplis-
tic. Therefore, the survival model must accurately fit
the survival data to the nonlinear log hazard function.
Support Vector Machine (SVM) (Van Belle et al.,
2011) is a supervised learning method, mainly used
for classification, but can also be modified for regres-
sion problems, however, the disadvantage of this ap-
proach is that the information contained in the cen-
sored instances will be completely ignored. Random
Survival Forest (RSF) (Ishwaran et al., 2008) extends
the random forest method by using a forest of survival
trees for prediction. DeepSurv and its variants predic-
tive and modelling capabilities will enable medical re-
searchers to use deep neural networks to explore the
impact of patient characteristics on their risk of fail-
ure. DeepHit builds a deep network to directly learn
the distribution of discrete time first to hit. However,
discretising the first hitting time will increase the dif-
ficulty of training, and it is necessary to measure the
relationship between the time step and the amount of
network parameters.
The common goal of statistical methods and ma-
chine learning & deep learning methods is to pre-
dict survival time and estimate the survival probabil-
ity at the estimated survival time. However, statisti-
cal methods focus more on characterizing the distri-
bution of event times and the statistical properties of
parameter estimation by estimating survival curves,
while machine learning & deep learning methods fo-
cus more on predicting the occurrence of events at
a given time point by combining traditional survival
analysis methods with various machine learning tech-
niques.
3 METHODOLOGY
In this section, we first give the formalised descrip-
tion of the problem of readmission prediction of heart
disease patients. Then, we describe the main modules
and loss functions of EMaxSurv in detail. Finally, we
introduce the loss function.
3.1 Problem Formulation
When studying the survival analysis problem, there
may be cases where the event of interest is not ob-
served. This concept is called censoring, which can
be divided into three categories:
• Right-censored, the observed survival time is less
than the true survival time.
• Left-censored, the observed survival time is
greater than the true survival time.
• Interval-censored, only the event is known to oc-
cur within a given time interval.
Right-censored is the most common case, our
research is also based on right-censored data. In
our work, we use survival data as input for EMaxSurv.
Survival Data: Survival data consist of three types
of information for each patient: 1) observed covari-
ates (demographic information, physical condition,
and past treatments), 2) time elapsed since the covari-
ates were collected, and 3) an indication of the labels
for the type of event (e.g., readmission event).
Let ”0” denote the right censoring. Let S =
{
0,1,··· , 1
}
be the set of events. Each record can be
denoted as r
i
= (x,t, s), where x = {x
1
,x
2
,··· , x
d
} is
covariates, t is the time interval from the beginning of
the observation to the occurrence of the event or the
end of the observation, and s is the label that marks
whether censoring occurs during t. Thus we denote
the patient survival data R below.
R =
r
1
.
.
.
r
o
=
x
1,1
··· x
1,d
t
1
s
1
.
.
.
x
o,1
... x
o,d
t
o
s
o
(1)
Problem Statement: Given survival data R =
(r
1
,r
2
,··· , r
o
)
T
, r
k
and time interval d
t
, the problem
of cardiac patient readmission prediction is to predict
the risk of readmission λ(R, r
k
,d
t
) for the correspond-
ing cardiac patient of r
k
within d
t
after being dis-
charged from the hospital. The higher the risk value,
the greater the likelihood that the patient will be read-
mitted to the hospital within d
t
after discharge.
A Highly Nonlinear Survival Network for Hospital Readmission Prediction of Cardiac Patients
185

3.2 EMaxSurv
The MaxSurv predicts the effect of a patient’s covari-
ates on their hazard rate, which is parameterized by
the network weights θ. Figure 1 illustrates the main
structure of EMaxSurv.
Data Preprocessing: In this module, we first pre-
process each record r
i
of R. Then, we organ-
ise the preprocessed results into a matrix shown
in equation 1 in Section 3.1. To determine the
season of each patient’s admission, we use the
year and month of the admission time to clas-
sify them. For the record with admission time
Doa = {2018/1/12,2018/5/1,2018/10/0}, we con-
struct the season vector Season = {1,2, 3}. Mean-
while, based on the year and month information of
each record, we collect the temperature data of the
corresponding time in the local area of the hospital
from the Internet and construct three vectors of max-
imum temperature, minimum temperature. Specif-
ically, for the record with admission time Doa =
{2018/1/12,2018/5/1,2018/10/0}, we construct
the maximum temperature max −temp = {8, 35, 20},
minimum temperature min −temp = {−3,8, 18}, and
temperature difference di f f −temp = {11, 27, 2}. In
addition, we categorise patients according to their age
data.
As a result, the data we feed into module (b) is as
follows:
b
R =
R
′
max
1
min
1
di f f
1
sea
1
.
.
.
max
o
min
o
di f f
o
sea
o
(2)
where the difference between R
′
and R is that R
′
include the discrete age information.
MaxSurv Deep Network: This module aims to learn
the correlation between covariates and the distribution
of first-hitting times. We input each row of
b
R into a
network to train. The intuitive differences between
RuLU-Like activation and maxout are shown in Fig-
ure. 2, as we can see, a single maxout unit can be
interpreted as making a piece-wise linear approxima-
tion to an arbitrary convex function. At the same time,
since maxout only selects the maximum activation
value, only the selected path will update the weight
during the gradient propagation process, which helps
to accelerate convergence. Secondly, the maxout net-
work can adapt to a variety of different data distri-
butions because it can approximate complex function
forms through a combination of multiple activation
functions.
Assume that the input feature vector for a particu-
lar network layer is
x
i
= (x
i,1
,x
i,2
,··· , x
i,d
,max
i
,min
i
,di f f
i
,sea
i
)
1×n
(3)
The formula in each neuron of the maxout layer is
h
i
(x) = max
j∈[1,k]
z
i j
.
Above is the formula for neuron i in the maxout
hidden layer. Where k is the parameter needed for the
max out layer. The formula for Z is z
i j
= W
i j
x
T
+ b
i j
.
The weight W is a matrix of size (n,m,k), and b is a
matrix of size (m,k). For an arbitrary continuous seg-
mented linear function g(x), two convex segmented
linear functions, h
1
(v) and h
2
(v), can be found such
that the difference between these two convex func-
tions is g(x). g(x) is used as the input of the next
network layer to continue iteration.
After maxout layer is a Batch Norm layer, its role
is to standardise the features in the network. Sup-
pose that during training, a batch of maxout lay-
ers outputs features as x = {x
1
,··· , x
m
}, where x
i
=
(g
i,1
,··· , g
i,k
). We first find the mean and variance
of the batch of features along the dimensions of the
batch: µ
i
(1×d)
=
1
m
m
∑
i=1
g
i
, σ
i
(1×d)
=
r
1
m
m
∑
i=1
(g
i
−µ
i
);
Next, normalise the features
b
g
(1×d)
i
=
g
i
−µ
i
σ
i
+ε
and com-
pute the output of the Batch Norm layer:
x
i
= (B
e
N
i,1
,B
e
N
i,2
,··· , B
e
N
i,k
),
B
e
N
i, j
= γ ⊙
b
g
i, j
+ β
(4)
where γ and β are two parameters of the Batch Norm
layer to train.
The last structure is a dropout layer, with its pa-
rameter p (per neuron dropout probability). When
training with dropout, we perform the element-wise
multiplication with the dropout mask immediately
prior to the multiplication by the weights in all
cases–we do not drop inputs to the max operator.
Finally, the output of the network f
θ
(x) (the
log-risk function) is a linearly activated single node
that estimates the risk function λ(t
|
x) = λ
0
(t) · e
f (x)
,
where λ
0
(t) is the baseline risk function related to
time, we calculated the λ
0
(t) from t = 0 to t = dt.
Note that no matter how λ
0
(t) is equal to, it does not
affect the result of the likelihood function, so we don’t
assume a form for it here. For the loss function, we
set it to average negative log partial likelihood with
regularisation for training:
L
f un
=
λ
∥
θ
∥
2
2
−
∑
i
( f
θ
(x
i
) − log
∑
j∈ℜ(T
i
)
e
f
θ
(x
j
)
)
N
cens
(5)
where N
cens
is the number of patients who had an
event of interest to us (i.e. readmission), λ is the
IoTBDS 2025 - 10th International Conference on Internet of Things, Big Data and Security
186
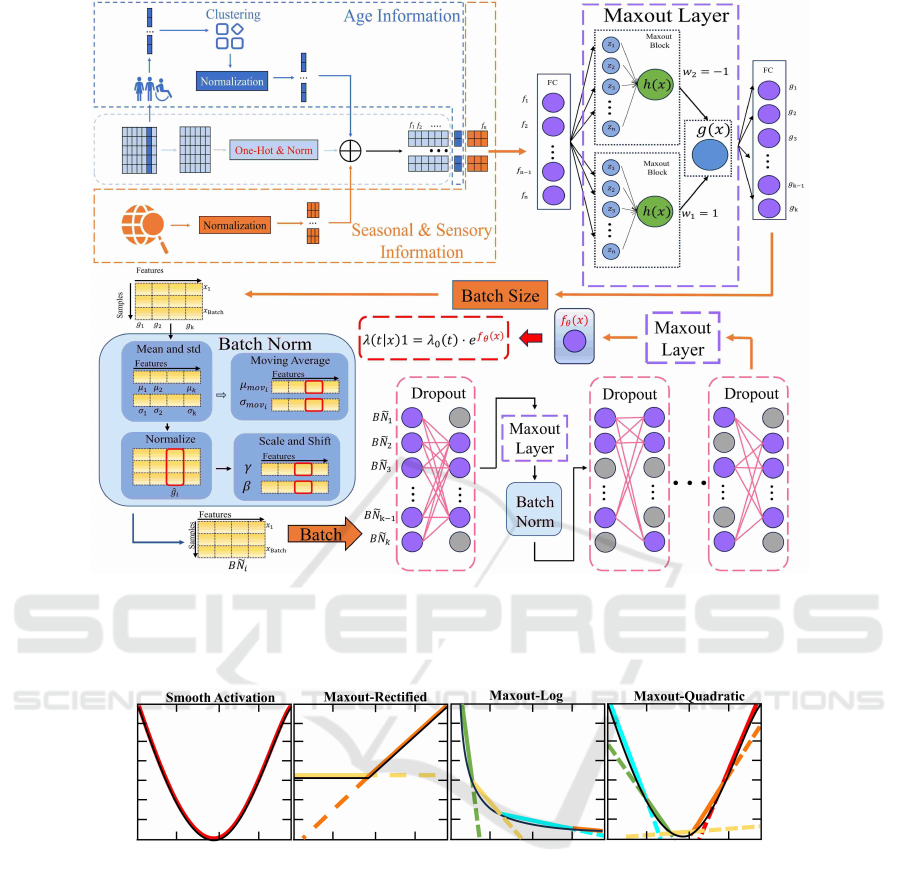
Figure 1: Overview of EMaxSurv. EMaxSurv consists of a Data Preprocessing module and a MaxSurv module. The MaxSurv
module consists of three components: the maxout component (Purple dashed box), the Batch Norm component (Blue box)
and the Drop component (Pink dashed box). The Data Preprocessing module takes R as input and generates data sets
b
R with
richer features.
Figure 2: Intuitive Differences Between Smooth Activation Function and maxout. The black line represents the function that
needs to be fitted, while the colored line represents the process of activating the function to approximate it.
l
2
regularisation parameter. We combine the risk
predicted by observed covariates X = (x
1
,x
2
,··· , x
o
)
with time T = (t
1
,t
2
,··· ,t
o
) and censored label S =
(s
1
,s
2
,··· , s
o
) to update the parameters Θ. During
network training, the input data x is first normalised,
and the optimiser chooses Adam, incorporating the
learning rate schedule and Nestorv mechanism.
4 EXPERIMENTS
In this section, we conduct an empirical study on the
performance of EMaxSurv. First, we describe the
dataset and the baseline methods. After that, we intro-
duce our performance metrics and experimental envi-
ronment. Finally, we discuss the experimental results
(including ablation experiments).
4.1 Dataset and Baselines
We conduct our experiments in three real-world
datasets: the cardiac readmission dataset (Bollepalli
et al., 2022), GBSG2 (Schumacher et al., 1994) and
Veterans (Davis et al., 1982). The Readmissions
dataset was collected from patients over a two-year
period (2017 to 2019). There were 14,845 patient
admissions to the Cardiology Department, of which
1921 patients were admitted multiple times. And
GBSG2 contains breast cancer records of 720 pa-
A Highly Nonlinear Survival Network for Hospital Readmission Prediction of Cardiac Patients
187

tients, while Veterans contains lung cancer records of
138 patients.
Besides the EMaxSurv and the MaxSurv, we
also implement the following baselines in the three
datasets.
• COXPH is a important statistical model used for
survival data analysis.
• GBoost (Saigo et al., 2009) is a sequential train-
ing method with higher weights for misclassified
samples. The final prediction is obtained based on
the weighted results.
• DeepSurv is a multilayer perceptron similar to the
Faragi-Simon network.
• DeepHit does not rely on any assumptions about
underlying stochastic processes. Thus, network
learning models the evolution of the relationship
between covariates and risk over time.
• ResDeepS(RDS) (Weibin, 2022) improves Deep-
Surv using residual networks to solve the gradi-
ent vanishing problem for deep networks. RDE,
RDC, RDG denote ResDeepS using ELU, CELU
and GELU activation function, respectively.
We use 4-fold cross-validation: randomly divide
the data into a training set (80%) and a test set (20%).
The main code will be released as soon as the paper
is published.
4.2 Performance Metric
We choose the Concordance Index (C-Index,
CI) (Harrell et al., 1982) as the primary metric and
Integrated Brier scores (IBS) (Ishikawa et al., 2019)
as the secondary metric.
The formulaic representation of C-Index is
P(score(A) > score(B)
|
Y
A
> Y
B
), where score repre-
sents the output of the model, and Y is the time before
a readmission.
The formulaic representation of Brier score is as
follows:
BrierScore =
1
N
N
∑
i=1
R
∑
j=1
(predict
i j
− observe
i j
)
2
(6)
where N is the sample size, R is the number of cat-
egories, predict
i j
is the probability that the i
th
indi-
vidual is classified as j, and observe
i j
is the actual
state of whether the i
th
individual is classified as j.
The observe
i j
value is 1 if the proper classification is
j and 0 otherwise. Integrating the BS yields the Inte-
grated Brier score (IBS): IBS =
R
max(t)
0
BS(t)dt. The
lower the IBS, the higher the C-index, i.e., the higher
the model’s prediction accuracy.
4.3 Results and Analysis
We chose to add environmental information to the
heart disease dataset after careful consideration: First,
temperature changes can affect the body’s physiologi-
cal responses. Extreme temperatures can increase the
burden on the cardiovascular system. Second, exist-
ing heart disease prediction features mainly focus on
individual internal factors, while temperature features
provide information about the external environment.
Furthermore, the temperature data is obtained from
the public data source of the meteorological depart-
ment, which has high accessibility and reliability. Fi-
nally, different individuals have different sensitivities
to temperature changes. Adding temperature features
can help build a more personalized heart disease pre-
diction model.
4.3.1 Comparison on all Baselines
Table 1 shows the experimental results of our pro-
posed model and baseline models using the cardiac
dataset. CoxPH and Gboost perform poorly due to
their solid assumptions and reliance on feature en-
gineering. The best deep learning model is Deep-
Hit. Although will increase the difficulty of train-
ing, Deephit gets rid of the assumption of the risk
function. Furthermore, we can learn that EMAXSurv
achieves a 33% improvement in the C-index met-
ric relative to the best baseline model DeepHit, and
achieves a 10.9% improvement in the IBS metric rel-
ative to the best baseline model RDG, this is because
EMaxSurv combines environmental information dur-
ing prediction and more effectively capture the non-
linear relationship of covariates.
Table 1: Performance comparisons of EMaxSurv and base-
lines.
Models C-Index IBS
CoxPH 0.5994 0.1652
Gboost 0.5582 0.1713
DeepSurv 0.6911 0.1857
RDE 0.6922 0.1629
RDC 0.6919 0.1638
RDG 0.6897 0.1628
DeepHit 0.6930 0.1633
EMaxSurv 0.9221 0.1449
4.3.2 Comparison on Different Environmental
Information
We added different environmental information to the
readmission data, resulting in four different datasets,
each containing the original information and an addi-
IoTBDS 2025 - 10th International Conference on Internet of Things, Big Data and Security
188
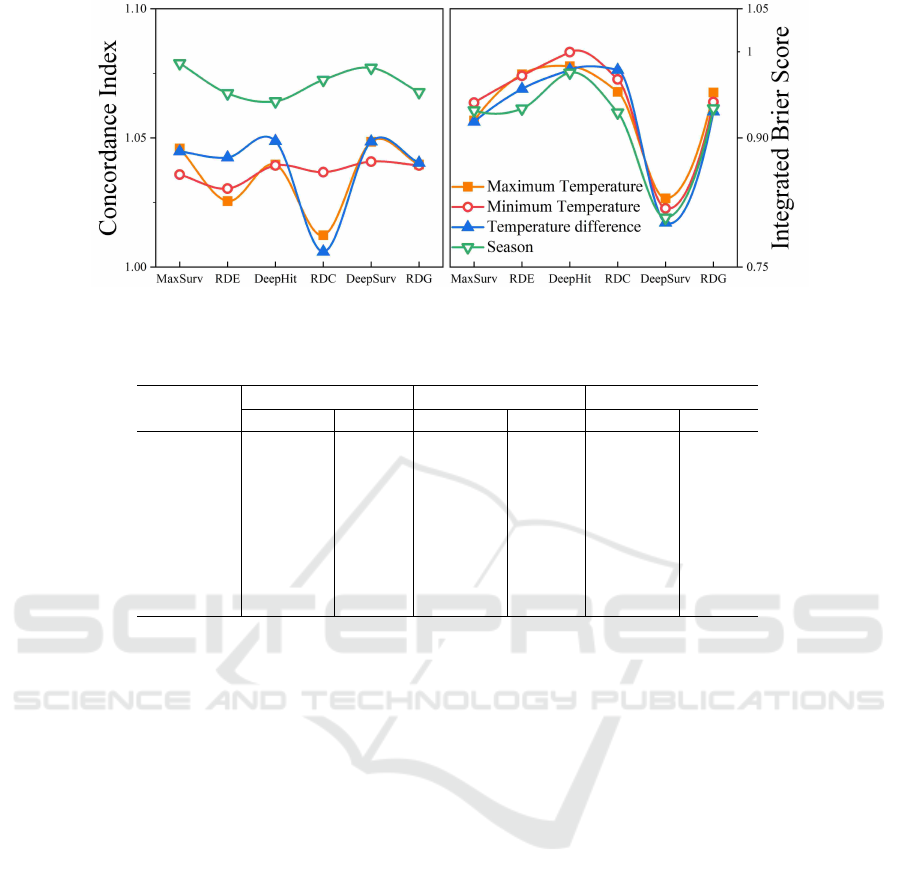
Figure 3: The ratio of model results after adding different environmental information. The horizontal axis represents different
models, and lines of different colors represent the ratio after adding different environmental information.
Table 2: Performance comparisons of MaxSurv and baselines on three disease survival datasets.
Models
Veteran GBSG2 Cardiac
C-Index IBS C-Index IBS C-Index IBS
CoxPH 0.6312 0.1487 0.6941 0.1105 0.5994 0.1652
Gboost 0.6007 0.1490 0.6761 0.1383 0.5582 0.1713
DeepSurv 0.6927 0.1411 0.7612 0.1064 0.6911 0.1857
RDE 0.6919 0.1433 0.7418 0.1066 0.6922 0.1629
RDC 0.6708 0.1478 0.7355 0.1051 0.6919 0.1638
RDG 0.6885 0.1429 0.7630 0.1049 0.6897 0.1628
DeepHit 0.7094 0.1445 0.7884 0.1048 0.6931 0.1633
MaxSurv 0.7197 0.1400 0.8182 0.1045 0.6965 0.1627
tional piece of environmental information. We trained
the same predictor with the new and old datasets, and
then divided the metric obtained with the new dataset
by the metric obtained with the old dataset, as shown
in Figure 3.
As shown in Figure 3, adding any kind of envi-
ronmental information improves the performance of
all models. For MaxSurv, it is the best model in most
settings. This is because there is a close correlation
between heart attacks and environmental information.
In addition, the effect of inputting all environmental
information into the data is better than all other con-
figurations.
4.3.3 Comparison on Three Disease Survival
Datasets
In order to verify the performance of the model on
datasets without supplementary environmental infor-
mation, we verified the performance of the MaxSurv
module on three different disease datasets and com-
pared it with other baseline models. Their perfor-
mance is shown in Table 2.
As shown in Table 2 above, MaxSurv exhibits op-
timal performance in all three datasets. DeepSurv and
DeepHit also perform well and are closer to the Max-
Surv model, but there is still a gap. MaxSurv has
several features that can help the model achieve bet-
ter performance: the generated representation is not
sparse; the maxout structure is more compatible with
the dropout structure; and the multi-way activation
mechanism of maxout enables the network to capture
more complex features and show stronger generaliza-
tion ability.
5 CONCLUSION
In this paper, we propose a new method, EMax-
Surv, to analyze cardiac readmission data. EMaxSurv
maintains the basic assumptions of the Cox model and
uses a neural network to model a nonlinear represen-
tation of the relationship between covariates and the
risk of clinical events. We compare the performance
of MaxSurv with that of previous models in conjunc-
tion with the patient’s environmental perceptual in-
formation. In the data with environmental informa-
tion, the performance of all models is effectively im-
proved, with Maxsurv’s performance being the most
improved. The MaxSurv outperforms the previous
model even with the original data and data from other
disease types.
A Highly Nonlinear Survival Network for Hospital Readmission Prediction of Cardiac Patients
189

ACKNOWLEDGEMENTS
This work was supported in part by the Macao
Polytechnic University – Research on Representation
Learning in Decision Support for Medical Diagnosis
(RP/FCA-11/2022).The submission of this research
is controlled by the Macau Polytechnic University
(fca.65b5.d61c.2).
REFERENCES
Bai, L., Li, Q., Wang, J., Lavigne, E., Gasparrini, A., Copes,
R., Yagouti, A., Burnett, R. T., Goldberg, M. S., Cak-
mak, S., et al. (2018). Increased coronary heart dis-
ease and stroke hospitalisations from ambient temper-
atures in ontario. Heart, 104(8):673–679.
Bollepalli, S. C., Sahani, A. K., Aslam, N., Mohan, B.,
Kulkarni, K., Goyal, A., Singh, B., Singh, G., Mit-
tal, A., Tandon, R., et al. (2022). An optimized ma-
chine learning model accurately predicts in-hospital
outcomes at admission to a cardiac unit. Diagnostics,
12(2):241.
Chen, T., Madanian, S., Airehrour, D., and Cherrington, M.
(2022). Machine learning methods for hospital read-
mission prediction: systematic analysis of literature.
Journal of Reliable Intelligent Environments, 8(1):49–
66.
Cox, D. R. (1972). Regression models and life-tables. Jour-
nal of the Royal Statistical Society: Series B (Method-
ological), 34(2):187–202.
Davis, S., Mietlowski, W., Rohwedder, J. J., Griffin, J. P.,
and Neshat, A. A. (1982). Levamisole as an adju-
vant to chemotherapy in extensive bronchogenic car-
cinoma. a veterans administration lung cancer group
study. Cancer, 50(4):646–651.
Gensheimer, M. F. and Narasimhan, B. (2019). A scal-
able discrete-time survival model for neural networks.
PeerJ, 7:e6257.
Goodfellow, I., Warde-Farley, D., Mirza, M., Courville, A.,
and Bengio, Y. (2013). Maxout networks. In in ICML,
pages 1319–1327. PMLR.
Harrell, F. E., Califf, R. M., Pryor, D. B., Lee, K. L., and
Rosati, R. A. (1982). Evaluating the yield of medical
tests. Jama, 247(18):2543–2546.
Heidenreich, P. A., Bozkurt, B., Aguilar, D., Allen, L. A.,
Byun, J. J., Colvin, M. M., Deswal, A., Drazner,
M. H., Dunlay, S. M., Evers, L. R., et al. (2022).
2022 aha/acc/hfsa guideline for the management of
heart failure: a report of the american college of car-
diology/american heart association joint committee on
clinical practice guidelines. Journal of the American
College of Cardiology, 79(17):e263–e421.
Ishikawa, S. A., Zhukova, A., Iwasaki, W., and Gascuel, O.
(2019). A fast likelihood method to reconstruct and
visualize ancestral scenarios. Molecular biology and
evolution, 36(9):2069–2085.
Ishwaran, H., Kogalur, U. B., Blackstone, E. H., and Lauer,
M. S. (2008). Random survival forests.
Joglar, J. A., Chung, M. K., Armbruster, A. L., Benjamin,
E. J., Chyou, J. Y., Cronin, E. M., Deswal, A., Eck-
hardt, L. L., Goldberger, Z. D., Gopinathannair, R.,
et al. (2024). 2023 acc/aha/accp/hrs guideline for the
diagnosis and management of atrial fibrillation: a re-
port of the american college of cardiology/american
heart association joint committee on clinical practice
guidelines. Circulation, 149(1):e1–e156.
Kaplan, E. L. and Meier, P. (1958). Nonparametric esti-
mation from incomplete observations. Journal of the
American statistical association, 53(282):457–481.
Katzman, J. L., Shaham, U., Cloninger, A., Bates, J., Jiang,
T., and Kluger, Y. (2018). Deepsurv: personalized
treatment recommender system using a cox propor-
tional hazards deep neural network. BMC medical re-
search methodology, 18:1–12.
Lee, C., Zame, W., Yoon, J., and Van Der Schaar, M. (2018).
Deephit: A deep learning approach to survival analy-
sis with competing risks. In in AAAI.
Mi
ˇ
si
´
c, V. V., Gabel, E., Hofer, I., Rajaram, K., and Maha-
jan, A. (2020). Machine learning prediction of postop-
erative emergency department hospital readmission.
Anesthesiology, 132(5):968–980.
Model, C. P. H. (2017). Multi-task cox proportional hazard
model for predicting risk of unplanned hospital read-
mission. 2017 Systems and Information Engineering
Design Symposium (SIEDS), pages 265–270.
Pan, W.-H., Li, L.-A., and Tsai, M.-J. (1995). Temperature
extremes and mortality from coronary heart disease
and cerebral infarction in elderly chinese. The Lancet,
345(8946):353–355.
Pepe, M. S. and Fleming, T. R. (1989). Weighted kaplan-
meier statistics: a class of distance tests for censored
survival data. Biometrics, pages 497–507.
Saigo, H., Nowozin, S., Kadowaki, T., Kudo, T., and Tsuda,
K. (2009). gboost: a mathematical programming ap-
proach to graph classification and regression. Machine
Learning, 75:69–89.
Schumacher, M., Bastert, G., Bojar, H., H
¨
ubner, K.,
Olschewski, M., Sauerbrei, W., Schmoor, C., Beyerle,
C., Neumann, R., and Rauschecker, H. (1994). for
the german breast cancer study group (gbsg). random-
ized 2x2 trial evaluating hormonal treatment and the
duration of chemotherapy in node-positive breast can-
cer patients. Journal of Clinical Oncology, 12:2086–
2093.
Schwartz, J., Samet, J. M., and Patz, J. A. (2004). Hospital
admissions for heart disease: the effects of tempera-
ture and humidity. Epidemiology, 15(6):755–761.
Van Belle, V., Pelckmans, K., Van Huffel, S., and Suykens,
J. A. (2011). Support vector methods for survival
analysis: a comparison between ranking and regres-
sion approaches. Artificial intelligence in medicine,
53(2):107–118.
Weibin, W. (2022). Deep learning-based prediction mod-
els of early recurrence and recurrence-free survival
in hepatocellular carcinoma with multi-phase ct. Rit-
sumeikan University.
Zhai, Y.-j., Zhang, Y., Liu, H.-z., and Zhang, Z.-r. (2023).
Multi-angle support vector survival analysis with neu-
ral tangent kernel study. Arabian Journal for Science
and Engineering, 48(8):10267–10284.
IoTBDS 2025 - 10th International Conference on Internet of Things, Big Data and Security
190
