
Personalized Task Reassignment in Industry 5.0: A MILP-Based
Solution Approach
Claudia Diamantini
a
, Ornella Pisacane
b
, Domenico Potena
c
and Emanuele Storti
d
Dipartimento di Ingegneria dell’Informazione,
Università Politecnica delle Marche, 60121 Ancona, Italy
Keywords:
Process Optimization, Task Assignment, Business Continuity, Industry 5.0, Organizational Mining, Mixed
Integer Linear Programming.
Abstract:
Industry 5.0 involves a transformation towards human-centric and green-aware industrial ecosystems. Sus-
tainable, safe and efficient allocation of process activities to workers is crucial in this context, as excessive
workloads can bring detrimental effects on them, potentially causing long-term harm and reducing overall
productivity. This paper addresses the problem of reassigning activities to workers, balancing between ef-
ficiency and sustainability through a flexible and periodic negotiation process, in which workers can refuse
assigned activities if these exceed a sustainable stress level, which is monitored through wearable devices. We
model it through Mixed Integer Linear Programming (MILP) with a hierarchical objective function, aimed
at first maximizing the number of assignments and then minimizing the cost due to reassignments, levels of
stress and possible overtimes. As experiments show, the solution time of our MILP model makes dynamic
negotiation feasible in realistic settings.
1 INTRODUCTION
The advent of Industry 5.0, coupled with the Inter-
net of Everything (IoE), marks a new era of inter-
connection and smart automation in industrial pro-
cesses, towards human-centric and green-aware in-
dustrial ecosystems (Leng et al., 2022). One of the
critical challenges in this context is the sustainable
and safe allocation of tasks to workers, balancing pro-
ductivity with the physical and mental health of the
workforce. Excessive workloads and stress can lead
to detrimental effects on workers, potentially causing
long-term harm, while also impacting the enterprise
by degrading the quality of work and reducing overall
productivity.
This paper addresses the problem of assigning
tasks to workers, integrating sustainability, by propos-
ing a framework that dynamically adapts to chang-
ing conditions and worker capabilities. This helps
in finding a balance between efficiency and sustain-
ability, setting the stage for a more human-centric In-
dustry 5.0 ecosystem. The reassignment relies on a
a
https://orcid.org/0000-0001-8143-7615
b
https://orcid.org/0000-0003-1174-0162
c
https://orcid.org/0000-0002-7067-5463
d
https://orcid.org/0000-0001-5966-6921
flexible negotiation process, in which resources, i.e.
workers, can refuse assigned activities if these ex-
ceed a sustainable stress level, which is monitored
through wearable devices that operate on the edge,
preserving the privacy of individual workers. The
optimization problem is modeled through Mixed In-
teger Linear Programming (MILP) with a hierarchi-
cal objective function. Our primary goal is to max-
imize the number of assignments, followed by mini-
mizing the total cost due to reassignments, sustainable
stress level and possible overtimes, under a set of con-
straints. These depend on priority of activities, along
with available workload, performance and skills of
resources. Furthermore, social relations among re-
sources, modeled through organizational mining tech-
niques, are taken into account to prioritize reassign-
ment between resources with a high degree of affin-
ity. As such, this work is positioned in the domain of
Task Assignment optimization. Unlike previous stud-
ies, our focus is on the periodic reassignment of ac-
tivities to resources, facilitating dynamic adaption to
evolving requirements through a resource-driven ne-
gotiation process. Experiments demonstrate that, in
realistic settings, the solution time of our MILP model
makes periodic resolution feasible, enabling dynamic
negotiation.
Diamantini, C., Pisacane, O., Potena, D. and Storti, E.
Personalized Task Reassignment in Industry 5.0: A MILP-Based Solution Approach.
DOI: 10.5220/0013197400003929
In Proceedings of the 27th International Conference on Enterprise Information Systems (ICEIS 2025) - Volume 2, pages 813-820
ISBN: 978-989-758-749-8; ISSN: 2184-4992
Copyright © 2025 by Paper published under CC license (CC BY-NC-ND 4.0)
813

The rest of this work is structured as follows: Sec-
tion 2 discusses related literature. The methodology
of the approach is introduced in Section 3, along with
the representation model for resources and activities,
and the MILP model. An experimental evaluation is
discussed in Section 4. Finally, Section 5 concludes
the paper and draws some future research directions
worth of investigation.
2 RELATED WORK
Allocating resources is often addressed as an opti-
mization problem. Indeed, several approaches have
been thoroughly reviewed in surveys on the subject
(De Bruecker et al., 2015; Pufahl et al., 2021), differ-
ing in terms of (a) the optimization criteria, (b) the
role of process models and data to drive the decision,
and (c) the adopted solution technique. Most research
focuses on process-oriented optimization, which aims
to find the resources that best fit the activity to replace.
This can involve a one-to-one (activity-to-resource)
approach or a more complex allocation. Optimization
can be performed from either a local or global per-
spective, considering different priorities of ongoing
process instances and their related activities. Other
possible measures to optimize include the process
cost, the cycle time of the process or the throughput.
Simpler approaches are based on manually de-
fined (logic) rules (e.g., Kumar et al., 2002), capa-
ble to find a feasible solution in less time than al-
ternative approaches, although with fewer guaran-
tees on its quality. Inductive approaches derive rules
for resource assignment, exploiting declarative min-
ing, reinforcement learning, decision trees, associa-
tion rules, support vector machines (Liu et al., 2008),
or by modeling social relations by Hidden Markov
Models. On the other hand, several literature con-
tributions make use of mathematical programming to
deal with the problem of assigning resources to ac-
tivities. For example, considering input/output of ac-
tivities and precedence, Hirsch and Ortiz-Peña (2017)
formulate a Mixed Integer Non-Linear Program and
design a set of heuristics, minimizing the comple-
tion time. In Arias et al. (2018), as we do, multi-
ple criteria are considered, such as information from
past executions of the process (e.g., frequency, perfor-
mance, quality), the required skills to perform each
activity and their resource workload. An Integer Lin-
ear Programming model is then formulated to allocate
a single resource to an activity and a heuristic is used
for batch resource recommendation, although not tak-
ing into account the priorities among the activities as
well as the similarity among the resources. In Xie
et al. (2016), the authors develop a dynamic task as-
signment approach for minimizing the cycle time of
processes at the run-time stage. Each resource has a
predefined list of assigned activities to perform, from
which the system schedules what to execute by rely-
ing on stochastic and queuing theory. Shared tasks
can be dynamically assigned to idle resources by role
type. Finally, heuristic approaches can balance solu-
tion quality and computational effort. As shown in
Pufahl et al. (2021), multiple approaches can be used,
e.g., semantic languages (Cabanillas et al., 2013), Par-
ticle Swarm Optimization to minimize the cycle-time
(Zhao et al., 2017), or math-heuristics for efficient re-
source replacement (Diamantini et al., 2024).
Unlike most work in the literature, focused on
minimizing the cycle time, our goal is to maximize
the number of assigned activities, while minimizing a
total cost depending on reassignments, levels of stress
and possible overtimes. This is achieved through a
hierarchical objective function, similar to the one al-
ready proposed in Diamantini et al. (2024). How-
ever, in that work, the problem of reassigning activ-
ities to resources did not take into account the lev-
els of stress, the possibility that a resource may also
refuse an activity and possible overtimes. Therefore,
the objective function represented only the number of
assignments (to maximize) and the total cost due to
reassignments (to minimize). The resulting decision
problem consisted of assigning activities of unavail-
able resources to those available resources with the
required skills. The activities already assigned to each
available resource were not subject to change and
were thus considered definitively assigned. In con-
trast, in the present work all the assignments are re-
considered on each period of observation, resulting in
a more complex problem. Indeed, this can be seen as a
Dynamic Task Assignment Problem (D-TAP) (Spivey
and Powell, 2004), where however we assume that
resources and tasks are known at each time period.
Therefore, to the best of our knowledge, our paper is
the first dealing with a dynamic and periodic reassign-
ment problem considering a resource-focused negoti-
ation based on sustainable stress levels.
3 METHODOLOGY
In this work, we refer to an Industry 5.0 scenario
in which an organization utilizes a Business Pro-
cess Management (BPM) system capable of monitor-
ing the execution of activities assigned to resources
within a set of business processes. Employees are
equipped with a smart object capable of tracking their
assigned activities and monitoring health parameters
ICEIS 2025 - 27th International Conference on Enterprise Information Systems
814

Figure 1: Overview of the context-aware task assignment
methodology.
to detect their stress levels. The device can automati-
cally refuse a subset of the assigned activities if the
employee’s monitored stress level exceeds the esti-
mated stress effort for those activities. The smart ob-
ject can either be an all-in-one device with computa-
tional capabilities or a combination of a fitness band
for health monitoring connected to a smartphone app
for task management.
The methodology builds on the steps that are
sketched in Figure 1. Initially, activities are assigned
to resources based on the available workload and his-
torical information, including skills, performance and
past collaborations. These are extracted from data on
executed activities, which are collected in an event
log. The log is analysed and processed using organi-
zational mining techniques (Song and van der Aalst,
2008) to derive a sociogram, i.e. a social graph of
collaboration relations. The scenario considered in
this work involves activities that are planned in ad-
vance and assigned to resources at design time. Re-
assignment of these activities requires re-planning all
remaining tasks. This means that we do not wait for
the execution of an activity to be completed before
deciding how to assign the next one. Unlike some
BPM systems that focus on roles, this approach tai-
lors assignments to the specific characteristics of in-
dividual employees. Additionally, information on the
run-time workload of resources and priorities of ac-
tivity are extracted from the system. In particular,
the priority of an activity indicates its level of ur-
gency. Higher priority activities must be executed
before lower priority ones, ensuring critical activities
are completed first. Employees’ devices may refuse
activities (among those they should still perform) at
any time during the process execution if their stress
level increases. The system collects these refused ac-
tivities and, with a given periodicity, re-executes task
assignment. Hence, the task assignment problem re-
distributes activities to maximize the number of as-
signments, and to minimize reassignment costs, ac-
counting for several conditions. C1) Availability: an
activity can be assigned to a resource with sufficient
residual workload. Overtime is possible within na-
tional labor law constraints but should be considered
an exception, used only when no other solutions are
available. C2) Sustainable stress compliance: an ac-
tivity can be assigned to a resource only if its esti-
mated stress level is below the threshold of refused
activities. New activities can be assigned to resources
that have not refused any activities. C3) Affinity: re-
sources more compatible with those to be replaced are
preferred. Affinity takes into account past work rela-
tions, resource capabilities, performance and experi-
ence. C4) Minimality: the original assignment plan
should be preserved as much as possible: as a conse-
quence, reassigning an activity to the same resource is
preferred if possible. C5) Priority: in order to assign
an activity with a given priority, all activities with a
higher priority must be assigned.
Overall, the iterative approach to reassignment
can be viewed as a dynamic negotiation process. It
operates in a privacy preserving manner, as refusals
are managed locally on the employees’ devices, and
the reasons are not communicated back to the system,
ensuring that sensitive information about employees’
stress levels remains confidential. By periodically re-
assessing and redistributing activities, the system can
adapt to changing conditions and continuously opti-
mize assignments in a fair and efficient manner.
3.1 Representation Model for Resources
and Activities
We denote by T a set of activities, i.e., tasks that are
aimed to achieve a goal, and by R the set of resources
within the organization. We denote by L the set of
activity types (or label), e.g., pallet moving, product
packaging, tool cleaning. The function Ω : T → L
maps an activity to its type.
3.1.1 Process-Related Information
Information on resources can be retrieved from ei-
ther process models (in a top-down approach), or
from logs of past process executions (according to
a bottom-up approach), although a mix of the two
approaches is frequently used. Following the Pro-
cess Mining terminology (Van Der Aalst et al., 2005),
hereby we refer to the term event to denote the execu-
tion of a specific activity by a resource. A trace is a
possible sequence of events, where C is the set of all
possible traces. An event log L is a subset of all bags
(multi-sets) over C, and is used to extract information
on activities, resources and relations among them.
Personalized Task Reassignment in Industry 5.0: A MILP-Based Solution Approach
815
An activity a
k
∈ T is characterized by an average
workload λ
k
∈ [0, 1] which is obtained by averaging
past execution times in the event log of activities be-
longing to same type. Hence, activities of the same
type will share the same average workload value, i.e.,
∀a
i
, a
j
∈ T, i ̸= j, Ω(a
i
) = Ω(a
j
) → λ
i
= λ
j
. We con-
sider a reference time period that can be defined ar-
bitrarily at the application level (e.g., a working day
or week). Details about the computation of the pa-
rameter are available in Diamantini et al. (2024). A
resource is characterized in terms of a set of skills,
namely the activity types that they performed at least
once in the past. Relations among resources are uti-
lized to model the affinity of a resource in being as-
signed an activity type previously assigned to another.
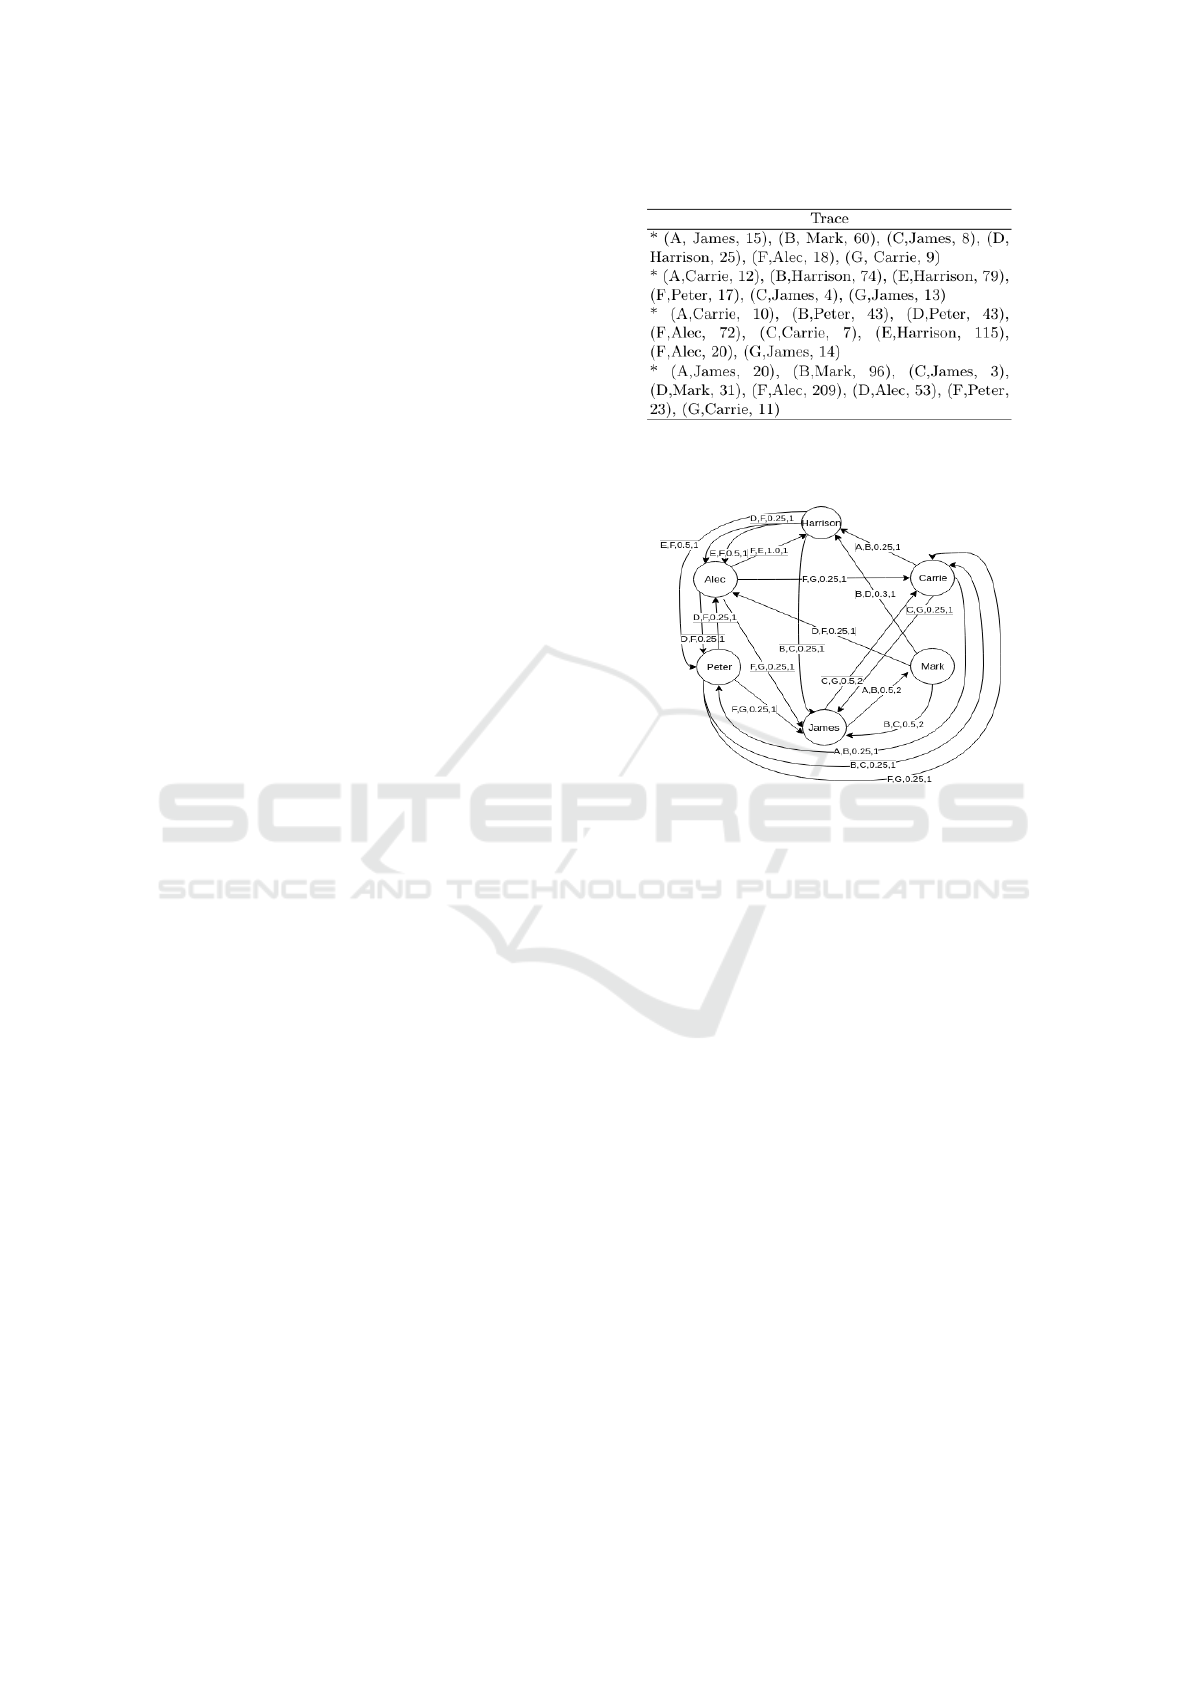
The notion of affinity stems from recognizing,
in the log, collaboration relations between two re-
sources. Among the several measures defined in the
literature on organizational mining (Van Der Aalst
et al., 2005), here we focus on possible causality, and
specifically on handover of work. Within a trace,
there is a handover of work from a resource r
1
to
a resource r
2
if there are two subsequent activities
a
1
and a
2
where a
1
is completed by r
1
and a
2
by
r
2
. In this work, we ignore self-transfers by con-
sidering indirect succession and causal relation, i.e.,
we take into consideration succession between activ-
ities, with any length, only if aligned to the process
model. To detect causal relations, we rely on the ap-
proach discussed in Diamantini et al. (2016), which
enables to make causal relations between events in a
trace explicit. The metric is computed for a pair of
resources r
1
, r
2
and with respect to a pair of activity
types Ω(a
1
), Ω(a
2
) by dividing the total number of
proper causal successions (with no self-transfer) by
the total number of causal successions of activities
with types Ω(a
1
), Ω(a
2
) between any two resources
r
i
, r
j
, with i ̸= j. In other terms, the metric evaluates
how peculiar the relation between two resources in
the execution of such two activity types is (infrequent
relations will be taken into account as well). The in-
formation can be represented in a sociogram, i.e., a
labeled directed multigraph of social relations where
nodes represent resources and a labeled edge linking
two nodes represents the activity type, the handover
of work and the number of causal successions. Fig-
ure 2 and Figure 3 show an example of event log and
related sociogram, respectively.
The priority of an activity is a further process-
related information derived from the BPM system.
We model it as a process-dependent function that de-
fines a total order over the set of activities to assign.
Each activity’s priority depends on (a) the process in-
stance in which it is expected to be executed (accord-
Figure 2: An example of event log with 4 traces (each event
includes the activity type, the resource and the duration).
Figure 3: The sociogram corresponding to the example in
Figure 2.
ing to business rules) and (b) its position within the
process, considering that if two activities a
h
, a
k
are in
causal relation, then priority of a
h
is higher than pri-
ority of a
k
. The specific priority value, given to each
process instance, is domain-dependent and therefore
left to implementation. Given an activity a
k
, P
k
is the
set of activities with a priority higher than a
k
.
3.1.2 Contextual Information
Contextual information on a resource r
i
∈ R is ex-
tracted from the information system of the organiza-
tion, in terms of current workload γ
i
∈ [0, 1], while the
maximum workload µ
i
∈ [0, 1] is set by the organiza-
tion. Both are expressed w.r.t. to a reference period.
Finally, assigning an estimated stress level ξ
k
∈
[0, 1] to an activity a
k
is essential for understanding
and managing its impact on employees’ well-being.
Similarly to the workload, the estimated stress level
for activities belonging to the same type is identical,
i.e. ∀a
i
, a
j
∈ T, i ̸= j, Ω(a
i
) = Ω(a
j
) → ξ
i
= ξ
j
. This
estimation quantifies the stress level associated to a
particular activity, considering factors like physical
and mental effort. The value can be obtained in mul-
tiple ways, e.g. by an expert-defined stress model, by
employee self-reporting, or learning approaches, al-
ICEIS 2025 - 27th International Conference on Enterprise Information Systems
816

though in this work we leave its definition to the spe-
cific implementation.
3.2 MILP Model
Hereby, we describe the MILP model, formulated to
solve the problem of assigning activities to resources.
The reassignment problem needs to be solved by pe-
riodically collecting all the refusal notifications com-
ing from the employees’ smart objects. Notifications
serve as alerts that some resources are unable to per-
form some activities, previously assigned to them.
Therefore, the approach for task re-assignment is to
challenge the assignment of all the activities, even
those not refused, in order to perform as many activ-
ities as possible, preferring solutions that disrupt the
previous allocation plan as little as possible.
For the sake of simplicity, in the following formu-
lation, we refer each activity as well as each resource
only through its subscript. For each resource i ∈ R ,
A
i
is the set of activities assigned to him/her, and
R A
i
⊆ A
i
is the subset of possible activities he/she
refuses. In addition,
¯
R ⊆ R is the set of resources
with at least one refused activity.
The problem is mathematically formulated
through MILP, through the decision variable
x
ik
, ∀i ∈ R , k ∈ T , equal to 1 if the resource i is
assigned to the activity k, 0 otherwise. Moreover,
differently from Diamantini et al. (2024), the level of
stress of each activity assigned to a resource is also
considered. Therefore, the non-negative continuous
decision variable δ
s
i
∀i ∈ R is introduced, denoting
the additional percentage assigned to the level of
stress of the resource i, relative to the maximum
level of stress ν
s
i
that the resource can tolerate. The
parameter ν
s
i
is computed as: ∀i ∈ R \
¯
R (i.e., who
did not refuse any activity), ν
s
i
= max
k∈A
i
{ξ
k
}. In-
stead, ∀i ∈
¯
R (i.e., who refused at least one activity),
ν
s
i
= max
k∈A
i
\R A
i
{ξ
k
}.
In some cases, it may not be possible to reassign
all the activities. Therefore, the non-negative contin-
uous decision variable δ
w
i
, ∀i ∈ R is introduced, de-
noting the additional percentage assigned to the resid-
ual workload of i relative to the maximum workload.
The residual workload of a resource i is computed as:
µ
i
− γ
i
. Finally, as in Diamantini et al. (2024), the in-
put coefficient α
ik
, ∀i ∈ R , k ∈ T , equals 1 if resource
i can perform activity k, and 0 otherwise, based on the
skills required for k.
The proposed MILP model is in the following.
min
∑
j∈R
∑
k∈A
j
∑
i∈R :α
ik
=1
(c
i jk
− M
k
)x
ik
+
∑
i∈R
P ∗ δ
s
i
+
∑
i∈R
Q ∗ δ
w
i
(1)
∑
i∈R :α
ik
=1
x
ik
≤ 1, ∀k ∈ T (2)
∑
k∈T :α
ik
=1
λ
k
∗ x
ik
≤ (µ
i
− γ
i
) ∗ (1 + δ
w
i
), ∀i ∈ R (3)
∑
i∈R :α
ik
=1
x
ik
≤
∑
j∈R
∑
k∈P
k
:α
jk
=1
x
jk
|P
k
|
, ∀k ∈ T (4)
ξ
k
∗ x
jk
≤ (1 + δ
s
i
) ∗ ν
s
i
, ∀k ∈ T, i ∈ R (5)
0 ≤ δ
s
i
≤
¯
δ
s
i
∀i ∈ R (6)
0 ≤ δ
w
i
≤
¯
δ
w
i
∀i ∈ R (7)
x
ik
∈ {0, 1}∀i ∈ R , k ∈ T (8)
The objective function to minimize (1) consists of
three cost components. The first one is the total cost
of assigning activities to resources minus the penalty
(M
k
) to pay for each unassigned activity k. This way,
in order to incentive as many assignments as possi-
ble, the cost of each activity assigned is decreased by
the corresponding penalty. M
k
depends on the activ-
ity k in order to take into account the relative impor-
tance given to each activity. In the traditional task
assignment problem, the total cost is minimized by
assigning all tasks. On the contrary, in our problem,
in order to consider the stress levels (not higher than
a given threshold) and then, make the instance feasi-
ble, unassigned tasks are also allowed. Higher prior-
ity tasks are prioritized because failure to assign them
could make other tasks in the cascade unfeasible. This
is why constraints (4), on task priority, are formu-
lated. We refer to Diamantini et al. (2024) for the de-
tailed definition of the cost factors c
i jk
, proportional
to 1 − sim(r
i
, r
j
, a
k
), where sim is a similarity func-
tion that measures the affinity (C3 - Affinity) between
resources i and j in performing the activity k. In turn,
sim is calculated as the weighted average of the han-
dover of work (derived from the sociogram), the rel-
ative efficiency and the relative experience in execut-
ing the task k (both derived from the event log). The
weights of the three components depend on the appli-
cation scenario. For example, for tasks that require
a high degree of collaboration (e.g., management or
knowledge-driven processes), the weight of the han-
dover of work will be very high, whereas for semi-
automated tasks such as production processes, it will
be less important. Moreover, c
iik
, ∀i ∈ R , k ∈ A
i
is set
equal to 0, in order to preserve, as much as possible,
the original assignment plan (C4 -Minimality). This
way, it is guaranteed that, when possible, the plan
Personalized Task Reassignment in Industry 5.0: A MILP-Based Solution Approach
817

of the activities each resource has to perform is not
completely changed. The second cost component ac-
counts for the penalties (equal to P for all resources)
due to increased stress level for resources, while the
third component refers to the penalties (equal to Q for
all the resources) due to their possible overtimes.
Each activity k ∈ T is assigned to at most one re-
source (2). The maximum workload of a resource i is
never exceeded (C1 - Availability, (3)). Indeed, the
possibility to increase the residual workload of the
resource i (i.e., µ
i
− γ
i
) of a certain percentage δ
w
i
is
also considered. A lower priority activity is not as-
signed if all its higher priority activities are not as-
signed (C5 - Priority, (4)). It is worth noting that the
proposed model takes into account the well-being of
the employees also through the objective function (1).
In particular, while the well-being of employees is
not directly maximized, solutions that result in stress
levels significantly exceeding their tolerable thresh-
olds are avoided because the related penalty factor
P, in (1), is set to a very large value. For each pair
(i ∈ R , k ∈ T ), the level of the stress of k, if assigned
to i, does not exceed the maximum level of stress
possible, increased of a certain percentage (C2 - Sus-
tainability, (5)). The nature of each decision variable
δ
s
i
, ∀i ∈ R that is non-negative and not higher than a
threshold
¯
δ
s
i
is guaranteed through (6). This thresh-
old is computed differently according to the resource
type: ∀i ∈
¯
R , it is
ν
s
i
+
¯
ν
s
i
2
, where
¯
ν
s
i
= min
k∈R A
i
{ξ
k
}.
Instead, ∀i ∈ R \
¯
R , it is an input parameter indicated
by the decision maker. Finally, constraints (7 – 8) de-
fine the nature of the other decision variables, where
¯
δ
w
i
is set according to national labour laws. In order to
speed up the computational times required by solver
for the proposed model, we apply the following pre-
processing rules:
x
ik
= 0, ∀i ∈ R , k ∈ R A
i
(9)
x
ik
= 0, ∀i ∈ R , k ∈ T : α
ik
= 1, ξ
k
> (1 +
¯
δ
s
i
) ∗ ν
s
i
(10)
Assigning activity k to resource i, who has refused it
(i.e., k ∈ R A
i
), is not allowed (9). Finally, assigning
activity k to resource i who has the required skills but
cannot tolerate its stress level, is also prohibited (10).
4 EXPERIMENTS
In this section, tests aimed at evaluating the efficiency
and effectiveness of the approach in various scenarios
are presented. Specifically, we examined how several
parameters change with the number of resources, as-
signed tasks, level of stress and number of refused ac-
tivities. The average time taken to solve the model is
reported, along with the average percentage MIP GAP
achieved by the solver, the average number of activi-
ties not assigned in the solution, the average number
of resources asked to work overtime and their aver-
age overtime, the average number of resources with
additional level of stress and their average additional
stress level.
4.1 Settings
The model was solved on a set of instances that were
synthetically generated by setting the number of re-
sources to 100 and by varying the number of activ-
ity types (N
A
) in {10, 20, 40}, the probability that a
resource refuses at least one assigned activity (P
re f
)
in {0.1, 0.2, 0.4} and the minimum current workload
of a resource (MWL) in {0.2, 0.4, 0.6}. Each activity
type is defined by randomly assigning a workload ef-
fort λ
k
∈ [0.01, 0.3] and a stress level ξ
k
∈ [0.1, 1.0],
assuming uniform distributions. Each resource can
perform a randomly assigned number of activity types
between 2 and 4. The current workload of the re-
source is randomly chosen between MW L and 0.8,
and a number of activities are assigned, each with a
random priority value, up to the maximum workload
level of 1.0. A resource can be selected to refuse some
activities, with probability P
re f
. In this case, a stress
threshold t
s
is randomly picked from the stress levels
of the assigned activities. Consequently, all activities
with a stress level ≥ t
s
are flagged to be refused by
the resource. In total, two instances, for each com-
bination of the input parameters, were generated, re-
sulting in 54 instances.The penalties (M
k
, P, Q) were
set by giving higher priority to the fact that all the ac-
tivities can be performed in the workday, without ad-
ditional costs due to overtime. Thus, M
k
was chosen
greater than P so that we would prefer to perform all
the activities, taking the risk of assigning them also
with a higher stress level (δ
s
>0). This choice is also
motivated by the fact that the resources with δ
s
>0 may
more likely refuse some activities, and this could lead
to re-running the procedure with a reduced margin on
the allowable stress level. In details, M
k
is 100 for
each activity k and P is 20. The parameter Q is set
to 10
5
, higher than M
k
, because the overtime should
be considered if strictly necessary, as it implies ad-
ditional costs. The parameter
¯
δ
w
i
was set to 0.2, in
accordance with Italian law limiting the maximum
amount of overtime possible per resource.
Experiments were performed on a machine with 4
cores, 2.3GHz with 32GB RAM. We used the com-
mercial optimization solver Cplex (release 20.1.0.0),
by setting its MIP tolerance equal to 0 and its time
limit equal to 300 seconds.
ICEIS 2025 - 27th International Conference on Enterprise Information Systems
818
Table 1: Average results of the two instances generated for |R | = 100.
N
A
MWL P
ref
|T| ξ
k
Rej. λ
k
MIP GAP Not Ass. Time (s) Res. δ
w
i
>0 δ
w
i
Res. δ
s
i
>0 δ
s
i
10 0.2 0.1 906.5 0.605 485 0.058 3.4E-3 0 300.9 17 0.000 1 0.009
10 0.2 0.2 374.5 0.418 129 0.122 8.3E-5 0 178.0 0 0.000 0 0.000
10 0.2 0.4 382 0.530 127 0.119 5.5E-5 0 300.2 0 0.000 0 0.000
10 0.4 0.1 360 0.474 176 0.101 3.7E-5 0 300.3 0 0.000 0 0.000
10 0.4 0.2 361.5 0.432 109.5 0.107 5.6E-5 0 276.0 0 0.000 0 0.000
10 0.4 0.4 468 0.447 168 0.077 3.2E-4 0 300.3 0.5 0.000 0 0.000
10 0.6 0.1 205.5 0.535 81 0.123 0 0 76.1 0 0.000 0 0.000
10 0.6 0.2 225 0.461 90.5 0.115 0 0 30.1 0 0.000 0 0.000
10 0.6 0.4 266 0.405 57 0.106 1.8E-6 0 186.4 0 0.000 0 0.000
20 0.2 0.1 409.5 0.434 198.5 0.122 8.3E-5 0 300.2 0 0.000 0 0.000
20 0.2 0.2 551.5 0.616 285.5 0.086 2.1E-4 0 300.4 0 0.000 0.5 0.012
20 0.2 0.4 454.5 0.585 150 0.108 6.7E-5 0 300.3 0 0.000 0 0.000
20 0.4 0.1 346 0.522 180 0.106 1.7E-5 0 300.1 0 0.000 0 0.000
20 0.4 0.2 413.5 0.600 213 0.088 1.1E-4 0 300.2 0 0.000 0 0.000
20 0.4 0.4 464 0.471 105.5 0.083 2.7E-5 0 300.2 0 0.000 0 0.000
20 0.6 0.1 394 0.564 227 0.070 1.0E-4 0 300.2 0 0.000 0.5 0.011
20 0.6 0.2 321.5 0.599 165.5 0.085 7.5E-5 0 300.1 0 0.000 0 0.000
20 0.6 0.4 376 0.433 102.5 0.073 2.5E-5 0 250.4 0 0.000 0 0.000
40 0.2 0.1 547 0.478 277.5 0.087 1.4E-4 0 300.2 0.5 0.013 0 0.000
40 0.2 0.2 519 0.518 231.5 0.086 2.0E-4 0 300.2 0 0.000 0 0.000
40 0.2 0.4 476.5 0.511 141 0.096 9.2E-5 0 300.2 0 0.000 0.5 0.011
40 0.4 0.1 398 0.491 220.5 0.092 7.1E-5 176 150.2 0 0.000 0.5 0.047
40 0.4 0.2 282 0.480 119.5 0.127 6.4E-6 0 193.3 0 0.000 0 0.000
40 0.4 0.4 393 0.536 131 0.094 7.5E-5 0 276.6 0 0.000 1.5 0.039
40 0.6 0.1 203 0.558 77.5 0.124 0 0 46.7 0 0.000 0 0.000
40 0.6 0.2 273.5 0.475 101.5 0.098 7.6E-6 0 198.8 0 0.000 0 0.000
40 0.6 0.4 327 0.480 88.5 0.086 4.4E-5 0 173.4 0 0.000 0 0.000
4.2 Results
Table 1 shows the average results of the two instances
generated for each combination of parameters. In de-
tails, it reports the parameters representing the pair
of instances (N
A
,MW L,P
re f
), the average number of
planned activities at time t when the instance is gen-
erated (|T|), the estimated level of stress (ξ
k
) of activ-
ities, the number of refused activities at time t (Rej.),
the average workload of activities (λ
k
), the average
percentage MIP GAP achieved by Cplex (MIP GAP),
the average number of activities not assigned in the
solution (Not Ass.), the average time taken to solve
the model (time), the average number of resources
who have been asked to work overtime (Res. δ
w
>0)
and their average overtime (δ
w
), the average number
of resources with additional level of stress (Res. δ
s
>0)
and their average additional stress level (δ
s
).
The model was solved to the optimality only for 3
instances. In the remaining instances, the percentage
MIP GAP ranges between 1.76E-06 and 3.40E-03.
As expected, there is a strong correlation between the
status of the solution (i.e., optimal or feasible) and the
number of refused activities. To overcome this issue,
one could increase either the time limit (i.e., higher
than 300 seconds) or the number of cores available to
Cplex. However, it should be noted that such a num-
ber of refusals, in an organization with at most 100
employees, seems to us very high and unlikely.
The number of unassigned activities is a critical
factor in ensuring the proper execution of daily op-
erations. In all instances except one, the obtained
solution assigns all the activities. When not all activ-
ities are assigned, if the total cost of delaying some
activities to the next days exceeds the cost of having
worked overtime, the penalty Q can be reduced.
As for the level of stress, the average δ
s
, calculated
only for those resources for which it is greater than 0,
ranges between 0.92% and 4.68% (2.153% on aver-
age), involving maximum 3 resources. This implies
that the probability a plan is not accepted, due to the
fact that some assignments exceed the stress level of
some resources, is very low. In any case, there would
be time to invoke Cplex several times to solve the
MILP model without generating dead time. In fact,
the average time remaining before the end of the cur-
rent activities, i.e. before the next activity starts, ex-
ceeds the time needed to solve the model. For each
instance, we calculated the average activity execution
time (using the λ
k
assigned to each planned activity
and considering an 8-hour workday). We assume that,
at the time the instance is generated, a resource has
already performed half of their current activity. The
result is that the remaining time is on average 4.69
times the time limit (i.e., 300 seconds) and on aver-
age, 109.15 times the time needed to find a solution.
Moreover, in the solutions with all the activities as-
signed, the overtime is rarely used and, if necessary,
Personalized Task Reassignment in Industry 5.0: A MILP-Based Solution Approach
819

with very low costs: on average, 3.28 minutes per re-
source required to work overtime (with values ranging
between 0.05 and 12.86 minutes), for a total of 4.14
minutes on average per instance.
5 CONCLUSION
In this work, we proposed an approach for addressing
the problem of reassigning activities to workers, bal-
ancing between efficiency and sustainability through
a flexible and periodic negotiation process. In fact,
workers can refuse assigned activities if these ex-
ceed a sustainable stress level, which is monitored
through wearable devices. We formulated the prob-
lem through MILP, in order to select the available re-
sources for performing the refused activities, at the
minimum total cost, under completeness, availability,
priority and sustainability constraints. An experimen-
tal campaign was carried out on a set of synthetic in-
stances and the numerical results were discussed by
also performing a sensitivity analysis.
As a future work, we plan to extend the experi-
ments considering real processes. Furthermore, de-
signing metaheuristic and/or matheuristic approaches
is worth of investigation, particularly for efficiently
addressing large-sized instances of the problem.
ACKNOWLEDGEMENTS
This work has been partially supported by the
PRIN 2022 project “HOMEY: a Human-centric IoE-
based Framework for Supporting the Transition To-
wards Industry 5.0”, funded by the European Union
- Next Generation EU, Mission 4 Component 1
(code: 2022NX7WKE, CUP: F53D23004340006)
and by the PNRR project FAIR - Future AI Research
(PE00000013), Spoke 9 - AI, under the NRRP MUR
program funded by the Next Generation EU.
REFERENCES
Arias, M., Munoz-Gama, J., Sepúlveda, M., and Miranda,
J. C. (2018). Human resource allocation or rec-
ommendation based on multi-factor criteria in on-
demand and batch scenarios. European Journal of In-
dustrial Engineering, 12(3):364–404.
Cabanillas, C., García, J. M., Resinas, M., Ruiz, D.,
Mendling, J., and Ruiz-Cortés, A. (2013). Priority-
based human resource allocation in business pro-
cesses. In International Conference on Service-
Oriented Computing, pages 374–388. Springer.
De Bruecker, P., Van den Bergh, J., Beliën, J., and Demeule-
meester, E. (2015). Workforce planning incorporating
skills: State of the art. European Journal of Opera-
tional Research, 243(1):1 – 16.
Diamantini, C., Genga, L., Potena, D., and van der Aalst, W.
(2016). Building instance graphs for highly variable
processes. Expert Systems with Applications, 59:101–
118.
Diamantini, C., Pisacane, O., Potena, D., and Storti, E.
(2024). Combining an lns-based approach and organi-
zational mining for the resource replacement problem.
Computers & Operations Research, 161:106446.
Hirsch, M. J. and Ortiz-Peña, H. (2017). Information sup-
ply chain optimization with bandwidth limitations.
International Transactions in Operational Research,
24(5):993–1022.
Kumar, A., van der Aalst, W. M. P., and Verbeek, H. M. W.
(2002). Dynamic work distribution in workflow man-
agement systems: How to balance quality and perfor-
mance. Journal of Management Information Systems,
18(3):157–194.
Leng, J., Sha, W., Wang, B., Zheng, P., Zhuang, C., Liu, Q.,
Wuest, T., Mourtzis, D., and Wang, L. (2022). Indus-
try 5.0: Prospect and retrospect. Journal of Manufac-
turing Systems, 65:279–295.
Liu, Y., Wang, J., Yang, Y., and Sun, J. (2008). A semi-
automatic approach for workflow staff assignment.
Computers in Industry, 59(5):463–476.
Pufahl, L., Ihde, S., Stiehle, F., Weske, M., and Weber,
I. (2021). Automatic resource allocation in business
processes: A systematic literature survey. Computing
Research Repository, abs/2107.07264.
Song, M. and van der Aalst, W. M. (2008). Towards com-
prehensive support for organizational mining. Deci-
sion Support Systems, 46(1):300 – 317.
Spivey, M. Z. and Powell, W. B. (2004). The dy-
namic assignment problem. Transportation science,
38(4):399–419.
Van Der Aalst, W. M., Reijers, H. A., and Song, M.
(2005). Discovering social networks from event logs.
Computer Supported Cooperative Work (CSCW),
14(6):549–593.
Xie, Y., Chien, C.-F., and Tang, R.-Z. (2016). A dynamic
task assignment approach based on individual work-
lists for minimizing the cycle time of business pro-
cesses. Computers & Industrial Engineering, 99:401–
414.
Zhao, W., Zeng, Q., Zheng, G., and Yang, L. (2017). The
resource allocation model for multi-process instances
based on particle swarm optimization. Information
Systems Frontiers, 19(5):1057–1066.
ICEIS 2025 - 27th International Conference on Enterprise Information Systems
820
