
On Unraveling Student Resilience and Academic Performance in Higher
Education
Aldy Gunawan
1 a
, Lim Ee-Peng
1 b
, Audrey Tedja Widjaja
1
, William Tov
2 c
, James Foo
3 d
and Lieven Demeester
4
1
School of Computing and Information Systems, Singapore Management University, 80 Stamford Road, Singapore
2
School of Social Science, Singapore Management University, 10 Canning Rise, Singapore, Singapore
3
Centre for Teaching Excellence, Singapore Management University, 81 Victoria Street, Singapore, Singapore
4
Lee Kong Chian School of Business, Singapore Management University, 50 Stamford Road, Singapore, Singapore
Keywords:
Resilience, Learning Experience, Academic Performance, User Study, Prediction Model.
Abstract:
The transition period from pre-tertiary to higher education levels is critical. We explore the role of resilience by
conducting a survey to investigate students’ resilience and the relationship with overall academic performance,
learning experience, and well-being. This effort is part of an initiative to develop strategies for better student
engagement in the academic program, enhance their resilience, and prepare them for a competitive job mar-
ket. We conclude that (i) high-resilience students are associated with better life satisfaction and are likely to
perform well academically, (ii) a favorable learning environment supports students to study and perform well
in the university, and (iii) academic program experience can contribute to students’ resilience. Additionally,
we demonstrate that a grade prediction model, developed using students’ historical performance, resilience
strength, learning experiences, and well-being, can accurately forecast their overall academic performance,
with an average prediction error as low as one letter grade difference from the actual grades.
1 INTRODUCTION
Students transitioning from pre-tertiary to higher ed-
ucation levels face various new challenges that come
along with a very different academic environment
and greater emphasis of both breadth and depth of
knowledge. How a student responds to these aca-
demic challenges can be estimated through their re-
silience (Pathak and Lata, 2018). Resilience is de-
fined as the capacity to show successful adaptation
despite challenging circumstances, such as stressful
events or adversity (Wu et al., 2013). In the academic
context, it allows students to adapt to university life
and to persist through academic challenges (Eisen-
berg et al., 2016). Most of the academic community
believes that resilient students demonstrate knowl-
edge proficiency and often perform well on assess-
ments (Crawford-Garrett, 2018).
To evaluate the impact of resilience on academic
a
https://orcid.org/0000-0003-0697-8619
b
https://orcid.org/0000-0003-0065-8665
c
https://orcid.org/0000-0002-4306-8860
d
https://orcid.org/0009-0007-0878-286X
results, previous research has focused on first-year
student grades as measured academic results (Prick-
ett et al., 2020). While those are indeed more di-
rectly related to the academic transition from pre-
tertiary to higher educations, little is known about
the resilience’s impact on longer-term academic out-
comes. Therefore, understanding our students’ re-
silience strength and providing initiatives to further
promote their resilience, so as to help them make
good progress in their studies and to produce high-
quality graduates are important. As resilience is be-
lieved to be positively associated with favorable psy-
chological outcomes (i.e. lower risk of depression,
greater life satisfaction, and better lifestyle behav-
ior) (MacLeod et al., 2016), understanding resilience
is important to strengthen their subjective well-being.
We investigate factors that influence undergradu-
ate student success, measured by the grade point av-
erage (GPA). We avoid using self-reported academic
success, which often involves subjective judgement.
Rather than limiting ourselves to the grades obtained
in the first-year academic study (Prickett et al., 2020),
we focus more on the overall GPA of the students, as
it is seen as the measure of student success in higher
208
Gunawan, A., Lim, E.-P., Widjaja, A. T., Tov, W., Foo, J. and Demeester, L.
On Unraveling Student Resilience and Academic Performance in Higher Education.
DOI: 10.5220/0013197500003932
In Proceedings of the 17th International Conference on Computer Supported Education (CSEDU 2025) - Volume 2, pages 208-215
ISBN: 978-989-758-746-7; ISSN: 2184-5026
Copyright © 2025 by Paper published under CC license (CC BY-NC-ND 4.0)

education programs (York et al., 2015). Furthermore,
as university students are likely to spend more time in
their own academic program, student experience has
been shown to positively correlate with their inten-
tion to persevere in the major (Barker et al., 2014). In
addition, we assess the relationship between student
experience and academic success.
We summarize the key novelties of our work here.
Firstly, we analyze the relationship between (i) stu-
dent resilience and academic performance, (ii) stu-
dent resilience and their subjective well-being, and
(iii) student experience and academic performance
across different terms. Secondly, we use students’
actual grades (i.e. extracted from their transcript
data) as the measure of academic performance to
improve both accuracy and efficiency of measure-
ment, instead of subjective ratings (i.e. perceived per-
formance or opinion) (Rodr
´
ıguez-Fern
´
andez et al.,
2018). Thirdly, we build a grade prediction model to
predict students’ overall academic performance based
on their historical performance, resilience, experi-
ence, and well-being. The model can also be used
to analyse importance of factors that affect students’
overall academic performance. Lastly, we show (i) a
positive correlation between resilience and academic
performance, (ii) a positive correlation between re-
silience and students’ well-being, (iii) favorable en-
vironment supports good learning and academic per-
formance in the university, and (iv) good academic
program experience can contribute to students’ re-
silience.
2 RELATED WORK
Several studies have focused on linking resilience
with academic performance. The positive associa-
tion between students’ resilience and academic per-
formance was also found in (Allan et al., 2014).
(Prickett et al., 2020) evaluated the relationship be-
tween students’ resilience and academic performance.
While the above works used student’s actual grade
as the measure of academic performance, there are
other research works using different measurements,
such as the quotient between the number of recog-
nized academic ECTS (European Credit Transfer Sys-
tem) and the number of registered ECTS of first-year
students (Ayala and Manzano, 2018), and the score of
three assessment items (Kwek et al., 2013).
The education research community has always
been interested in predicting students’ academic per-
formance. Academic performance prediction can
take many forms, including the prediction of course
grades (Okubo et al., 2017), prediction of term-
specific course grades (Widjaja et al., 2020), and the
cumulative GPA in the last term (Asif et al., 2017).
3 OUR STUDY DESIGN
To determine the relationship between students’ re-
silience and their overall academic performance, we
distributed questionnaires that assessed students’ gen-
eral and academic resilience, well-being, and senti-
ments regarding their academic program. We also
requested participants to share their most recent aca-
demic transcript.
We surveyed undergraduate students from the
Computing and Business schools of a university in
Asia from four cohorts (Academic Years (AYs) 2017
to 2020). A web-based user study interface has been
specially developed to minimize the effort required
for study participation. Our study consists of five
main steps (Figure 1). Step 1 collects the student pro-
file information and their latest academic transcripts
In Step 2, the study requires students to com-
plete Nicholson McBride Resilience Questionnaire
(NMRQ) that measures their general resilience scores.
NMRQ (Clarke and Nicholson, 2010) measures re-
silience strength using 12 statements on the five-point
likert scale from “strongly disagree (1)” to “strongly
agree (5)”. A high (or low) score indicates high (or
low) resilience. As high-resilience individuals could
experience better life satisfaction (Abolghasemi and
Varaniyab, 2010), we also include a Overall well-
being questionnaire to measure overall well-being of
students in Step 3 (Stephen et al., 2013) that com-
prises two survey items (VanderWeele et al., 2020):
1) Item 1 (Overall, how satisfied are you with your
life as a whole these days?) and 2) Item 2 (Overall, to
what extent do you feel the things you do in life are
worthwhile?). The agreement towards each statement
is expressed in a 0 to 10 likert scale score where 0
means “not at all” (or worst well-being) and 10 means
“completely” (or best well-being).
In Step 4, the study measures students’ resilience
in the academic context using Academic Resilience
Scale-30 (ARS-30). We used both NMRQ and ARS-
30 resilience measurements to investigate the rela-
tionship between student’s resilience and his/her aca-
demic performance. ARS-30 (Cassidy, 2016) mea-
sures academic resilience based on students’ adaptive
cognitive-affective and behavioral responses towards
academic adversity. The ARS-30 survey consists of
30 items categorized under three factors (i.e., “Per-
severance”, “Reflecting and adaptive-help-seeking”,
and “Negative affect and emotional response”) and
each item is answered on the five-point likert scale
On Unraveling Student Resilience and Academic Performance in Higher Education
209

Figure 1: Methodology.
from “likely (1)” to “unlikely (5)”. To compute the
overall ARS-30 resilience score, we reverse the scores
of positively phrased items and sum the scores of all
items together. A high overall score indicates high re-
silience. ARS-30 consists of three factors (Cassidy,
2016), namely:
• Perseverance: This factor reflects hard work
and trying, not giving up, sticking to plans and
goals, accepting and utilising feedback, imagina-
tive problem solving, and treating adversity as an
opportunity to meet challenges and improve as
central themes.
• Reflecting and adaptive-help-seeking: This fac-
tor includes reflecting on strengths and weak-
nesses, adjusting study approaches, seeking help,
support, and encouragement, monitoring effort
and achievements, and administering rewards and
consequences.
• Negative affect and emotional response: This
factor includes anxiety, catastrophizing, avoiding
negative emotional responses, pessimism. If a stu-
dent has a low score in this factor, it shows set-
backs have a negative effect on him/her.
Finally, Step 5 of the study considers students’ ex-
ternal environment. It measures student experience
in the academic program as students’ perceptions to-
wards school environment. We adopt the Student Ex-
perience of the Major questionnaire (NCWIT, 2021).
It evaluates 10 dimensions of a student’s academic
and social experiences within their academic program
or major. There are 65 items are from the original
SEM (NCWIT, 2021) and the remaining six items are
newly added by modifying two original SEM items to
measure the availability of social support in the aca-
demic program. We list the newly added items in Ta-
ble 1 and the respective original SEM items.
The measurement adopts a four-point scale of 1 to
4, where the higher score corresponds to more pos-
itive experience sentiment. The overall experience
Table 1: Newly added SEM items.
Original SEM
item (NCWIT, 2021)
New SEM item derived from the original
SEM item
The TAs for my
courses or labs are
good at
The students in my class are good at helping
me learn
helping me learn Other students who previously took the same
class as mine are good at helping me learn
The professors of my courses are good at
helping me learn
I got enough help from
TAs during scheduled
I got enough help from the students in my
class
lab time I got enough help from other students who
previously took the same class as mine
I got enough help from professors during
class time
sentiment (SEM score) is defined by the average of
all dimension scores. We managed to get 223 stu-
dents from the Computing and Business respectively.
Table 2 presents the average and standard deviation
values of all surveyed measures (i.e., NMRQ, ARS-
30, Well-being, and SEM). It is shown that in every
academic program, the average measurement scores
are always greater than the mid score of the respec-
tive theoretical range. The students are relatively re-
silient, as the NMRQ and ARS-30 scores are gener-
ally close to their respective maximum scores of 60
and 150. Students also generally enjoy good well-
being, as most of their well-being scores are well
above the minimum score of 10, and they exhibit a
positive experience sentiment in their academic pro-
gram, with SEM scores approaching the maximum
value of 4.
4 STUDY 1: STUDENTS’
RESILIENCE
As students progress through university, spending
most of the time in their academic programs and in-
teracting primarily with peers, we examine the effects
CSEDU 2025 - 17th International Conference on Computer Supported Education
210

Table 2: Survey statistics.
Statistics (mean ± standard deviation) Theoretical range
Computing Business Both [min, max]: mid
program program programs
NMRQ 39.45 ± 5.63 40.59 ± 6.04 40.03 ± 5.86 [12, 60]: 36
ARS-30 112.03 ± 14.65 113.61 ± 13.0 112.84 ± 13.82 [30, 150]: 90
Well-being 13.74 ± 3.49 13.88 ± 3.13 13.81 ± 3.3 [0, 20]: 10
SEM 2.97 ± 0.3 2.94 ± 0.28 2.95 ± 0.29 [1, 4]: 2.5
Cronbach’s alpha Acceptable alpha
Computing Business Both (Abraham and Barker, 2015)
program program programs
NMRQ 0.726 0.758 0.745 > 0.7
ARS-30 0.890 0.859 0.875 > 0.7
Well-being 0.851 0.818 0.836 > 0.7
SEM 0.874 0.868 0.868 > 0.7
of differences in academic programs and cohorts on
students’ resilience. Understanding how these exter-
nal factors impact resilience can inform the design of
targeted interventions for specific student groups. In
addition to external factors, we examine the relation-
ship between internal factors—such as students’ well-
being and their perceived experiences during their
academic program—and their resilience, referred to
as the internal effect. If students’ resilience posi-
tively correlates with their well-being, it underscores
the importance of fostering well-being among stu-
dents. If specific dimensions of students’ experiences
are found to correlate with resilience, academic in-
stitutions can implement activities designed to en-
hance these dimensions, thereby promoting greater
resilience among students.
4.1 External Effect
We investigate whether students from different aca-
demic programs and cohorts exhibit similar levels of
resilience. We performed a Mann–Whitney U test on
the NMRQ score distributions of students from two
different academic programs. There is no difference
on general resilience distributions between students
from these two programs. Similarly, we found no sig-
nificant difference in ARS-30 score distributions be-
tween students in computing and business programs.
To better assess resilience differences between co-
horts, we conducted statistical tests on NMRQ and
ARS-30 scores (Table 3). The test results reveal no
significant differences in resilience between student
cohorts across different academic programs.
4.2 Internal Effect
We hypothesize that positive correlations among gen-
eral resilience, academic resilience, and well-being
will reinforce personal characteristics and contribute
to better physical and mental well-being. We use
the overall NMRQ score to measure general life re-
silience, the ARS-30 score for academic resilience,
and the overall well-being score to assess life satis-
faction. We find positive correlations among all three.
These suggest that people who manage daily chal-
lenges (such as financial problems, relationship prob-
lems, and family problems) effectively are also likely
to handle academic challenges (such as exam fail-
ures or assignments difficulties) well. Furthermore,
the ability to cope with both daily and academic ad-
versities contributes to greater life satisfaction. This
underscores the importance of fostering resilience in
students to enhance their overall life satisfaction, sub-
jective well-being, and positive emotions.
To evaluate the relationship between students’ re-
silience and their experience sentiment in the aca-
demic program, we measure the correlation between
each ARS-30 factor and SEM dimension pair. We use
the top five correlations common to both Computing
and Business programs to highlight the most impor-
tant relationships.
• rflcting adptve help seek and fclty stu intrctn:
Enriching interactions between faculty members
and students can enhance students’ awareness and
encourage them to reflect and proactively seek
help when facing academic challenges.
• perseverance and rel mngful assgmnt: Relevant
and meaningful class assignments appear to have
a significant positive impact on students’ perse-
verance. This suggests that assignments connect
to real-world concepts, problems, or that are per-
sonally meaningful to students encourage them to
persist and not easily give up when facing chal-
lenges.
In the Computing program, we found that
class pdgogy and commit are significantly positively
correlated with all ARS-30 factors. This suggests that
effective classroom pedagogy and commitment to the
major positively impact various aspects of academic
On Unraveling Student Resilience and Academic Performance in Higher Education
211

Table 3: Statistical test for resilience score difference between cohorts: p-value (Confidence Interval).
Overall NMRQ score Overall ARS-30 score
Computing program
2018 2019 2020
2017 0.283(-2, 7) 0.556(-3, 5) 0.487(-3, 6)
2018 0.336(-4, 1) 0.607(-5, 3)
2019 0.843(-2, 3)
2020
Business program
2018 2019 2020
2017 0.914(-3, 4) 0.109(-1, 6) 0.422(-2, 7)
2018 0.083(0, 5) 0.310(-2, 5)
2019 0.601(-4, 3)
2020
Computing program
2018 2019 2020
2017 0.670(-10, 14) 0.209(-4, 14) 0.524(-8, 14)
2018 0.356(-4, 11) 0.876(-9, 12)
2019 0.494(-10, 5)
2020
Business program
2018 2019 2020
2017 0.808(-5, 8) 0.237(-2, 11) 0.135(-3, 18)
2018 0.343(-3, 9) 0.234(-4, 16)
2019 0.504(-6, 13)
2020
resilience. In the Business program, coll lrning is sig-
nificantly positively correlated with all ARS-30 fac-
tors. This suggests that increased opportunities for
collaborative learning enhance overall academic re-
silience.
5 STUDY 2: FACTORS
AFFECTING ACADEMIC
PERFORMANCE
We analyze the correlation between our re-
silience/SEM measures and FinalGPA, which
represents the student’s cumulative GPA in their
last observed term. We then conduct a statistical
test with α = 5%, as shown in Table 4. The results
indicate that general resilience is significantly pos-
itively correlated with FinalGPA in both academic
programs. High-resilience students are more likely to
excel academically. Interestingly, the NMRQ shows
a higher correlation with FinalGPA compared to the
ARS-30. This may be because the NMRQ captures
resilience from a broader range of perspectives. A
significant correlation is observed between FinalGPA
and ARS-30 neg effct emtional rsponse for Com-
puting students, indicating that a better emotional
response to setbacks is associated with improved
academic performance. For Business students, a
significant positive correlation between FinalGPA
and well-being suggests that greater life satisfaction
is linked to better academic performance.
Next, we investigate how students’ experiences
are correlated with their academic performance. We
find that Computing students have more experience
dimensions strongly correlated with their academic
performance compared to Business students. Specifi-
cally, in the Computing program, FinalGPA is signifi-
cantly correlated with SEM rel mngful assgmnt,
SEM class pdgogy, SEM stu stu intrctn,
SEM commit, SEM fclty stu intrctn, and
SEM ovrll stsfcn. In contrast, in the Business
program, a significant correlation is found only
between FinalGPA and SEM class pdgogy.
In addition to evaluating the impact of individual
resilience and SEM measures on students’ academic
performance, we aim to use these factors as features
to predict students’ final GPA. Furthermore, we in-
corporate students’ historical performance as an ad-
ditional predictor. This study aims to demonstrate:
(i) the impact of students’ historical performance on
their future performance, and (ii) the features that are
important determinants of FinalGPA.
Given a student’s i resilience strength, experience
in the major, and cumulative GPA (cumGPA) in the
k
th
term, we predict the students’s FinalGPA in the
last term (which occurs after the k
th
term). k can be
different values (i.e., k = 1, 2, . . . , 5) depending on the
cohort the student belongs to. For each k, we only
involve students whose final term is later than k. For
the prediction accuracy evaluation, we split these stu-
dents into training and testing sets using stratified 10-
fold or LeaveOneOut (LOO) method for the number
of students more than and less than 80 respectively
(Table 5).
In addition to using all NMRQ, ARS-30, SEM,
well-being, and cumulative GPA at term k as fea-
tures, we also include the cohort year to determine
the cohort of a student. We train a positive linear
regression (PLR) for predictions. The training data
is denoted by {x
i
, y
i
}
N
i=1
where y
i
is the FinalGPA
of student i and x
i
represents the p features of stu-
dent i, i.e., (x
i
∈ R
p
). PLR learns the weight w of
each feature vector (w ∈ R
p
) to minimize the residual
sum of squares between y
i
and ˆy
i
, the predicted Final-
GPA of student i. The trained PLR has w ≥ 0. We
add a L1 regularization term to the objective function,
weighted by λ. Formally, PLR minimizes
CSEDU 2025 - 17th International Conference on Computer Supported Education
212
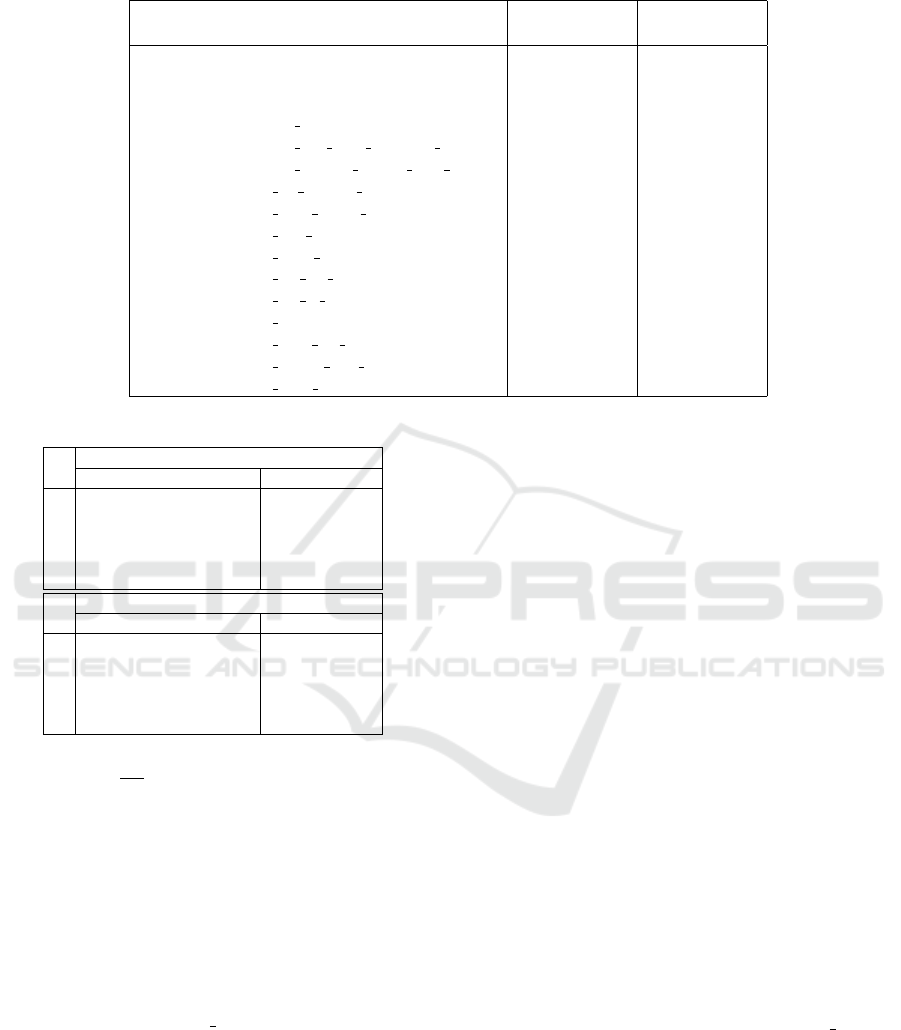
Table 4: Correlation coefficients and p-values between NMRQ/ARS-30/SEM survey measure and academic performance.
FinalGPA versus Measure Computing Business
program program
FinalGPA − NMRQ 0.23 (0.016)* 0.219 (0.019)*
FinalGPA − Well-being 0.118 (0.223) 0.195 (0.038)*
FinalGPA − ARS-30 0.135 (0.16) 0.048 (0.61)
FinalGPA − ARS-30 perseverance 0.052 (0.59) 0.007 (0.942)
FinalGPA − ARS-30 neg effct emtional rsponse 0.189 (0.049)* 0.056 (0.551)
FinalGPA − ARS-30 rflcting adptve help seek 0.13 (0.178) 0.052 (0.581)
FinalGPA − SEM rel mngful assgmnt 0.218 (0.023)* -0.034 (0.723)
FinalGPA − SEM pace wrkld exp -0.089 (0.359) 0.086 (0.361)
FinalGPA − SEM coll lrning 0.082 (0.397) 0.017 (0.857)
FinalGPA − SEM class pdgogy 0.232 (0.015)* 0.231 (0.013)*
FinalGPA − SEM stu stu intrctn 0.253 (0.008)* 0.168 (0.075)
FinalGPA − SEM stu ta intrctn 0.061 (0.528) 0.096 (0.313)
FinalGPA − SEM commit 0.246 (0.01)* 0.114 (0.226)
FinalGPA − SEM fclty stu intrctn 0.23 (0.016)* 0.09 (0.342)
FinalGPA − SEM prejdc free env -0.133 (0.168) 0.025 (0.792)
FinalGPA − SEM ovrll stsfcn 0.24 (0.012)* 0.112 (0.236)
Table 5: Student distribution over k’s.
k Computing program
Total num. of students Trg/Test Split
1 109 10-fold
2 90 10-fold
3 90 10-fold
4 40 LOO
5 40 LOO
k Business program
Total num. of students Trg/Test Split
1 114 10-fold
2 101 10-fold
3 100 10-fold
4 63 LOO
5 50 LOO
1
2N
||y − Xw||
2
2
+ λ||w||
1
The features used are 1) nmrq is the overall
NMRQ score of the student, 2) ars30 is a multi-
hot vector (vector size = 3), where each vector el-
ement represents a specific ARS-30 score factor, 3)
wellbeing is the overall well-being score of the stu-
dent, 4) sem is a multi-hot vector (vector size = 10),
where each vector element represents a specific ex-
perience dimension (i.e., relevant and meaningful as-
signments, pace and workload experience, collabora-
tive learning, etc.), 5) cum gpa is the cumulative GPA
of the student up to (including) term k, and 6) cohort
is a one-hot vector that represents the student’s cohort.
We introduce two baseline methods for compari-
son, namely: 1) Historical performance (HP) that
predicts student i FinalGPA using the cumulative GPA
up to term k, and 2) linear regression (LR) that uses
the same set of features as PLR, but without forcing
the weights to non-negative values. We use Mean Ab-
solute Error (MAE) to evaluate the prediction’s accu-
racy, which returns the average prediction grade error
against the ground truth.
To achieve the first objective, we evaluate the PLR
and the baseline methods for 1 ≤ k ≤ 5. Our exper-
imental results indicate that the HP method, which
simply uses the cumulative GPA at term k to pre-
dict the FinalGPA, performs surprisingly well. All
MAE values are kept below 0.3, which corresponds
to a one-letter grade difference (e.g., between A+ and
A). LR and PLR, however, outperform HP for all k
values. PLR slightly outperforms LR across all k val-
ues, likely due to reduced overfitting, as we limit the
feature weights to be non-negative. Finally, we ob-
serve that MAE decreases as k increases, consistent
with our earlier intuition that prediction becomes eas-
ier with larger k.
To understand the impact of students’ historical
performance, resilience, well-being, and sentiment
on their future performance, we analyze the learned
weights w from the PLR model, averaged across all
folds. For one-hot and multi-hot features with more
than one vector (e.g., ars30, cohort, and sem), we ag-
gregate the vectors by summation. In this context, a
feature with a higher weight signifies greater impor-
tance in predicting students’ future performance (i.e.,
FinalGPA). In both academic programs, cum gpa has
the highest weight, indicating that students’ future
performance strongly depends on their earlier perfor-
mance. This is particularly sensible because students
in earlier terms typically take foundational courses
that prepare them for more advanced courses in later
terms.
The next important feature is cohort. The cohort
information proves to be useful for this prediction
On Unraveling Student Resilience and Academic Performance in Higher Education
213
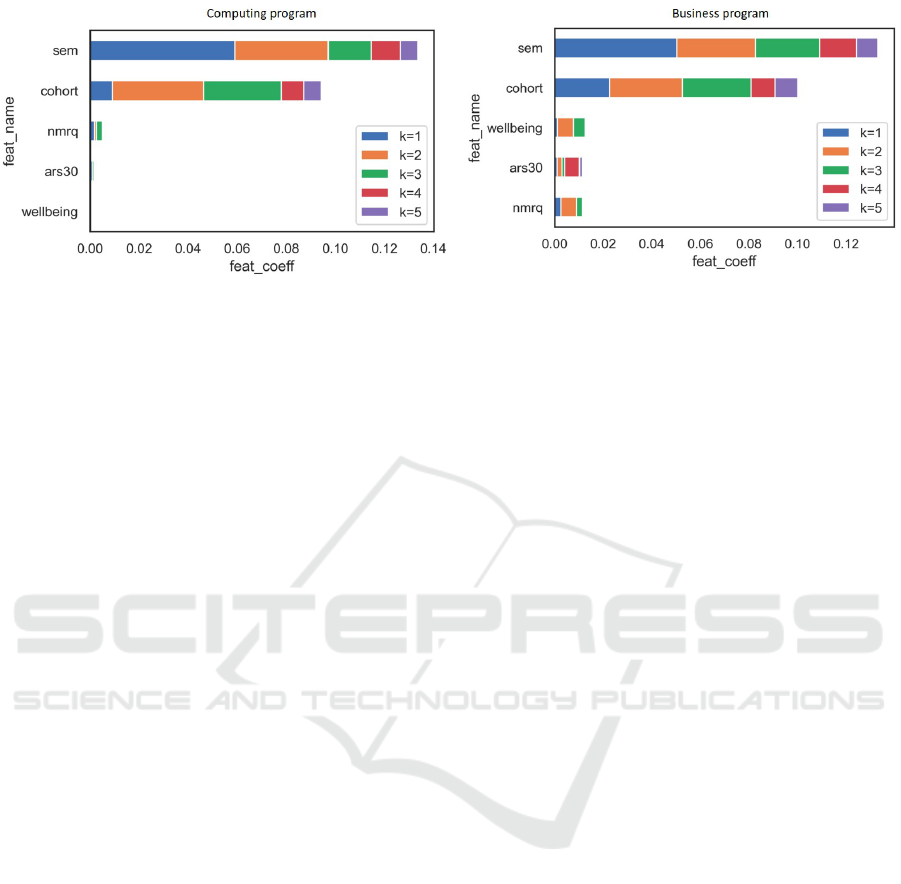
Figure 2: Features’ weight from PLR model.
task, as it helps differentiate students when predicting
their FinalGPA. For instance, the FinalGPA for stu-
dents in the 2017 cohort is based on their grades from
terms 1 to 8, while for students in the 2019 cohort,
it is based on grades from terms 1 to 4. The remain-
ing features do not receive large weights, which are
less important. However, we observe that FinalGPA
is more influenced by the academic program’s envi-
ronmental dimension of SEM than by the students’
resilience and well-being.
6 DISCUSSION
The study on students’ resilience reveals a positive
correlation between academic resilience, general re-
silience, and overall well-being. This suggests that
students who demonstrate high resilience in their
daily lives also exhibit high resilience in an academic
context, and that high-resilience students tend to have
better life satisfaction. Support systems help stu-
dents recognize when they need help and encourage
them to seek it, while meaningful assignments moti-
vate students to persist because they see the value in
what they’re learning. Creating a comfortable class-
room environment supports resilience in Computing
students, whereas providing more opportunities for
group work helps Business students build resilience.
These differences arise because Computing courses
focus more on individual work in classes and labs,
while Business courses involve more group projects.
Thus, comfort in class is more important for Comput-
ing students, while collaboration is more crucial for
Business students.
The second study demonstrates that a positive
learning experience and high resilience are associ-
ated with better academic performance. This find-
ing is consistent with existing research (Prickett et al.,
2020), which indicates that resilience benefits both
first-year and long-term students’ performance. Ef-
fective classroom practices, such as strong interac-
tions between instructors and students and providing
early, consistent feedback on assignments, also con-
tribute to improved student performance. The regres-
sion models indicate that students’ overall academic
performance is positively influenced by their histor-
ical performance, resilience, experience sentiment,
and well-being. However, when all these attributes
are included in the regression model, resilience has a
lower impact on overall academic performance com-
pared to SEM (Student Experience Measures). This
suggests that SEM might account for some of the
effects of resilience. It may be beneficial to focus
on enhancing learning experiences to improve re-
silience. This can be achieved by providing relevant
and meaningful assignments while considering the
curriculum’s pace and workload, increasing opportu-
nities for collaborative learning, ensuring a prejudice-
free teaching environment, and offering strong sup-
port systems from faculty, teaching assistants, and
peers.
As this study focuses primarily on evaluating
students’ academic performance, we also assessed
whether our student participants are representative of
the entire student population by comparing their fi-
nal GPAs to those of the broader student body. We
found that, except for the 2017 cohort in the Com-
puting program and the 2020 cohort in the Business
program, our participants generally have significantly
higher academic abilities. This suggests that the find-
ings of this study are more applicable to students with
relatively high academic performance. To address this
discrepancy, recruiting more participants could help
bridge the gap between the two groups.
7 CONCLUSION
A user study was conducted to analyze the impact of
student resilience and experience on long-term aca-
CSEDU 2025 - 17th International Conference on Computer Supported Education
214

demic performance. The study concluded that high-
resilience students tend to have greater life satisfac-
tion and are more likely to excel academically. Addi-
tionally, a supportive environment enhances students’
ability to study effectively and perform well at uni-
versity. Academic programs can implement various
initiatives to improve students’ perceived experiences
and strengthen their resilience.
The findings can inform curriculum design and the
learning environment in academic programs. Follow-
up studies should be conducted to evaluate their im-
pact. This could involve implementing initiatives as
academic interventions and measuring students’ re-
silience and academic performance before and after
the interventions. Further research on student expe-
riences and changes in resilience during and after the
COVID period would also be valuable.
REFERENCES
Abolghasemi, A. and Varaniyab, S. T. (2010). Resilience
and perceived stress: predictors of life satisfaction in
the students of success and failure. Procedia-Social
and Behavioral Sciences, 5:748–752.
Abraham, J. and Barker, K. (2015). Exploring gender
difference in motivation, engagement and enrolment
behaviour of senior secondary physics students in
new south wales. Research in Science Education,
45(1):59–73.
Allan, J. F., McKenna, J., and Dominey, S. (2014). Degrees
of resilience: profiling psychological resilience and
prospective academic achievement in university in-
ductees. British Journal of Guidance & Counselling,
42(1):9–25.
Asif, R., Merceron, A., and et al., S. A. A. (2017). An-
alyzing undergraduate students’ performance using
educational data mining. Computers & Education,
113:177–194.
Ayala, J. C. and Manzano, G. (2018). Academic perfor-
mance of first-year university students: The influence
of resilience and engagement. Higher Education Re-
search & Development, 37(7):1321–1335.
Barker, L., Hovey, C. L., and Thompson, L. D. (2014). Re-
sults of a large-scale, multi-institutional study of un-
dergraduate retention in computing. In Proceedings
of the 2014 IEEE Frontiers in Education Conference
(FIE), pages 1–8.
Cassidy, S. (2016). The academic resilience scale (ars-30):
A new multidimensional construct measure. Frontiers
in Psychology, 7(2016):1787.
Clarke, J. and Nicholson, J. (2010). Resilience: bounce
back from whatever life throws at you. Crimson, Ha-
chette, UK.
Crawford-Garrett, K. (2018). Lacking resilience or mount-
ing resistance? interpreting the actions of indige-
nous and immigrant youth within teachfirst new
zealand. American Educational Research Journal,
55(5):1051–1075.
Eisenberg, D., Lipson, S. K., and Posselt, J. (2016). Pro-
moting resilience, retention, and mental health. New
Directions for Student Services, 156:87–95.
Kwek, A., Bui, H. T., and et al., J. R. (2013). The impacts of
self-esteem and resilience on academic performance:
An investigation of domestic and international hospi-
tality and tourism undergraduate students. Journal of
Hospitality & Tourism Education, 25(3):110–122.
MacLeod, S., Musich, S., and et al., K. H. (2016). The im-
pact of resilience among older adults. Geriatric Nurs-
ing, 37(4):266–272.
NCWIT (2021). Survey-in-a-box: Student experience of
the major.
Okubo, F., Yamashita, T., and et al., A. S. (2017). Stu-
dents’ performance prediction using data of multiple
courses by recurrent neural network. In Proceedings
of the 25th International Conference on Computers in
Education (ICCE 2017), pages 439–444.
Pathak, R. and Lata, S. (2018). Optimism in relation to re-
silience and perceived stress. Journal of Psychosocial
Research, 13(2):359–367.
Prickett, T., Walters, J., and et al., L. Y. (2020). Resilience
and effective learning in first-year undergraduate com-
puter science. In Proceedings of the 2020 ACM Con-
ference on Innovation and Technology in Computer
Science Education, pages 19–25.
Rodr
´
ıguez-Fern
´
andez, A., Ramos-D
´
ıaz, E., and Axpe, I.
(2018). The role of resilience and psychological well-
being in school engagement and perceived academic
performance: An exploratory model to improve aca-
demic achievement. Health and Academic Achieve-
ment, 10(1):159–176.
Stephen, H., Lucy, T., and Paul, A. (2013). Measuring sub-
jective well-being and its potential role in policy: per-
spectives from the UK office for national statistics. So-
cial Indicators Research, 114(1):73–86.
VanderWeele, T. J., Trudel-Fitzgerald, C., and et al., P. A.
(2020). Current recommendations on the selection
of measures for well-being. Preventive Medicine,
133:106004.
Widjaja, A. T., Wang, L., Truong, N. T., Gunawan, A., and
Lim, E.-P. (2020). Next-term grade prediction: A ma-
chine learning approach. In Proceedings of the 13th
International Conference on Educational Data Min-
ing (EDM 2020).
Wu, G., Feder, A., Cohen, H., Kim, J. J., Calderon, S., and
et al., D. S. C. (2013). Understanding resilience. Fron-
tiers in behavioral neuroscience, 7:10–10.
York, T. T., Gibson, C., and Rankin, S. (2015). Defining and
measuring academic success. Practical Assessment,
Research, and Evaluation, 20(1):5–5.
On Unraveling Student Resilience and Academic Performance in Higher Education
215
