
Unsupervised Image Classification Algorithms Applied to Fire-Prone
Area Detection
I. Rahimi
1,2 a
, L. Duarte
1,2 b
and A. C. Teodoro
1,2 c
1
Department of Geosciences, Environment and Spatial Planning Faculty of Sciences of the University of Porto, Portugal
2
Institute of Earth Sciences, FCUP Pole, Porto, Portugal
Keywords: Remote Sensing, Wildfire, Classification, Zagros Mountains.
Abstract: Remote sensing data has become critical in identifying fire-prone areas, providing essential insights through
satellite imagery and various geospatial inputs. These data sources allow for real-time monitoring, mapping
fire susceptibility, and assessing factors such as vegetation, fuel moisture, land use, and environmental
conditions. Numerous supervised and unsupervised models combined with remote sensing data have shown
great potential in predicting fire-prone regions, offering accurate and timely information for early warning
systems and resource allocation. This study focuses on applying two unsupervised methods—PCA, and K-
means—using inputs like Sentinel-2 imagery, elevation, and the Zagros Grass Index (ZGI) to identify fire-
prone areas in the Kurdo-Zagrosian forests, an area increasingly vulnerable to wildfires. Among the two
methods evaluated, PCA demonstrated superior performance in predicting fire-susceptible areas, accurately
classifying 80% of the burned regions from 2021 to 2023 as moderate to high-risk zones.
1 INTRODUCTION
Forest fires' increasing frequency and intensity
worldwide is an escalating concern, driven by natural
and human-induced factors such as extreme weather
conditions, shifting land use patterns, and rapid urban
expansion (Zema, 2020; Bowman, 2017). These
factors, especially under the growing influence of
climate change, exacerbate the risk of wildfires. This
significant loss of forest cover highlights the urgent
need for effective wildfire monitoring and prevention
strategies.
In recent years, integrating geospatial and remote
sensing (RS) data/technologies has provided
invaluable insights into wildfire risk factors
(Teodoro, 2013). Through RS data, researchers can
monitor and analyze variables such as land cover,
temperature, and vegetation phenology (Duarte,
2018). This spatial data, combined with Geographic
Information Systems (GIS), allows for the continuous
monitoring of large areas and provides timely
information about the likelihood of fire incidents
(Mishra, 2024). RS data enables researchers to track
environmental changes in real time and analyze
a
https://orcid.org/0009-0002-7411-8637
b
https://orcid.org/0000-0002-7537-6606
c
https://orcid.org/0000-0002-8043-6431
critical variables such as fuel moisture content,
temperature trends, and human activity patterns, all of
which contribute to the increased risk of fires.
A key application of this technological
advancement is the development of Forest Fire
Susceptibility Maps (FSMs). These maps are crucial
for identifying areas at high risk of wildfires, enabling
authorities to allocate resources efficiently and
implement mitigation strategies in advance. By
locating and assessing fire-prone regions, FSMs play
a central role in reducing the vulnerability of
ecosystems and communities while supporting
informed ecological and urban planning decisions
(Ghorbanzadeh, 2019). The effectiveness of FSMs
has been significantly enhanced by integrating GIS,
RS, and image classification algorithms, allowing
researchers to predict fire susceptibility better and
improve early warning systems (Rihan, 2023).
The growing popularity of image classification
algorithms in fire susceptibility mapping is due to
their ability to process large-scale, high-dimensional
datasets and model complex non-linear relationships
more effectively than traditional statistical methods
(Kantarcioglu, 2023). These models perform well at
136
Rahimi, I., Duarte, L. and Teodoro, A. C.
Unsupervised Image Classification Algorithms Applied to Fire-Prone Area Detection.
DOI: 10.5220/0013201800003935
Paper published under CC license (CC BY-NC-ND 4.0)
In Proceedings of the 11th International Conference on Geographical Information Systems Theory, Applications and Management (GISTAM 2025), pages 136-141
ISBN: 978-989-758-741-2; ISSN: 2184-500X
Proceedings Copyright © 2025 by SCITEPRESS – Science and Technology Publications, Lda.
integrating diverse data types, from climatic
conditions and vegetation indices to human activity
metrics, which allows for more precise fire risk
assessments. In recent years, the development of FSM
has been advanced through both single-model
applications and ensemble methods, frequently
showing improved performance over more
conventional techniques (Piao, 2022; Saha, 2023).
These advancements underscore FSM's potential to
surpass traditional frameworks, particularly by
leveraging methods that incorporate broader
environmental and spatial analysis techniques.
Unsupervised classification methods, such as
Principal Component Analysis (PCA) and K-means
clustering, have proven valuable for extracting
meaningful patterns from satellite imagery. PCA
reduces large datasets into key components, capturing
the most significant variations (Sharma, 2021), which
is crucial for identifying fire susceptibility factors like
vegetation, moisture, and land use patterns. K-Means,
on the other hand, clusters satellite image data based
on spectral similarity, enabling the identification of
regions with similar environmental characteristics
(Theodoridis, 2009). These methods are especially
effective in handling large-scale, heterogeneous
datasets from RS data (Celik, 2009).
The objective of this study is to apply two
unsupervised image classification techniques—PCA
and K-means—using inputs like Sentinel-2 imagery,
elevation, and the Zagros Grass Index (ZGI) (Rahimi,
2024) to identify fire-prone areas in the Kurdo-
Zagrosian forests. This region, vulnerable to
increasing wildfire incidents, presents a complex
environmental landscape where these methods can
highlight patterns indicating higher fire susceptibility.
By utilizing unsupervised algorithms, the study aims
to provide a data-driven approach to wildfire
susceptibility mapping, improving prevention and
mitigation strategies in fire-prone regions.
2 METHODS
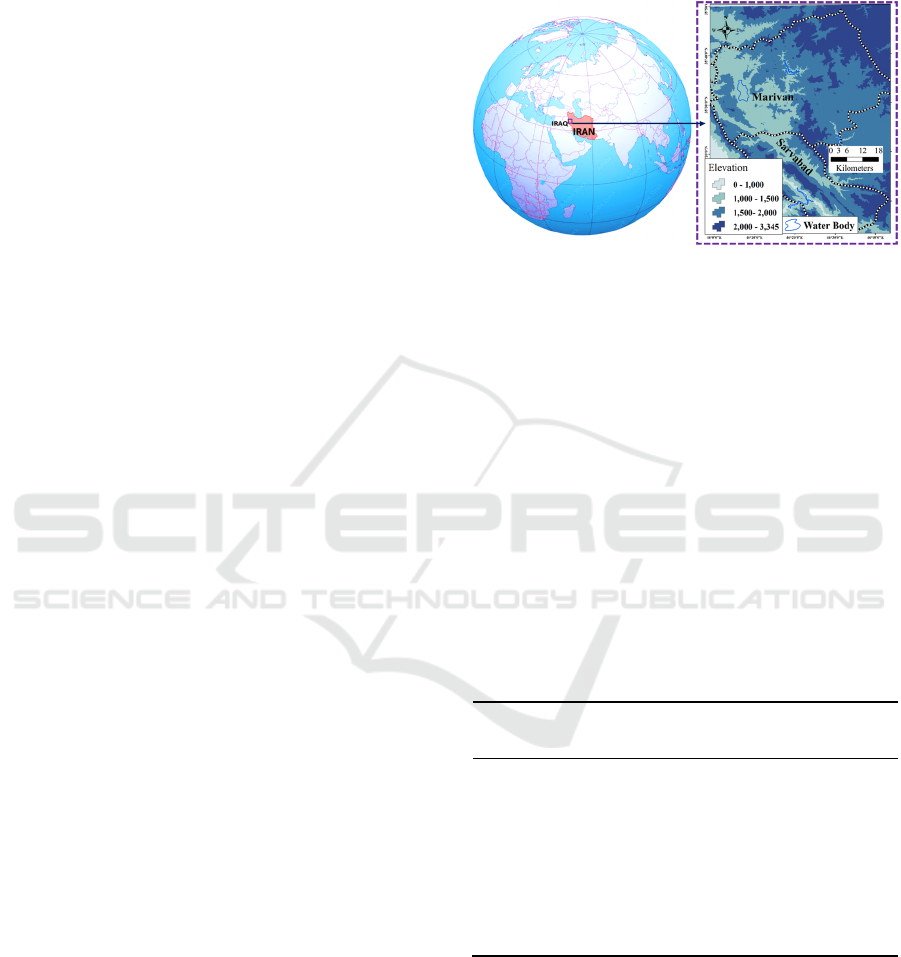
2.1 Study Area
The method is designed for areas with Semi-Arid
(SA) and Semi-Mediterranean (SM) climates,
exemplified by the forests of Marivan and Sarvabad
in the Kurdistan Province, western Iran, bordering
Iraq. These regions have experienced frequent fire
incidents over the past decade. Geographically, the
study area spans between longitudes 45°57'50" E and
46°46'41" E and latitudes 35°1'1" N and 35°49'51" N.
Located in the northern Zagros mountains, Marivan
sits at an average elevation of 1,287 meters above sea
level and features varied topography, from mountains
to valleys, shaped by its cross-border proximity with
Iraq (Rahimi, 2023).
Figure 1: Study area: Marivan and Sarvabad, Kurdistan
province, Iran.
The climate in this region is SM, characterized by
cold winters and hot summers. Annual rainfall
averages 991 mm, with considerable variability (±235
mm). Humidity averages around 54%, which is
insufficient to sustain green pastures during summer,
leaving behind dry grass that elevates fire risks
(Rahimzadeh, 2008).
2.2 Data Collection and Preparation
Table 1 summarizes the data used in this study.
Sentinel-2 satellite imagery and related products
provided high-resolution multispectral data essential
for environmental analysis and fire risk assessment.
Table 1: Data sources used.
Data Type, Projection
System, Spatial
Resolution (m)
Time Period
Data
Source
Sentinel 2
(13 bands), UTM
1
, 10
13/05/2020 and
15/09/2020
ESA
3
Sentinel Burned Area
Product, UTM, 10
2021 -2023
ZGI, UTM, 10 2020
(Rahimi,
2024)
DEM
/
SRTM
2
, UTM, 10 - USGS
4
1. Universal Transverse Mercator
2. Digital Elevation Model/Shuttle Radar Topography Mission
3. European Space Agency
4. United States Geolo
g
ical Surve
y
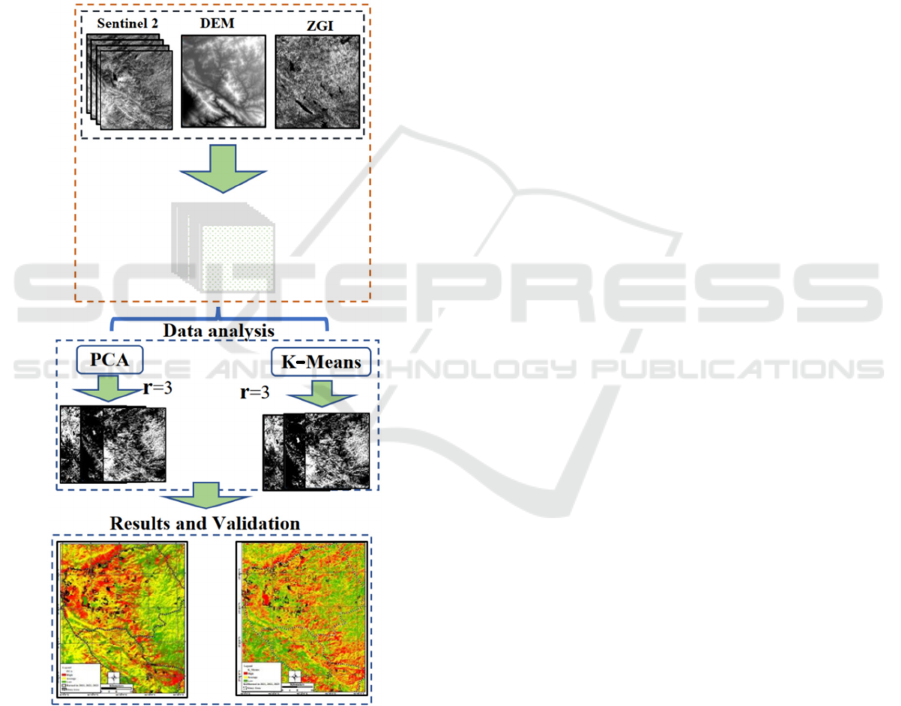
2.3 Methodology
The collected data layers were first stacked using
Python 3.12, ensuring spatial alignment and
consistency across all layers. To integrate Sentinel-2
and ZGI layers, the datasets were clipped to the
boundaries of the study area using a defined polygon.
Unsupervised Image Classification Algorithms Applied to Fire-Prone Area Detection
137
The clipped layers were then aligned to ensure
consistent spatial resolution and extent. Finally, the
processed layers were stacked into a multi-band raster,
enabling the combination of spectral information and
vegetation index data for subsequent fire susceptibility
analysis. This approach ensured a precise and
comprehensive dataset for modeling and assessment.
These layers were integrated into a matrix consisting
of all raster layers, which included Sentinel-2 bands
(13 bands), elevation, and the ZGI. The resulting
matrix had dimensions of 15×8020×6557, meaning
that 15 different values represented each pixel in the
study area. Figure 2 illustrates the methodology and
process flow of this approach.
Figure 2: Methodological framework.
This study employed PCA and K-means to detect
fire-prone areas effectively. To evaluate the
effectiveness of these models, the Leave-One-Out
(LOO) method was implemented, allowing for a
thorough assessment of how different data layers
contributed to fire susceptibility mapping. The
validation of the results with post-2020 data (from
2021–2023) demonstrated the reliability of these
methods for accurately predicting fire-prone areas
over time, showcasing their potential for long-term
wildfire risk assessment and management.
K-means and PCA were chosen as they are
common unsupervised methods suitable for studies
with limited field data. Unlike supervised learning
approaches, which require extensive datasets and
computational resources, these methods provide a
practical and efficient framework for fire
susceptibility classification. The components were
retained to classify fire susceptibility into high,
average, and low categories. This decision reflects the
study area's vegetation and land cover characteristics
alongside the limited field data available. This
approach balances capturing sufficient data variance
with the need for interpretability, ensuring robust and
practical classification.
To validate the results, the post-2020 burned area
was used. They derived from sentinel 2 by applying
the Normalize Burned Ratio (NBR) on data from
2021 to 2023 (Giddey, 2021). The NBR index proved
to be a valuable tool for identifying burned areas by
leveraging spectral differences between vegetation
and charred surfaces. This methodology ensured
reliable validation of the predictive models and
reinforced the importance of integrating remote
sensing indices into fire susceptibility research.
3 RESULTS
Figure 3 shows the results of applying PCA and K-
means. The results revealed varying levels of effective-
ness (High, Average, and Low) in predicting fire-prone
areas in the study region using 2020 data. The black
polygons are the burned areas calculated from Sentinel
2 data from 2021 to 2023, using the NBR index.
These patterns emphasize the spatial variability of
fire-prone areas, which is influenced by factors such
as vegetation type, fuel density, and topographic
conditions, as suggested by earlier studies (Rahimi et
al., 2024). The classification levels in this study were
established based on the number of components
selected for each of the unsupervised methods, PCA
and K-means, with three components defined for
optimal model performance in both cases. The trade-
off between preserving critical information and
minimizing computational complexity informed this
selection process for the number of components. By
reducing the dimensionality of the data, both PCA
and K-means enhanced interpretability while
maintaining the integrity of key predictive features
(Giddey, 2021).
GISTAM 2025 - 11th International Conference on Geographical Information Systems Theory, Applications and Management
138
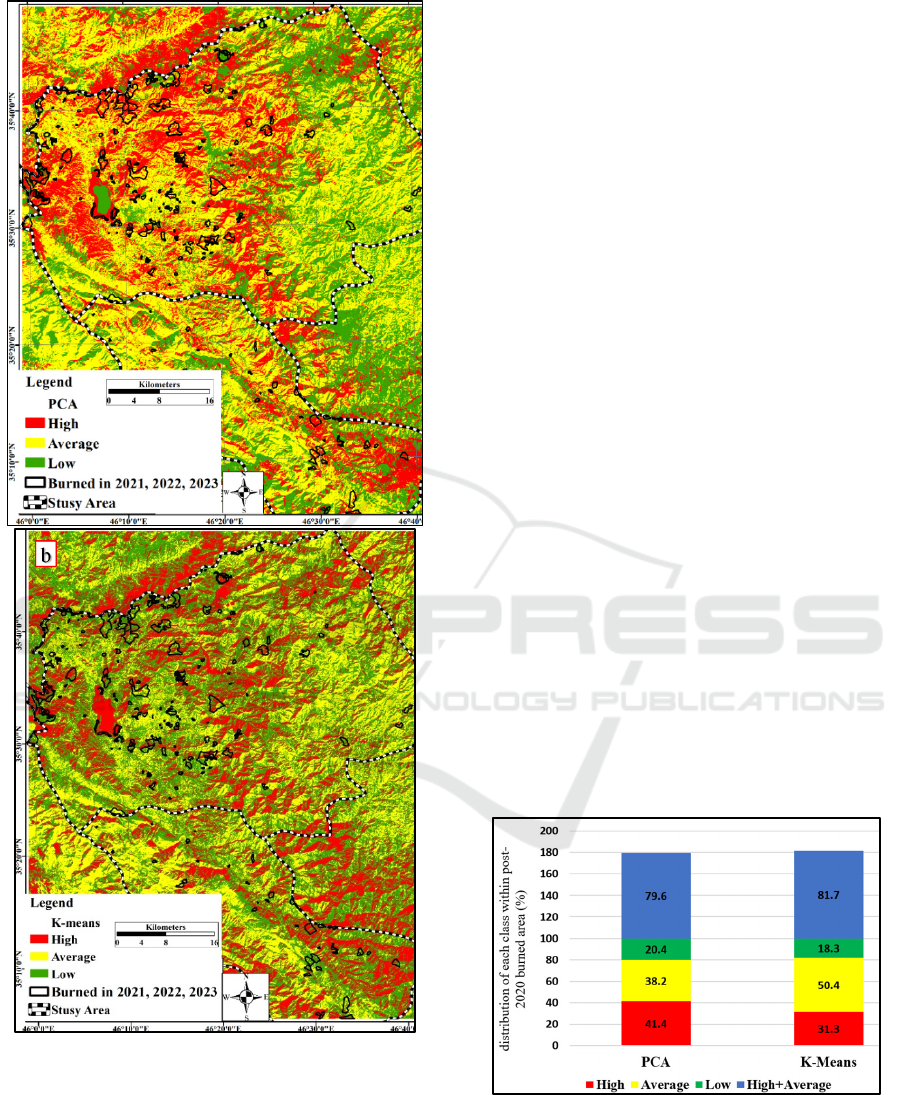
Figure 3: Maps generated by a) PCA and b) K-means
according to data in 2020. The black polygons demonstrate
the burned areas from 2021 to 2023.
The visual representation in Figure 3 highlights
distinct patterns of fire susceptibility zones, with clear
differentiation between regions of varying risk levels.
Among the methods, PCA produced the most
accurate and reliable results, as shown in Figure 3a,
compared to K-means (Figure 3b). The red areas
show high-fire susceptible areas, while the yellow
and green colors show the average and low-fire
susceptible areas. The stark contrast between the red
zones and the remaining areas underscores the ability
of PCA to highlight regions requiring urgent
attention. This distinction aligns with practical
applications in fire management, where prioritizing
high-risk zones can significantly enhance resource
allocation and mitigation efforts.
The validation process compared high-
susceptibility areas identified by the models with
actual burned areas in subsequent years. PCA
exhibited a higher overlap between its predicted high
fire-susceptible zones and the areas affected by post-
2020 wildfires, with approximately 41%. In contrast,
this value was 31.3% for the K-means (Figure 4). This
significant difference in overlap suggests that PCA's
ability to identify subtle patterns in the data gives it a
clear edge over K-means. The higher accuracy of
PCA aligns with its proven effectiveness in
environmental modeling and its capacity to extract
critical components from high-dimensional datasets.
Regarding High and Average fire-prone areas
together, both methods offered almost the same
results. This indicates that PCA outperformed the K-
means models in accurately detecting fire-prone
regions, highlighting its robustness in mapping fire
susceptibility. However, the similar performance of
the two methods in identifying combined High and
Average susceptibility areas suggests that K-means
may still hold utility in broader-scale applications
where granular accuracy is less critical. This
underscores the need for selecting methods based on
specific use-case requirements.
Figure 4: Detection of fire-prone areas for the post-2020
years by 2020’s data using PCA and K-means.
Moreover, the analysis indicated that certain
Sentinel-2 spectral bands could be excluded without
substantially reducing the model's accuracy. This
b
Unsupervised Image Classification Algorithms Applied to Fire-Prone Area Detection
139

finding highlights the efficiency of PCA in
dimensionality reduction, where less critical spectral
bands are discarded while retaining the most
informative features. Such optimization reduces
computational demands and facilitates faster data
processing, which is crucial for large-scale studies
(Kantarcioglu, 2023). This suggests that PCA
effectively reduced dimensionality, preserving only
the most informative features while maintaining high
predictive accuracy. The ability to maintain
predictive accuracy while reducing data complexity
makes PCA an attractive option for fire susceptibility
mapping, particularly in resource-constrained
settings where computational efficiency is essential.
The fact that the PCA model consistently provided
reliable predictions across multiple years
demonstrates its potential for long-term application in
fire susceptibility mapping.
This consistency underscores PCA’s robustness
and adaptability, especially in evolving
environmental conditions and fire patterns. Its
reliability across diverse temporal datasets reaffirms
its suitability for integration into long-term fire
management frameworks.
4 CONCLUSIONS
In conclusion, this study highlights the effectiveness
of using RS data combined with unsupervised image
classification techniques to identify fire-prone areas
in the Kurdo-Zagrosian forests. Among the two
methods tested, PCA performed better in accurately
predicting fire-susceptible zones, with 80% of the
burned areas from 2021 to 2023 correctly classified
as moderate to high-risk. Its ability to reduce
dimensionality while preserving critical information,
especially when excluding less relevant Sentinel-2
bands, further solidifies PCA as a robust tool for long-
term fire risk mapping. In contrast, K-means showed
moderate success, identifying around 50% of the
burned areas. These findings emphasize the potential
of PCA for improving fire management strategies,
while K-means may require further refinement to
achieve similar predictive accuracy.
In the future, more unsupervised classification
methods will be compared to further evaluate their
effectiveness and explore potential improvements in
fire risk prediction.
ACKNOWLEDGMENTS
The work is funded by national funds through FCT –
Fundação para a Ciência e Tecnologia, I.P., in the
framework of the UIDB/04683/2020 (https://doi.org/
10.54499/UIDB/04683/2020) and UIDP/04683/2020
633 (https://doi.org/10.54499/UIDP/04683/2020) –
Instituto de Ciências da Terra programs.
REFERENCES
Bowman, M.J.S.D.; Moreira-Munoz, A.; Kolden, C.A.;
Chavez, R.O.; Munoz, A.A.; Salinas, F.; Gonzalez-
Reyes, A.; Rocco, R.; de la Barrera, F.; Williamson,
G.J.; et al. Human- Environmental Drivers and Impacts
of the Globally Extreme 2017 Chilean Fires. Ambio
2018, doi:10.1007/s13280-018-1084-1
Celik, N. T. (2009). Unsupervised Change Detection in
Satellite Images Using Principal Component Analysis
and $k$-Means Clustering. IEEE Geoscience and
Remote Sensing Letters, 6(4), 772–776.
https://doi.org/10.1109/lgrs.2009.2025059
Duarte, L., Teodoro, A., Monteiro, A.T., Cunha, C., &
Gonçalves, H., "PhenoMetrics: An open source
software application to assess vegetation phenology
metrics," Computers and Electronics in Agriculture
148, 82–94 (2018); https://doi.org/10.1016/j.compag.2
018.03.007.
ESA European Space Agency (ESA), "Copernicus Open
Access Hub, Sentinel-2 Level-2A products,"
https://scihub.copernicus.eu.
Ghorbanzadeh, O.; Valizadeh, K.K.; Blaschke, T.; Aryal,
J.; Naboureh, A.; Einali, J.; Bian, J. Spatial prediction
of wildfire susceptibility using field survey GPS data
and machine learning approaches. Fire 2019, 2(3), 43.
https://doi.org/10.3390/fire2030043.
Giddey, B. L., Baard, J. A., & Kraaij, T. (2021).
Verification of the differenced Normalised Burn Ratio
(dNBR) as an index of fire severity in Afrotemperate
Forest. South African Journal of Botany, 146, 348–353.
https://doi.org/10.1016/j.sajb.2021.11.005
Kantarcioglu, O.; Schindler, K.; Kocaman, S. Forest fire
susceptibility assessment with machine learning
methods in north-east Türkiye. Int. Arch. Photogramm.
Remote Sens. Spatial Inf. Sci. 2023, XLVIII-M-1-2023,
161–167. https://doi.org/10.5194/isprs-archives-xlviii-
m-1-2023-161-2023.
Mishra, M.; Guria, R.; Baraj, B.; Nanda, A.P.; Santos,
C.A.G.; Da Silva, R.M.; Laksono, F.A.T. Spatial
analysis and machine learning prediction of forest fire
susceptibility: A comprehensive approach for effective
management and mitigation. Sci. Total Environ. 2024,
926, 171713. https://doi.org/10.1016/j.scitotenv.2024.1
71713.
Piao, Y.; Lee, D.; Park, S.; Kim, H.G.; Jin, Y. Forest fire
susceptibility assessment using Google Earth Engine in
Gangwon-do, Republic of Korea. Geomatics Nat.
GISTAM 2025 - 11th International Conference on Geographical Information Systems Theory, Applications and Management
140

Hazards Risk 2022, 13, 432–450. https://doi.org/
10.1080/19475705.2022.2030808.
Rahimi, I., Duarte, L., & Teodoro, A. C. (2024). Zagros
Grass Index—A new vegetation index to enhance fire
fuel mapping: A case study in the Zagros Mountains.
Sustainability, 16(10), 3900. https://doi.org/10.3390/su
16103900
Rahimzadeh Bajgiran, P., Darvishsefat, A., Khalili, A., &
Makhdoum, M., (2008). "Using AVHRR-based vegeta-
tion indices for drought monitoring in the Northwest of
Iran," Journal of Arid Environments 72, 1086–1096
Rihan, M.; Bindajam, A.A.; Talukdar, S.; Shahfahad;
Naikoo, M.W.; Mallick, J.; Rahman, A. Forest fire
susceptibility mapping with sensitivity and uncertainty
analysis using machine learning and deep learning
algorithms. Advances in Space Research 2023, 72(2),
426–443. https://doi.org/10.1016/j.asr.2023.03.026.
Saha, S.; Bera, B.; Shit, P.K.; Bhattacharjee, S.; Sengupta,
N. Prediction of forest fire susceptibility applying
machine and deep learning algorithms for conservation
priorities of forest resources. Remote Sensing
Applications: Society and Environment 2023, 29,
100917. https://doi.org/10.1016/j.rsase.2022.100917.
Sharma, D., Sharma, T., & Singhai, J. (2021). Extraction of
Water Bodies from Visible Color Satellite Images
Using PCA Feature Map. 2021 IEEE International
India Geoscience and Remote Sensing Symposium
(InGARSS), 1–4. https://doi.org/10.1109/ingarss515
64.2021.9791857
Teodoro, A.C., Duarte, L., (2013).Forest fire risk maps: a
GIS open source application a case study in Norwest of
Portugal, International Journal of Geographical
Information Science 27(4), DOI:10.1080/13658816.20
12.721554.
Theodoridis, S., & Koutroumbas, K. (2009). Clustering
Algorithms III: Schemes based on Function
Optimization. In Elsevier eBooks (pp. 701–763).
https://doi.org/10.1016/b978-1-59749-272-0.50016-5
USGS EROS Archive - Digital Elevation - Shuttle Radar
Topography Mission (SRTM), https://www.usgs.gov/
centers/eros/science/usgs-eros-archive-digital-
elevation-shuttle-radar-topography-mission-srtm-1.
Zema, D.A.; Nunes, J.P.; Lucas-Borja, M.E, (2020).
Improvement of Seasonal Runoff and Soil Loss
Predictions by the MMF (Morgan-Morgan-Finney)
Model after Wildfire and Soil Treatment in
Mediterranean Forest Ecosystems. Catena, 188,
104415, doi: 10.1016/j.catena.2019.104415
Unsupervised Image Classification Algorithms Applied to Fire-Prone Area Detection
141
