
Are Londoners Getting Healthier?
Yijing Li
a
, Sijie Tan, Xiangbo Chang and Xiaohui Chen
CUSP London, Department of Informatics, King’s College London, U.K.
Keywords: Obesity, Mental Health, London, Spatial Pattern.
Abstract: It utilised urban data from multiple sources, to map out the physical health and mental health patterns in
London over space and time. On basis of recognising the spatial patterns trajectory changes, obesity among
adults and children in London areas had been investigated with selected demographic, socio-economic and
environmental factors, to identify the most influential factors in all, and for local community; similarly,
workflow had been again designed to investigate the influential factors for mental health prevalence as well.
Upon comparing the selected models, models considering neighbourhood spillover effect has been found to
be the optimal, to identify significantly influential factors on urban health, such as age group, green space
access, household deprivation, income deprivation and air quality. The findings underscore the necessity for
targeted, location-specific public health interventions to effectively combat obesity; highlight the importance
of spatial heterogeneity, offering detailed insights into regional variations; and suggest tailored strategies for
public health policies. This work fills a critical gap and demonstrates the need for geographically informed
public health strategies.
1 INTRODUCTION
As the capital of UK, health statuses for London
residents have always been the prime topic, and could
be interpreted from mainly two strands, the physical
health and the mental health. The former strand has
been found to be with “overweight and obesity
represent probably the most widespread threat” to
physical health (Department of Health and Social
Care, 2011), requiring for leaders’ implementing
public health measures to reduce obesity, such as the
Mayor’s London Food Strategy to tackle with obesity
and provide a framework for assessing the impact of
these policies (PHE, 2020). The latter strand is a
crucial component of human being’s overall well-
being and is closely linked to physical health (NHS
England, 2020), hence organisations such as PHE and
the GLA regularly publish reports and datasets that for
further investigations (Rosenberg, 2019). It also
inspired empirical studies investigate the significant
socioeconomic disparities among London, suggesting
influential socioeconomic factors may drive the
disparities among London regions (Mayor of London,
2018). However, there is a lack of evidence on status
quo patterns of Londoners’ health: are they becoming
a
https://orcid.org/0000-0002-9831-0298
healthier over time? Are there any regional variations
for London residents’ health statuses, for either
physical health or mental health? If so, what are the
influential factors driving such differences?
To address above questions, this project aims to
explore the latest obesity and mental health levels
among London residents, on basis of multiple openly
accessed datasets from varied sources, to map out the
health spatial patterns changes in London in recent
decade by age group, to investigate the driving forces
from socio-economic contexts and environmental
measures, so to serve the potential strategic policy
adjustments among relevant stakeholders for
healthcare equity and improvement in the city.
2 BACKGROUND AND
EMPIRICAL STUDIES
2.1 London Demographics
London is formed by City of London and other 32
boroughs, further breakdown into 417 Middle layer
Super Output Areas (MSOAs) or 4835 Lower Super
Output Areas (LSOA) (ONS, 2011), with residents
Li, Y., Tan, S., Chang, X. and Chen, X.
Are Londoners Getting Healthier?.
DOI: 10.5220/0013203300003935
Paper published under CC license (CC BY-NC-ND 4.0)
In Proceedings of the 11th International Conference on Geographical Information Systems Theory, Applications and Management (GISTAM 2025), pages 15-26
ISBN: 978-989-758-741-2; ISSN: 2184-500X
Proceedings Copyright © 2025 by SCITEPRESS – Science and Technology Publications, Lda.
15

around 8.9 million (ONS Census 2021, 2022), and is
well-known for its ethnic and cultural diversity in that,
residents in London speak more than 300 languages
and come from a wide range of ethnic backgrounds
(GLA, 2020). High level of population diversity
brings the mayor’s manifesto commitment on a
“fairer, healthier and more equal” London (Mayor’s
Office, 2022) become a prominent but challenging
topic, hereafter the necessity to understand
Londoners’ status quo health levels.
2.2 Obesity as a Measure for Physical
Health
As defined by WHO (2024), obesity is the excessive
accumulation of fat that poses a threat to health,
which commonly measured by body mass index
(BMI), where people with higher BMI may expose
to higher risk of obesity-related health
complications. From WHO’s classification, adults
with obesity are normally categorised into Grade I
obesity (BMI at 30-34.9), Grade II obesity (BMI at
35-39.9), and Grade III obesity (also known as
morbid obesity, BMI at 40 or above); children’s
obesity is defined by age-specific BMI percentiles at
or above the 95
th
percentile for their age and sex.
Individuals diagnosed with obesity were related
to potential health problems by their age groups,
stages of growth and development. For example,
children are normally thought to experience high
metabolic rate and rapid physical and psychological
changes (Stamatakis et al., 2010), with potentially
long-term health influences into their adulthood. On
the contrary, adults have a relatively lower metabolic
rate and a mature lifestyle and eating habits, hence
obesity developed during adulthood will be
associated with chronic diseases such as heart
disease and diabetes. Their living environments are
taken as influential to the development of obesity
symptoms. For instance, access to recreational
facilities, availability of healthy food, transport
infrastructure, and the built environment are
important shaping residents’ lifestyles, then affect
local obesity rates. The city’s extensive public
transport network, abundant green spaces and
walkability create a unique environment for
assessing the impact of urban design on physical
activity levels and eating habits (ONS, 2019). Recent
research on adult obesity has highlighted the
complex interplay of multiple influencing factors,
including socioeconomic status, dietary habits,
physical activity, and environmental conditions.
Stafford et al. (2010) enriches this discussion by
highlighting that, obesity trends are severe among
population from poorer socioeconomic backgrounds
in developed countries. For example, people with
lower incomes may face food insecurity, leading to
poorer diet quality and higher rates of obesity. These
findings reflect the broader claim that,
socioeconomic disadvantage is a key determinant of
health disparities. Focusing on environmental
factors, Shenassa et al. (2006) highlighted the
significant correlation between sedentary lifestyles
and obesity in Europe. Hobbs (2022) emphasized the
impact of the environment on the level of physical
exercise, which in turn affects the management of
obesity, thus showing the importance of public space
and parks. Furthermore, as highlighted by the 2018’s
Health Survey for England (NHS England, 2019),
the availability of physical activity facilities versus
fast food options illustrates the environmental
opportunities and risks that contribute to obesity.
These environmental determinants of obesity
interact intricately with sociodemographic factors.
Children’s development of obesity symptoms
was found to have varied but interrelated factors
from adults, which were mostly the home
environment, school policies, access to recreational
facilities, and nutrition education (Schratz et al.,
2023). The impact of parental obesity and family
eating habits is particularly strong in that, parental
obesity, especially maternal obesity, greatly
increases the risk of childhood obesity due to shared
genetic and environmental factors (Kral and Rauh,
2010). Stafford et al. (2010) found that children from
disadvantaged backgrounds, such as families from
lower incomes or manual labors, are at greater risk
of high obesity rates. Schools also play a vital role in
tackling with childhood obesity in that, schools that
promote physical activity and provide healthy meal
choices can encourage children to make healthier
lifestyle choices, hence greatly reduce obesity rates
(Veitch et al., 2011). Public spaces such as parks
with good accessibility and playgrounds with good
quality of recreational facilities are vital, for
maintaining a healthy weight for children since its
encouragement of children’s proper levels of
physical activity (Van Lippevelde et al., 2012).
Besides, educational programs provided by the city
or local about healthy eating habits, can also
effectively prevent childhood obesity and help
families make informed choices about nutrition and
physical activity, leading to healthier lifestyles
(Story et al., 2009). NHS England (2023) 2022/23
school year report uncovered that, obesity rates were
higher among children from deprived areas, for
example, among Year 6 children 30.2% of children
in the most deprived areas were obese, compared
GISTAM 2025 - 11th International Conference on Geographical Information Systems Theory, Applications and Management
16

with 13.1% in the least deprived areas. These
insights highlight the importance of national child
and adolescent health programs in guiding public
health policy and ensuring that resources are directed
to the most affected communities. The programme’s
data will be crucial for developing effective health
interventions and promoting healthy lifestyles
among children in England.
2.3 Mental Health
On the other hand, mental health is another strand for
Londoners’ health issue. Chronic physical diseases
increase as mental health levels decline (Yang et al.,
2020). It can directly affect people’s life experiences
and quality of life in that, better mental health allows
individuals to utilize their abilities and align with the
broader values of society (Yang et al., 2006).
However, it was not until the 1990s that people
gradually realised the wider impacts of mental
illness (Zhu et al., 2020). Mental health is defined as
a state of well-being where individuals recognize
their own abilities, can handle daily life stresses,
works productively, and contributes to society
(Daghagh et al., 2019). Mental health consists of the
hedonic dimension, which focuses on well-being,
fulfilment, and avoidance of pain, and the
eudaimonic dimension, which includes personal
growth, personal objectives, and mental functioning
(Henderson and Knight, 2012; Ryan and Deci,
2001). The Public Health Agency of Canada
(PHAC) defines mental health as the capabilities that
every person possesses that enable them to
experience emotions, think critically, and behave in
ways that enhance their life enjoyment and their
capacity to cope with challenges (Heather et al.,
2017), especially in that, positive emotional and
mental health that values the importance of culture,
fairness, social equality, interconnectedness, and
individual dignity (Heather et al., 2017).
To better measure citizens’ mental health, Keyes
(2002) proposed the “Mental Health Continuum”
(MHC) model comprises of emotional well-being,
psychological wellbeing, and social well-being.
Headey et al. (1993) emphasized the dimensions on
such as life satisfaction, positive emotions, anxiety
and depression including factors such as
socioeconomic status, social support, and life events,
while the uneven distribution of these factors in
different geographical areas may lead to significant
differences in mental health status. Dfarhud (2014)
reviewed that there are two dimensions which
influence people’s mental health, which are
endogenic factors and exogenic factors. Endogenic
factors included the biological, cognitive,
personality and ethical, which are challenging to be
quantified, while exogenic factors, such as
greeneries, are convenient factors to evaluate their
influences on mental health. Markevych et al. (2017)
suggested that the greenspace could enhance the
interpersonal communication, relieve the pressure
and protect the environment, all these advantages are
generally related to the mental health. Vires et al.
(2003) runs a test with 10,000 people and found that
greener area benefits human’s mental health,
especially for the elderly and housewives. Gianfredi
(2021) said that the publicly accessible greenspace
in urban area has positive influence on both physical
activity and mental health, and Lachowycz (2013)
suggested that the greenspace area influences people
potentially, even for those people do not walk in the
greenspace they would feel more satisfied.
2.4 Spatial Analytics to Understand
Urban Health
A comprehensive understanding of the various
aspects of physical health and mental health can
support better strategic policies on appropriate
interventions to address areas where poor health is
prevalent among London regions. In assistance of
the development of geographical information system
(GIS) and relevant analytical techniques, geospatial
models and tools had been widely utilised in
identifying the spatial patterns of obesity. For
example, Sun et al. (2020) used spatial regression
models, SAR and ESF, onto childhood obesity
analysis and drew associations between childhood
obesity prevalence and variables such as population
density, race, unemployment rate, and household
income. Cetateanu and Jones (2014) have used
ESDA techniques to identify spatial clusters of
obesity in England, on basis of Global Moran’s I and
Local Indicators of Spatial Association (LISA), they
found important clusters of high rates of obesity in
urban areas and low rates of obesity in rural areas,
further highlighted the need for targeted public
health interventions in specific regions (Anselin et
al., 2006). In London, environmental factors such as
socioeconomic deprivation and access to green
space, has presented similar spatial clustering
patterns (Gaber et al., 2024), which were suggested
to be interlinked with the relationship fast-food
restaurants and supermarkets on obesity rates (ESRI,
2021). Grigoroglou et al. (2019) illustrated that
depression prevalence, to reflect mental health
status, could be identified of their spatial clustering
patterns through Moran’s I measure.
Are Londoners Getting Healthier?
17

Underweight men were found to have higher
rates of anxiety disorders compared to normal-
weight men and women (McLaren et al., 2008), and
obese women have higher rates of mood disorders
compared to normal-weight women. Daghagh Yazd
et al. (2019) also agreed that female farmers suffer
greater mental distress than male counterparts, and
marital status is associated with poorer mental health
(Daghagh et al., 2019). Houlden et al. (2019)
examined the linear relationship between the amount
of green space and mental health by developing a
univariate ordinary least squares (OLS) regression
model exploring relevant factors of mental health
indices. The GWR method computes a local
regression where the coefficients can vary spatially
(Brunsdon et al., 1996; 1998), hence could provide a
more nuanced understanding of how different factors
influence mental health (SMI) in local areas, such as
the work of Cruz et al. (2022) who constructed a
Bayesian spatial regression model incorporating
random effects applied to the log-transformed mean
SMI prevalence, to offer a precise comprehending of
the spatial pattern and determinants of mental health
problems, in recognising that high risk of SMI was
associated with unemployment, low income, low
education level, and living in a high-crime area.
Besides of the multifaceted nature of mental health
linking to socioeconomic status, environmental
factors such as greenery, air pollution, and climate
also have been examined (Mueller et al., 2023;
Houlden et al., 2019; Bakolis et al., 2021). The
findings highlight the huge impact that climate and
air quality have on the planet. In conclusion, these
studies reveal the complex impact of environmental
factors on obesity and mental health, highlighting the
importance of further research and consideration of
multiple variables.
3 DATA AND METHODOLOGY
3.1 Data
The datasets used in this study are derived from
multiple open sources and integrated into the
geographical boundaries for UK Census at Middle
Layer Super Output Area (MSOA) and Lower Layer
Super Output Area (LSOA) levels respectively. Data
fusions are realised through joining into the
boundaries’ shapefiles by the shared MSOA or LSOA
codes for following 4 datasets:
Firstly, measures for obesity and relevant socio-
economic factors mainly come from MedSat data,
under CC BY-SA 4.0 license and could be found at
TUMMedia (data sharing service from Technical
University Munich) (Šćepanović et al., 2023),
includes a wide array of variables (Figure 1) such as
population density, age, gender, ethnicity, religion,
marital status, employment, commute to work,
residence, self-reported health, language, and the
index of multiple deprivation (IMD), air quality,
greenery, climate, and land cover, as well as medical
prescriptions data encompasses conditions such as
diabetes, hypertension, asthma, depression, anxiety,
opioid prescriptions, and overall total prescriptions.
Figure 1: Structure of Medsat dataset (Access the dataset at:
https://github.com/sanja7s/MedSat).
The second dataset, Access to Healthy Assets and
Hazards (AHAH), is collected from the Consumer
Data Research Centre (CDRC), includes a variety of
variables measuring access to both healthy assets and
environmental hazards, such as the distance to the
nearest gambling outlet, fast food outlet, GP practice,
hospital, dentist, pharmacy, and leisure center, as well
as measures of air quality (nitrogen dioxide,
particulate matter) and green/blue space (NDVI value
for passive green space), which were collocated from
various national organizations such as ONS, NHS
England, NHS Scotland, LDC, DEFRA, and
OpenStreetMap (Figure 2).
The third dataset on adults and children obesity is
sourced from the NHS Digital's Quality and
Outcomes Framework (QOF), aggregated at the
MSOA level (GLA, 2023). This dataset combines
GP-level data with the 2019 population estimates
from the Office for National Statistics to estimate the
percentage and number of obese adults in each
MSOA. Similarly, the childhood obesity dataset
identifies MSOAs with the highest levels of
overweight children in reception and Year 6, which
are viewable as below interactively.
GISTAM 2025 - 11th International Conference on Geographical Information Systems Theory, Applications and Management
18
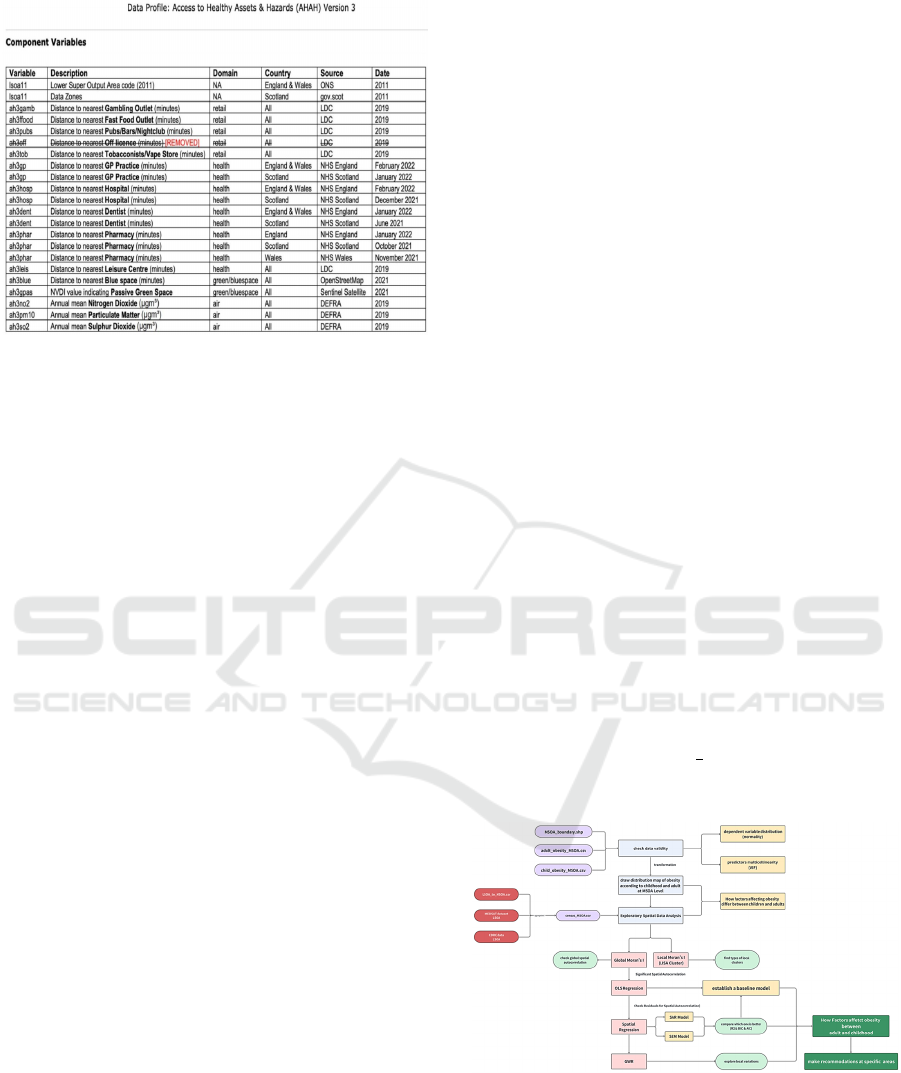
Figure 2: Detailed variables of CDRC dataset (Access the
dataset at: https://data.cdrc.ac.uk/dataset/access-healthy-
assets-hazards-ahah)
The data for mental health modelling is Small
Area Mental Health Index (SAMHI), which is a
composite annual indicator of population mental
health at LSOA level from 2011 to 2019 (Daras and
Barr, 2020). SAMHI combined multiple sources of
mental health data, such as NHS-Mental health
related hospital attendances, GP Patient Survey, and
Prescribing Data, where a positive SAMHI indicates
relatively severer mental health issues in the area,
whilst a negative SAMHI indicates for fewer
symptoms of residents’ mental health issues. On top
of it, 11 independent variables had been selected for
modelling, include household income, employment,
physical health, education, environment, air
pollution, green area, the percentage of the population
over 65 years old, the percentage of men, population
density, and the percentage of the population aged 16-
29, derived from the English indices of deprivation
(IMD) in 2015 and 2019 (ONS, 2024), and the total
population, population density at LSOA scale,
greenspace coverage, air pollution concentration data
from London Data Store.
3.2 Research Design and Methods
The research workflow design diagram is identical for
obesity and mental health, hence they are running in
parallel following the same workflow shown in
Figure 3, taking obesity as example for illustration.
Geographic boundary files and datasets upon merging
adult and childhood obesity rates were used to map
obesity patterns in London, followed by appropriate
exploratory spatial data analysis, spatial patterns
recognitions (i.e., Global Moran’s I and Local
Moran’s I clustering), and varied influential factors
investigation on obesity among adults and children,
with step-by-step methods adoptions included in the
lower half of Figure 3.3. The project employs spatial
regression models, including SAR and SEM models,
to identify the influential factors for whole city, but
uses localised model Geographically Weight
Regression (GWR) to find their varied influences
among London areas.
Anselin et al. (2006)’s Global Moran's I and Local
Moran’s I indices were firstly calculated to examine
the existence of spatial autocorrelations for health
data, as well as the potential spatial clusters and
outliners (Equation 1), so that to decide which
regression models will be the optimal for this study.
𝑦𝛽
+𝛽
𝑥
+𝛽
𝑥
+⋯+𝛽
𝑥
+𝑢 (1)
Traditional regression model Ordinary Least
Square (OLS) is going to be used for preliminary
regression, as one of the most classical types of
regression analysis (Yang et al., 2016), which
predicts the output variable as a linear combination of
the input variables; but with more recognition of the
existence of spatial autocorrelation, spatial regression
models are to be tested as well. For example, if taking
the mental health measure SAMHI as dependent
variable, then the model will be expressed as in
Equation 2.
SAMHI =𝛽
0
+𝛽
1
income score +𝛽
2
employment score +
𝛽
3
education score + 𝛽
4
health score +𝛽
5
environment score
+ 𝛽
6
concentration+ 𝛽
7
canopy tree + 𝛽
8
65aged + 𝛽
9
male
ratio + 𝛽
10
density + 𝛽
11
16 29ratio + u
(2)
Figure 3: Research Design flowchart for Obesity (or Mental
Health) Patterns in London
Spatial Lag Model (SLM) is deployed to account
for spatial dependencies by incorporating a spatial lag
of the dependent variable into the regression model,
embracing the influence of neighbouring areas on the
Are Londoners Getting Healthier?
19
outcome of interest, and be expressed in Equation (3):
𝑌= 𝜌𝑊𝑌+𝑋𝛽+𝜖 (3)
where Y is the dependent variable, ρ is the spatial
autoregressive parameter, W is the spatial weights
matrix, X represents the independent variables, β
denotes the coefficients, and ϵ is the error term. By
including 𝜌𝑊𝑌.
Spatial Error Model (SEM) addresses spatial
autocorrelation in the error terms rather than in the
dependent variable. This model is suitable when the
spatial dependence arises from unobserved factors
that affect the error term, and can be formulated as in
Equation (4):
𝑌 = 𝑋𝛽 + 𝜖,𝜖 = 𝜆𝑊𝜖 + 𝜂 (4)
where η is a normally distributed error term with
mean zero and 𝑊𝜖 represents the spatially lagged
error term. Here, λ is the parameter that measures the
degree of spatial autocorrelation in the errors. The
SEM helps to correct for biases that might be
introduced by spatial correlation in the error terms,
leading to more accurate estimates of the
relationships between the dependent variable and the
independent variables.
Geographically Weighted Regression (GWR) as
the last model, to capture local variations in the
relationships between variables, offering a more
detailed understanding of spatial dynamics. Unlike
traditional regression models, which assume a
uniform relationship across all locations, GWR
calculates different regression coefficients for each
area, addressing spatial differences in the data.
The formula of the GWR model is displayed in
Equation 5:
𝑦
𝑖
= 𝛽
0
(𝑢
𝑖
,𝑣
𝑖
) + 𝛽
1
(𝑢
𝑖
,𝑣
𝑖
) 𝑥
1𝑖
+ 𝛽
2
(𝑢
𝑖
,𝑣
𝑖
) 𝑥
2𝑖
+ + ···
𝛽
𝑘
(𝑢
𝑖
,𝑣
𝑖
) 𝑥
𝑘𝑖
+ 𝜖
𝑖
(5)
It detects spatial changes in relationships in the
model and can reveal local features and trends in
spatial data and handle spatial autocorrelation in data.
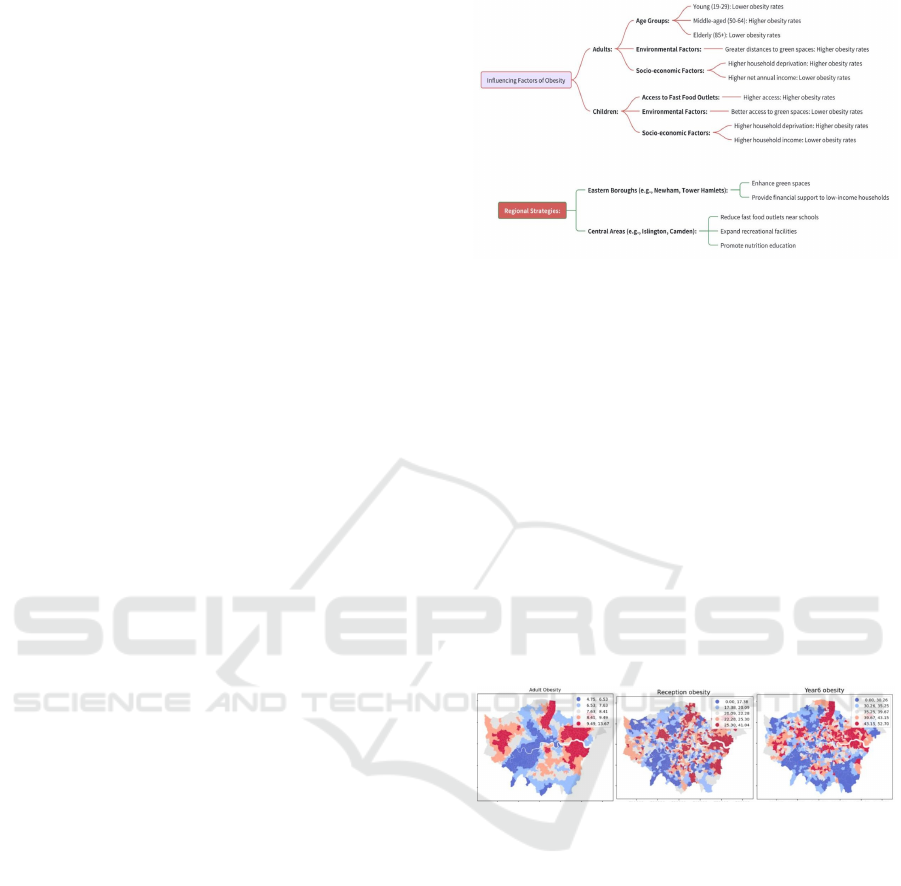
Drill into the research design and methods for
influential factor investigations, hierarchy of the
selected factors are reflected in Figure 4, and similar
for mental health measure (to replace the dependent
variable from measure for obesity to measure for
mental health), informed by empirical studies in
Section 2.
Figure 4: Variables for Modelling Obesity Patterns in
London (similarly for Mental Health).
4 RESULTS
4.1 Spatial Patterns of Londoners
Health
4.1.1 Physical Health – Obesity
Londoners’ obesity patterns vary by age group in that,
as reflected in Figure 5 on obesity rates among
London regions, the redder in the map the higher
values and vice versa. From left to right, maps are
obesity patters for adults, children in Reception (ages
4-5), and children in Year 6 (ages 10-11) respectively.
Figure 5: Londoners’ Obesity Patterns by Group (Adult,
Reception and Year 6).
It is apparent that, areas in the outer East (coloured
in dark red) have higher obesity rates such as
boroughs Barking and Dagenham and Havering.
Besides, there were more adults with obesity in the
western borough Hillingdon as well; whilst obesity
rates among younger children in reception (aged 4-5
years old) were more dispersedly distributed, with
areas in central London, such as Newham and Tower
Hamlets, and outer areas such as Brent in the North;
obesity among bigger children in Year 6 (ages 10-11)
were also high in areas such as Barking and
Dagenham, Tower Hamlets, and Hackney, but with
wider distribution than the younger counterpart.
To identify the potential spatial autocorrelation,
Global Moran’s I had been calculated for each of the
three age groups’ obesity rates, in return with
GISTAM 2025 - 11th International Conference on Geographical Information Systems Theory, Applications and Management
20
significant values as adult obesity at 0.6112, younger
children at 0.2093 and older children at 0.2689. It is
obvious that adults with obesity in London tend to
cluster more in certain outskirt areas, whilst children
with relatively much less pronounced clustering
spatial pattern, but mostly in Northeast London. It
implies that obesity issues among London adults may
be more influenced by the neighbouring areas and
local environment, hence leading to the localised
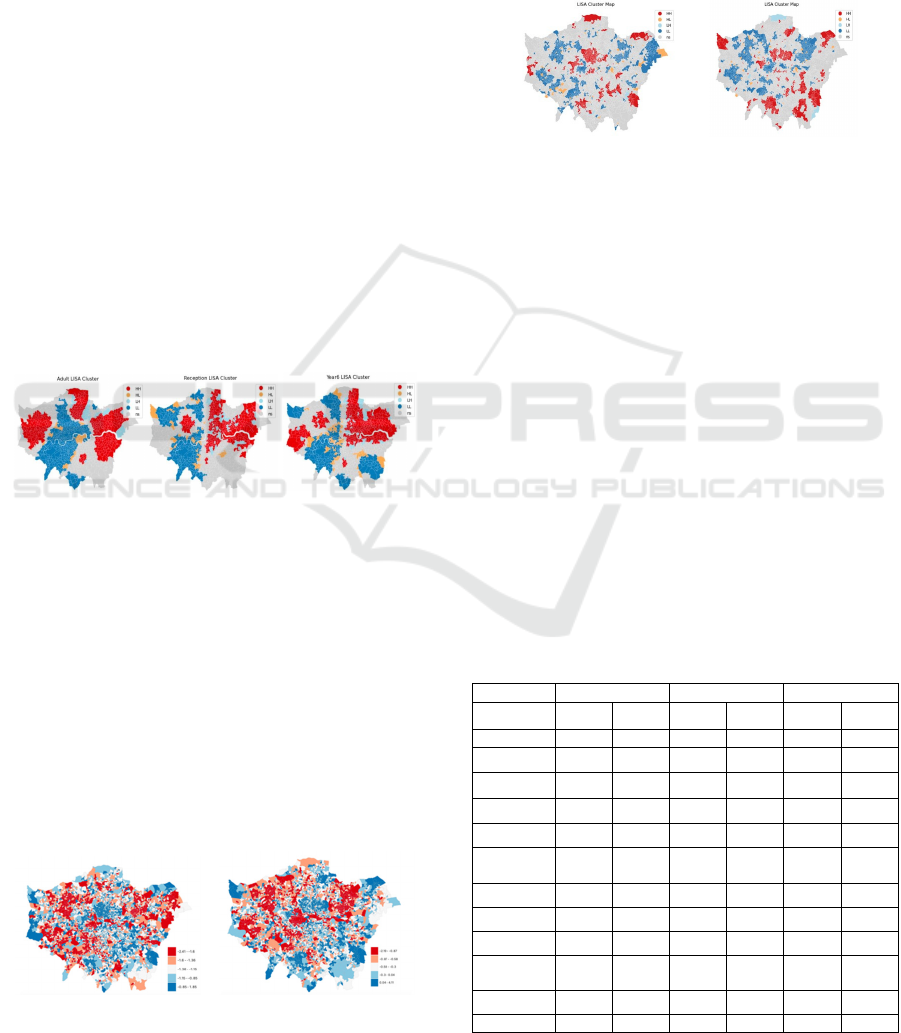
spatial analysis visualised by LISA maps (Figure 6).
In LISA maps, areas in red are HH clusters with high
obesity rates and surrounded by similar neighbouring
areas and predominantly located in the northeast parts
of London regardless of age groups with consistently
high obesity rates. On the contrary, areas in blue
indicates LL clusters areas with low obesity rates
surrounded by low obesity neighbours, indicating
central and southwestern regions tend to be healthier
physically. Meanwhile, areas with high obesity rates
but neighboured by low obesity areas are colored in
orange, whilst light blue areas are the opposite.
Adults and bigger children also experience higher
obesity in some western boroughs, whilst younger
children have higher obesity in central-west London
for limited area.
Figure 6: LISA clusters among adult, reception and year 6
(left to right).
4.1.2 Mental Health
Londoners’ mental health indices distribution had
been presented in Figure 7 for 2011 to 2019
respectively for comparison, but received similar
spatial patterns. Redder areas with lower index values
indicated better performance regarding residents’
mental health, comparatively the bluer areas with
positive mental health index values are those with
worst performance of residents’ mental health. From
2011 to 2019, residents’ mental health has improved
significantly with expanded redder areas.
Figure 7 Mental Health Indices Patterns (left: 2011; right:
2019).
Upon calculating the global Moran’s I measure, it
was found that mental health index has significant
spatial clustering patterns with a Moran’s I value at
0.4875 in 2011 and 0.5341 in 2019. Localised LISA
cluster mappings (Figure 8) further highlighted the
clustering patterns with high-high (HH) areas
indicating for those with worse mental health
performance, and low-low (LL) areas with better
mental health performance.
Figure 8 Mental Health Indices LISA maps (left: 2011;
right: 2019).
Boroughs such as Islington, Camden and Hackney kept
poorer mental health over time, while boroughs such
as Enfield, Sutton and Lewisham improved in 2019
and no longer being hot spot clusters. On the other
hand, boroughs such as Brent, Hounslow, Redbridge,
Newham, Harrow and Wandsworth were better
performed over time, but Havering became getting
worse in 2019 from its good performance in 2011.
4.2 Influential Factors from Regression
Modelling
4.2.1 Influential Factors for Physical Health
To better investigate the contributing factors for
London residents’ obesity, OLS, SLM and SEM
regressions had been conducted with results
summarised in Table 1.
Table 1: Regression Results for Obesity Modelling.
Variables OLS SLM SEM
Adult
Bigger
Children
Adult
Bigger
Children
Adult
Bigger
Children
Intercept 14.7687 33.5218 2.2114 958.0314 ----- 1817.1489
Percent of
Age 19~29
-0.0005 -0.0002 -0.0002
Percent of
Age 40~49
--- ---- -----
Percent of
Age 50~64
0.001 0.0007 0.0006
Percent of
Age 85+
-0.0058 -0.0043 -0.0038
Distance to
nearest Fast
food outle
t
---- -47.1416 ----- 38.4173 -0.0742 ----
Distance to nearest
Green Space
---- -1316.4992 0.8584 -656.2771 ---- -879.9875
Net Annual
Income
-0.0002 -0.0237 -0.0001 -0.0171 -0.0001 -0.0159
Percentage of
unemploymen
t
-3.3465 ---- ----- ----- ----- 953.2364
Percentage of
household
deprivatio
n
------ 47910 41.7626 40950.0536 40.5875 43658.535
Neighbourhood
spillove
r
0.9857
R-square 0.3346 0.3645 0.7662 0.5038 0.2356 0.3546
Are Londoners Getting Healthier?
21

Comparing the 3 selected models, it is apparent
that SLM is outperformed with R-square at 0.7662 for
adults and 0.5038 for bigger children, indicating for
the inclusion of neighbouring areas’ influences
(0.9857), especially for adults’ obesity pattern.
Income level exerted significant mediating effects
onto obesity issue, regardless of age groups, but the
influences were stronger to children than to adults.
Percentage of residents at 40-49 years old is not
related to regional adults’ obesity level, but other age
groups will be significantly related, especially the age
group 50-59 years old, will drive mental health index
higher. For children, community and family
environment, such as the distance to the nearest fast-
food outlet, the distance to the nearest green space,
and the percentage of household deprivation had
substantial effects on obesity rates, indicating that
more convenient fast-food accessibility and more
deprived families will drive children’s obesity rate
higher, while greenspace accessibility can mediate
such obesity through easier exercise and outdoor
activities.
4.2.2 Influential Factors for Mental Health
Similarly, London residents’ mental health index and
selected independent variables are modelled by OLS,
SLM and SEM regressions for data in 2011 and in
2019 comparatively, with results summarised in
Table 2.
Table 2: Regression Results for Mental Health Modelling.
OLS SLM SEM
2011 2019 2011 2019 2011 2019
R Square
d
0.5983 0.5499 0.7238 0.7443 0.5390 0.5045
Income Score -0.5020 -0.4295 -0.3528 -0.2147 -0.2098 -0.0605
Employment
Score
0.8584 0.8837 0.6874 0.6272 0.5968 0.5301
Education Score -0.1516 -0.1191 -0.1407 -0.1246 -0.0539 -0.0510
Health Score 0.5239 0.4034 0.3919 0.2683 0.5391 0.3746
Environment
Score
0.0989 ----- 0.0501 -0.0306 0.0478 0.0115
Air Pollution
Score
0.1139 ----- 0.0675 0.0396 ------ ------
Canopry Tree 0.0407 0.0302 ----- ------ ------ -------
65age
d
0.2513 0.2931 0.2124 0.2356 0.1467 0.2326
Male Ratio -0.1106 -0.1173 -0.0527 -0.0358 ----- --------
Densit
y
----- ---- -0.0330 ----- ----- -0.0333
16-29ratio -0.0607 0.0114 -0.0546 ----- -0.050 -0.0400
Spatial Weight ----- ---- 0.5020 0.5924 0.7978 0.8145
It is obvious that SLM model still have the highest
R squared value for both 2011 and 2019 data, hence
should be the optimal model to be selected.
Residents’ mental health was mostly driven by their
deprivations of employment and health, but can be
mediated if be with a lower deprivation of income.
Similarly, deprivation on education and the
percentage of male residents could also help to
alleviate local mental health issues. However, the
neighbouring areas’ mental health level is influential
more and more greatly over time, as well as the
percentage of aged populations (over 65). It also
called our attention that at global scale, greenery
didn’t play significant influence onto Londoners’
mental health, but air pollution concentrations are.
4.2.3 Localised Influences - GWR Model
To better understand the varied influences and model
fitting among London boroughs, Geographically
Weighted Regression (GWR) model had been applied
to map out the factors’ explanation ability for obesity
and mental health measures. GWR allows for the
examination of local variations in predictors, in
Figure 9 it provides a deeper understanding of factors
influencing obesity among London regions, by
visualizing how well the model explains obesity rates
across the study area.
Figure 9: Local R-Squared map of GWR model among
adults and children.
The local R-squared values for adults (left in
Figure 9) are higher in East London especially the
southeast such as Bromley, suggesting that the model
explains obesity rates better in these regions. In
contrast, the western areas show lower R-squared
values, indicating that the model’s explanatory power
is weaker. For children (right in Figure 4.5), the local
R-squared values are higher in the South and some
northern areas, implying that the model performs
better in explaining childhood obesity rates in these
regions, but is weaker in explaining young people’s
obesity in central, and central east London areas.
It can also exhibit the varied influences onto
dependant variable among London regions for each
identified factor. For example, in Figure 10 presented
the deprivation of income in London exerted varied
influences onto mental health levels in 2011 and
2019, where outskirt areas were more driven by such
economic inequality; on the other hand, it tends to
cluster towards certain areas such as in Bromley over
time.
Another factor, deprivation on employment has
been investigated as well (Figure 11) in finding its
expanded influences in the South and West London
from 2011 to 2019, where central London and South
London such as Croydon were always the most-hit
areas for employment inequality driven mental health
issues.
GISTAM 2025 - 11th International Conference on Geographical Information Systems Theory, Applications and Management
22

Figure 10: Local Influences on Mental Health from
Deprivation of Income (left: 2011; right: 2019).
Figure 11: Local Influences on Mental Health from
Deprivation of Employment (left: 2011; right: 2019).
In all, each factor can be mapped across London
areas on their varied influences onto local mental
health levels, either be driving forces or mediating
effects. From a global perspective, greenery is not
significantly influencing mental health, but it became
influential locally in certain boroughs such as
Hounslow. Income, education, employment,
physical health, environment, greening, air pollution
concentration, population density, and the percentage
of young and elderly populations are important
factors affecting mental health. These findings are
conducive to designing localised intervention
measures according to the featured circumstances of
varied boroughs.
5 CONCLUSIONS
Obesity is a significant public physical health issue,
leading to health risks, including developing chronic
conditions such as heart disease, type 2 diabetes, and
certain types of cancer. To understand and mitigate its
potential impacts on Londoners’ health could be
meaningful to the society’s development. The
findings highlighted significant factors influencing
obesity, differing between adults and children,
underscoring the need for targeted, location-specific
public health interventions. Specifically, for adults,
age group compositions, green space access,
household deprivation, and income were significant;
while for children, access to fast food outlets, green
space, household deprivation, and income levels were
critical. Recommendations included promoting
weight management programs at local community,
improving green space access, and addressing socio-
economic disparities. The GWR model highlights the
significance of contextual and geographical factors in
obesity. By focusing on local variations, more
effective policies can be developed. For instance, in
eastern boroughs like Newham and Tower Hamlets,
strategies could include enhancing green spaces and
providing financial support to low-income
households. In central areas such as Islington and
Camden, where childhood obesity is a major concern,
interventions might include reducing fast food outlets
near schools, expanding recreational facilities, and
promoting nutrition education. Tailoring these
strategies to regional needs can significantly improve
public health outcomes and address obesity more
effectively.
Mental health issue is not a sole challenge in
London, instead serious mental illness (SMI) affected
millions of people all over the world (James et al.,
2018). In England, nearly three million adults were
listed on local GP registers with depression in 2013-
2014, and around half a million were diagnosed with
a serious mental illness (SMI), which refers to people
with schizophrenia, bipolar disorder or other
psychotic illnesses (Grigoroglou et al., 2020). In
London it is especially crucial to understand the
mental health status over areas and time. The spatial
patterns of London’s mental health indices from 2011
to 2019 were largely consistent but varied at finer
granularity for local distribution. Comparatively, the
overall mental health indices in 2019 have improved
significantly. Some boroughs, such as Islington,
Camden and Hackey, kept poorer mental health
performance from 2011 to 2019, whilst some other
borough (Enfield, Sutton and Lewisham) exhibited
great improvement over the time. On the contrary,
outskirt boroughs such as Brent, Hounslow,
Redbridge, Newham, Harrow and Wandsworth
maintained good mental health performance over this
period, but with exceptional deterioration in Havering
from 2011 to 2019.
The spatial lag models (SLM) were found to be
optimal in capturing maximum information hence
explaining the dependant variables. The regional
deprivations on income, employment, education,
physical health, environment, air pollution, the
proportion of the young and elderly population,
population density, and the proportion of males
significantly impacted mental health regardless of the
year. Geographically, Hounslow, Redbridge and
Harrow are boroughs consistently with good mental
health, where Hounslow benefits from good
employment equality, Redbridge and Harrow both
benefit from better environmental equity, as well as
better education in the latter. However, Havering
Deprivation on Income (2011)
Deprivation on Income (2019)
Deprivation on Employment (2011)
Deprivation on Employment (2019)
Are Londoners Getting Healthier?
23

stood out as an example for mental health
deterioration due to severe income deprivation and air
pollution pressures. Environmental factor greenery
didn’t exert a significant impact on London’s mental
health, but significantly affected mental health locally
in specific boroughs. For example, Havering’s mental
health deteriorated significantly from 2011 to 2019
when driven by widened income gaps, high level of
air pollution and less access to greeneries.
Mental health is affected by a mixture of multiple
socioeconomic and environmental factors, future
trajectory studies could be suggested to investigate
the long-term impacts. Qualitative research can also
be recommended to complement the findings
interpretation from residents’ point of view by
interviews. The impact of each variable on mental
health varies significantly across regions and years,
reflecting the spatial heterogeneity of different
regions. For example, Greening can mediate the
mental health in Hounslow, but deprivation of
employment could drive mental health level up. On
the other hand, some factors only were influential in
the area for certain time, such as deprivation on
income and education were only negatively related
with mental health in 2011, but no longer being
significantly influential in 2019. Such variations
might be the results from local policy interventions
hence being worthwhile to get evaluated.
The project successfully addresses several
limitations from empirical studies in that, it fills the
gaps by simultaneously analyzing both adults and
childhood obesity, offering a more comprehensive
understanding of obesity across different age groups;
compared the trajectory changes of mental health
spatial patterns from 2011 to 2019 over both space
and time, and highlights the necessity of region-
specific policies through various spatial regression
methods, demonstrating the importance of
considering local context in public health
interventions for both physical and mental health.
Future research could benefit from integrating socio
economic and environmental factors influencing
obesity and mental health, such as air quality, dietary
habits, and physical activity levels. Expanding the
study to include longitudinal data or qualitative
research data could provide insights into causal
relationships. Incorporating a spatial-temporal
analysis would allow for examining how childhood
obesity transitions into adult obesity, mental health
had been influenced by neighbouring areas, and
revealing long-term trends and patterns. This
approach would involve tracking cohorts of
individuals over time to observe how health related
challenges develop. By linking multi-sourced data,
researchers can identify critical periods and factors
that influence the health trajectories, providing a
deeper understanding of how society conditions
affect long-term health outcomes for citizens.
REFERENCES
Anselin, L., Syabri, I. and Kho, Y. 2006. GeoDa: An
introduction to spatial data analysis. Geographical
Analysis 38(1): 5-22. doi: https://doi.org/10.1111/j.00
16-7363.2005.00671.x.
Bakolis, I., Hammoud, R., Stewart, R., Beevers, S., Dajnak,
D., MacCrimmon, S., Broadbent, M., Pritchard, M.,
Shiode, N. and D. Fecht. 2021. Mental health
consequences of urban air pollution: prospective
population-based longitudinal survey. Social psychiatry
and psychiatric epidemiology 56: 1587–1599.
Brunsdon, C., Fotheringham, S. and Charlton M. E. 1996.
Geographically weighted regression: a method for
exploring spatial nonstationarity. Geographical
analysis 28(4): 281–298.
Brunsdon, C., Fotheringham, S. and Charlton, M. 1998.
Geographically weighted regression. Journal of the
Royal Statistical Society: Series D (The Statistician)
47(3): 431–443.
Bultena, G., Lasley, P. and Geller, J. 1986. The farm crisis:
Patterns and impacts of financial distress among iowa
farm families. Rural Sociology 51(4): 436.
Cetateanu, A. and Jones, A. 2014. Understanding the
relationship between food environments, deprivation
and childhood overweight and obesity: Evidence from
a cross-sectional England-wide study. Health & Place
27: 68-76. https://doi.org/10.1016/j.healthplace.2014.0
1.007.
Cruz, J., Li, G., Aragon, M. J., Coventry, P. A., Jacobs, R.,
Prady, S. L. and White, P. C. 2022. Association of
environmental and socioeconomic indicators with
serious mental illness diagnoses identified from general
practitioner practice data in England: A spatial
Bayesian modelling study. PLoS medicine 19(6):
e1004043.
Daghagh Yazd, S., Wheeler, S. A. and Zuo, A. 2019. Key
risk factors affecting farmers’ mental health: A
systematic review. International journal of
environmental research and public health 16(23): 4849.
Daras, K. and Barr, B. 2020. Small Area Mental Health
Index (SAMHI). Data Catalogue DOI: 10.17638/data
cat.liverpool.ac.uk/1188.
Department of Health and Social Care. 2011. Healthy
Lives, Healthy People: A call to action on obesity in
England. https://www.gov.uk/government/publicati
ons/healthy-lives-healthy-people-a-call-to-action-on-
obesity-in-england.
ESRI. 2021. UK COVID-19 Cases and Mortality Rates.
BMJ Nutrition, Prevention & Health.
https://nutrition.bmj.com/.https://www.arcgis.com/ho
me/item.html?id=206b01a5a13541ef9fd067cfcaf3cdb
GISTAM 2025 - 11th International Conference on Geographical Information Systems Theory, Applications and Management
24

7&view=list&sortOrder=desc&sortField=defaultFSOr
der#overview. [Accessed: Jun. 3, 2024].
Gaber, M., Benlamkaddem, M., Jayyousi, R., Kurdi, L. and
Yassin, S. M. 2024. Effects of the COVID-19
Pandemic on Physical Activity among the Population
of Qatar. International Journal of Environmental
Research and Public Health 19(19): 12572. Available:
https://www.mdpi.com/1660-4601/19/19/12572.
[Accessed: Jun. 3, 2024].
Gianfredi, V. et al. 2021. Association between Urban
Greenspace and Health: A Systematic Review of
Literature. International Journal of Environmental
Research and Public Health 18(10). doi:
10.3390/ijerph18105137.
Greater London Authority (GLA). 2020. Diversity in
London. Available: https://www.london.gov.uk.
Greater London Authority (GLA). 2023. Super Output Area
Population (LSOA, MSOA) London. Available:
https://data.london.gov.uk/dataset/super-output-area-
populationlsoa-msoa-london.
Headey, B., Kelley, J. and Wearing, A. 1993. Dimensions
of mental health: Life satisfaction, positive affect,
anxiety and depression. Social indicators research 29:
63–82.
Grigoroglou, C., Munford, L., Webb, R. T., Kapur, N.,
Ashcroft, D. M. and Kontopantelis, E. 2020. Prevalence
of mental illness in primary care and its association with
deprivation and social fragmentation at the small-area
level in England. Psychological Medicine 50(2): 293–
302.
Heather, O., Julie, V., Jennifer, D. and Gayatri, J. 2017.
Measuring positive mental health in Canada: construct
validation of the mental health continuum—short form.
Health promotion and chronic disease prevention in
Canada: research, policy and practice 37(4): 123.
Henderson L. and Knight, T. 2012. Integrating the hedonic
and eudaimonic perspectives to more comprehensively
understand wellbeing and pathways to wellbeing.
Higgins, V. 2022. Ethnic density and area-deprivation
effects on central obesity among ethnic minority
people in England—A cross-sectional, multi-level
analysis. Frontiers in Epidemiology [Online].
https://www.frontiersin.org/articles/10.3389/fepid.202
2.1000155 [Accessed: May. 22, 2024].
Houlden, V., de Albuquerque, J. P., Weich, S. and Jarvis,
S. 2019. A spatial analysis of proximate greenspace and
mental wellbeing in London. Applied Geography 109:
102036.
James, S. L., Abate, D., Abate, K. H., Abay, S. M.,
Abbafati, C., Abbasi, N., Abbastabar, H., Abd-Allah,
F., Abdela, J. and Abdelalim, A. 2018. Global, regional,
and national incidence, prevalence, and years lived with
disability for 354 diseases and injuries for 195 countries
and territories, 1990–2017: a systematic analysis for the
global burden of disease study 2017. The Lancet
392(10159):1789 - 1858.
Keyes, C. L. 2002. The mental health continuum: From
languishing to flourishing in life. Journal of health and
social behavior: 207–222.
Kral, T.V.E. and Rauh, E.M. 2010. Eating behaviors of
children in the context of their family environment.
Physiology & Behavior 100 (5): 567-573.
https://doi.org/10.1016/j.physbeh.2010.04.031
Lachowycz, K. and Jones, A. P. 2013. Towards a better
understanding of the relationship between greenspace
and health: Development of a theoretical framework.
Landscape and Urban Planning 118: 62–69. doi:
10.1016/j.landurbplan.2012.10.012.
Mayor of London. 2018. The London Food Strategy.
Available: https://www.london.gov.uk [Accessed:
Apr. 15, 2024].
McLaren, L., Beck, C. A., Patten, S. B., Fick, G. H. and
Adair, C. E. 2008. The relationship between body mass
index and mental health: A population-based study of
the effects of the definition of mental health. Social
psychiatry and psychiatric epidemiology 43: 63–71.
Mueller, M. A. E., Midouhas, E. and Flouri, E. 2023. Types
of greenspace and adolescent mental health and well-
being in metropolitan London. Cities & Health, 7(3),
378–397. https://doi.org/10.1080/23748834.2023.217
5410.
NHS England. 2019. Health Survey for England 2018
[Online]. Available: https://digital.nhs.uk/data-and-
information/publications/statistical/health-survey-
forengland/2018 [Accessed: May. 22, 2024].
NHS England. 2020. Type 1 and type 2 diabetes and
COVID-19 related mortality in England. Available:
https://www.england.nhs.uk/publication/type-1-
andtype-2-diabetes-and-covid-19-related-mortality-in-
england/ [Accessed: Mar. 3,, 2024].
NHS England. 2023. National Child Measurement
Programme, England, 2022/23 School Year.
[Online].Available: https://digital.nhs.uk/data-and-
information/publications/statistical/national-child-
measurement-programme/2022-23-schoolyear.
NHS England. 2024. National Child Measurement
Programme." https://digital.nhs.uk/data-and-informati
on/publications/statistical/national-childmeasurement-
programme.
Office for National Statistics (ONS). 2019. Regional gross
disposable household income, UK: 1997 to 2018.
[Online]. Available: https://www.ons.gov.uk
[Accessed: Aug. 4, 2024].
ONS. 2024. Lower super output area population density.
https://www.ons.gov.uk/populationandmigration/popul
ationestimates/datasets/lowersuperoutputareapopulatio
ndensity.
Public Health England (PHE). 2020. Health Matters:
Obesity and the food environment. Available:
https://www.gov.uk/government/publications/health-
matters-obesity-andthe-food-environment
Rosenberg, M. 2019. Population Density Information and
Statistics. Available: https://www.thoughtco.com/popu
lation-density-overview-1435467 [Accessed: May. 13,
2024].
Ryan, R. M. and Deci, E. L. 2001. On happiness and human
potentials: A review of research on hedonic and
eudaimonic well-being. Annual review of psychology
52(1): 141–166.
Are Londoners Getting Healthier?
25

Šćepanović, S., Obadic, I., Joglekar, S., Giustarini, L.,
Nattero, C., Quercia, D., Zhu, X. 2023. MedSat: A
Public Health Dataset for England Featuring Medical
Prescriptions and Satellite Imagery. TUMMedia (data
sharing service from Technical University Munich),
under CC BY-SA 4.0 license. https://doi.org/10.14
459/2023mp1714817.
Schratz, L.M., Larkin, O., Dos Santos N. 2023. Caregiver
Influences on Eating Behaviors in Children: An
Opportunity for Preventing Obesity. Curr Atheroscler
Rep 25: 1035-1045. https://doi.org/10.1007/s11883-
023-01171-6.
Shenassa, E. D., Liebhaber, A. and Ezeamama, A. 2006.
Perceived Safety of Area of Residence and Exercise: A
Pan-European Study. American Journal of
Epidemiology 163 (11): 1012-1017 https://doi.org/
10.1093/aje/kwj142.
Stafford, M., Brunner, E. J., Head, J. and Ross, N. A. 2010.
Deprivation and the Development of Obesity: A
Multilevel, Longitudinal Study in England. American
Journal of Preventive Medicine 39 (2):130-139.
https://doi.org/10.1016/j.amepre.2010.03.021.
Stamatakis, E., Wardle, J. and Cole, T. 2010. Childhood
obesity and overweight prevalence trends in England:
Evidence for growing socioeconomic disparities.
International Journal of Obesity 34(1): 41-47.
https://doi.org/10.1038/ijo.2009.217.
Story, M., Nanney, M. S. and Schwartz, M. B. 2009.
Schools and Obesity Prevention: Creating School
Environments and Policies to Promote Healthy Eating
and Physical Activity. The Milbank Quarterly 87: 71-
100. https://doi.org/10.1111/j.14680009.2009.00548.x.
Sun, X., Hu, Y., Huang and T. O. Chan. 2020. Spatial
Patterns of Childhood Obesity Prevalence in Relation
to Socioeconomic Factors across England. ISPRS
International Journal of Geo-Information 9 (10): 599.
doi: https://doi.org/10.3390/ijgi9100599.
Van Lippevelde W. et al., 2012. Associations between
family-related factors, breakfast consumption and BMI
among 10- to 12-year-old European children: the cross-
sectional ENERGY-study. PLoS One 7(11): e49534.
Veitch J. et al., 2011. Children's perceptions of the use of
public open spaces for active free-play. Children's
Geographies 9(4): 421-435.
World Health Organization (WHO). 2024. Obesity.
https://www.who.int/healthtopics/obesity#tab=tab_1
Yang, J., Zheng, Y., Gou, X. et al. 2020. Prevalence of
comorbidities and its effects in patients infected with
SARS-CoV-2: A systematic review and meta-analysis.
International Journal of Infectious Diseases 94: 91-95.
Yang, J. K., Feng, Y., Yuan, M.Y. et al. 2006. Plasma
glucose levels and diabetes are independent predictors
for mortality and morbidity in patients with SARS.
Diabetic Medicine 23(6): 623-628.
Zhu, L., She, Z. G., Cheng, X. et al. 2020. Association of
blood glucose control and outcomes in patients with
COVID-19 and pre-existing type 2 diabetes. Cell
Metabolism 3(6):1068-1077.
GISTAM 2025 - 11th International Conference on Geographical Information Systems Theory, Applications and Management
26
