
Analyzing Model Behavior for Driver Emotion Recognition and
Drowsiness Detection Using Explainable Artificial Intelligence
Diego Caballero Garc
´
ıa-Alcaide
a
, M. Paz Sesmero
b
, Jos
´
e A. Iglesias
c
and Araceli Sanchis
d
Computer Science Department, University Carlos III of Madrid, Av. de la Universidad 30, 28911 Legan
´
es, Madrid, Spain
Keywords:
Deep Learning, Drowsiness Detection, Emotion Recognition, ADAS, Explainable Artificial Intelligence.
Abstract:
Traffic accidents, predominantly caused by human error, pose a significant public health threat globally. De-
spite technological advancements and regulatory measures, the decline in traffic-related fatalities has stag-
nated. This research addresses the critical need for advanced driver monitoring systems that can accurately
detect fatigue and emotional states to mitigate risky driving behaviors. The core of this study lies in devel-
oping and evaluating deep learning models, specifically convolutional neural networks (CNN), augmented
with explainable artificial intelligence (XAI), for the dual purpose of emotion recognition and drowsiness de-
tection in drivers. By leveraging XAI, we delve into the decision-making processes of our models, offering
unprecedented transparency and interpretability in their predictions. Our findings illuminate the intricate inter-
play between facial expressions and emotional states versus the subtle cues indicative of drowsiness, creating
opportunities for more nuanced and effective driver monitoring systems. This work underscores the transfor-
mative potential of XAI in fostering trust, refining model behavior, and propelling forward the development
of advanced driver assistance systems (ADAS) aimed at enhancing roadway safety and reducing accidents.
1 INTRODUCTION
Traffic accidents remain a significant global pub-
lic health challenge, accounting for approximately
1.19 million fatalities annually, particularly affecting
young adults and children. Despite various initiatives
designed to enhance road safety, including advance-
ments in vehicle technology and stricter regulations,
the decline in traffic-related deaths has slowed over
the last decade. This trend is particularly evident in
Europe, where the number of fatalities dropped sig-
nificantly up to 2014 but has since plateaued, with
only temporary reductions during the COVID-19 pan-
demic years. One of the critical factors contributing to
traffic accidents is human error, responsible for most
incidents. Key behaviors such as speeding, impaired
driving due to alcohol or drug use, driver fatigue, and
distractions are frequently cited as primary causes.
Emotional states, such as anger, sadness, or fear, can
also impair judgment and reaction times, leading to
riskier driving behaviors.
a
https://orcid.org/0009-0005-4451-9642
b
https://orcid.org/0000-0001-9473-6809
c
https://orcid.org/0000-0003-0447-5444
d
https://orcid.org/0000-0002-1429-4092
The motivation for this research arises from the
ongoing challenge of developing Advanced Driver
Assistance Systems (ADAS) that can accurately and
reliably detect both fatigue and emotional states in
driver monitoring, aiming to reduce risky behaviors
before accidents occur. Especially, drowsiness detec-
tion using real-time data remains a challenging and
open problem due to the complex and often subtle
visual cues involved. Although recent advancements
in deep learning have enabled the development of in-
creasingly sophisticated models, their inherent opac-
ity often limits our understanding of the predictions
produced. To address this, we incorporate Explain-
able Artificial Intelligence (XAI) as a pivotal tool to
facilitate model debugging and provide transparency
into why specific predictions are made. Therefore,
this work combines the safety objectives of ADAS
with a methodological focus on explainability, posi-
tioning XAI as an essential component for validating
and refining detection models. Our contributions in
this paper are as follows:
• Designing and training multiple convolutional
neural networks (CNN) and evaluating their per-
formance to identify the optimal models for emo-
tion recognition and drowsiness detection.
334
Caballero García-Alcaide, D., Sesmero, M. P., Iglesias, J. A. and Sanchis, A.
Analyzing Model Behavior for Driver Emotion Recognition and Drowsiness Detection Using Explainable Artificial Intelligence.
DOI: 10.5220/0013204400003941
In Proceedings of the 11th International Conference on Vehicle Technology and Intelligent Transport Systems (VEHITS 2025), pages 334-341
ISBN: 978-989-758-745-0; ISSN: 2184-495X
Copyright © 2025 by Paper published under CC license (CC BY-NC-ND 4.0)

• Conducting a comprehensive XAI analysis to ex-
plore the decision-making processes involved in
the predictions of the best model for each task.
• Deeper understanding of the complex factors af-
fecting driver drowsiness and emotional states,
thus supporting the development of better and
more reliable driver monitoring technologies.
The remainder of this paper is structured as fol-
lows: Section 2 provides a review of related works on
the use of artificial intelligence in detecting emotions
and drowsiness, as well as explainable AI. Section 3
details the experimentation methodology. In Section
4 we present the experimental results obtained. Sec-
tion 5 examines the application of XAI to the best ob-
tained models. We then compare the performance and
challenges of the two systems in Section 6. Finally,
we draw our conclusion and outline potential direc-
tions for future research in Section 7.
2 RELATED WORK
It is well known that emotions significantly impact
driving performance, particularly negative emotions
such as anger or sadness, as demonstrated in several
studies as (Jeon, 2016) and (Jeon et al., 2011). Nu-
merous approaches to emotion recognition exist, as
highlighted in the survey by (Zepf et al., 2020). How-
ever, many of these methods, such as those relying
on electroencephalography (EEG) signals like the one
from (Sheykhivand et al., 2020), are intrusive and im-
practical for real-world driving scenarios. One of the
goals of our work is to develop a non-intrusive emo-
tion detection system. To achieve this, we employ
a deep learning framework, following the approach
adopted in studies like (Verma and Choudhary, 2018),
using CNN trained with facial expression images.
Regarding drowsiness detection, (Tamanani et al.,
2021) implements a model for estimating driver’s vig-
ilance status using deep learning and images extracted
from the UTA-RLDD dataset (Ghoddoosian et al.,
2019), which consists of videos of multiple subjects
exhibiting varying levels of drowsiness. This study
reports an accuracy of 91.8%. However, this is due to
the fact that they do not split the data by subjects dur-
ing training and evaluation. Not partitioning by sub-
jects for evaluation leads to misleading results, as the
model will fail to generalize well to unseen subjects.
Another study on drowsiness detection is (Mag
´
an
et al., 2022). This work proposed deep learning tech-
niques for ADAS integration, emphasizing the reduc-
tion of false positives to improve the system’s usabil-
ity and reliability. Two approaches were explored:
the first combined recurrent and convolutional neural
networks, while the second employed deep learning
to extract image features, which were subsequently
processed by a fuzzy logic-based system. While both
approaches achieved approximately 60% accuracy on
test data, the fuzzy logic method excelled in reducing
false positives, reaching a specificity of 93%. How-
ever, the overall accuracy leaves room for improve-
ment, suggesting that the system may still struggle
with correctly identifying drowsy instances.
Lastly, in the realm of explainable AI, (Lorente
et al., 2021) applied XAI techniques to different mod-
els: one for emotion detection and another one for de-
tecting actions or distractions during driving. The ex-
plainability layer was integrated using XRAI, which
visually highlights the most important regions in im-
age predictions. XAI provided insights that could not
be derived from traditional performance metrics like
accuracy alone. For instance, it was revealed that the
emotion detection model performed worse on images
taken from lateral angles and that neither model had
fully learned to infer critical features accurately.
After reviewing these studies, it becomes evident
that there are key areas within AI-driven emotion and
drowsiness detection, as well as explainability, that
remain underexplored or need refinement. Our work
seeks to address these challenges by developing a
non-intrusive system that leverages deep learning for
emotion detection and more generalizable techniques
for drowsiness assessment. Thus, we propose the in-
tegration of XAI methodologies to facilitate a deeper
analysis of model outcomes. By transcending mere
accuracy metrics, XAI not only enhances the inter-
pretability of the models but also provides valuable
insights into their decisions, which can be used to re-
fine them.
3 EXPERIMENTATION
3.1 Emotion Recognition Dataset
For the analysis of emotions, the use of FER-2013
dataset is proposed (Goodfellow et al., 2013). This
dataset consists of 35,887 grayscale images in JPEG
format with a resolution of 48x48 pixels. Each im-
age depicts a face expressing one of seven emotions:
anger, disgust, fear, happiness, sadness, surprise and
neutrality. The dataset is organized into two sets: a
training set of 28,709 images and a test set of 7,178
images. Both sets maintain an identical distribution
of images across the seven emotion classes. For this
study, the test set was further divided to create a val-
idation set, resulting in 3,591 test images, and 3,587
Analyzing Model Behavior for Driver Emotion Recognition and Drowsiness Detection Using Explainable Artificial Intelligence
335
validation images. The validation set is employed for
hyperparameter optimization to ensure proper model
tuning. Directly evaluating model performance and
adjusting hyperparameters using the test set risks in-
corporating it into the training process, thereby bias-
ing the evaluation. This would compromise the ability
of the test set to serve as an objective measure of the
model’s generalization capability.
It is important to note that the dataset is not bal-
anced across emotion classes. For instance, happy
class comprises 25% of the total images, while dis-
gust class represents only 2%. This imbalance can
introduce challenges, as models may become bi-
ased toward predicting the most frequently occur-
ring emotions, potentially misclassifying underrepre-
sented categories.
3.2 Drowsiness Detection Dataset
For the drowsiness detection system, we employed
UTA-RLDD (Ghoddoosian et al., 2019). It comprises
30 hours of RGB video footage, recorded from 60
participants. Each participant recorded three videos
(each approximately 10 minutes long) simulating dif-
ferent states: alertness, low vigilance, and drowsiness.
These three states are based on the Karolinska Sleepi-
ness Scale (KSS) (
˚
Akerstedt and Gillberg, 1990). For
this study, we opted to use only the alert and drowsy
classes to simplify the task to binary classification.
By focusing on a binary problem, the classification
task becomes more straightforward, minimizing con-
fusion and overlap between the intermediate state and
the two extreme states. The videos feature a diverse
group of participants, including 51 men and 9 women,
of various ethnicities and age groups. Additionally,
21 videos feature subjects wearing glasses, and 72
videos depict subjects with significant facial hair. The
dataset presents a wide range of real-world scenarios,
with videos recorded from different angles and in var-
ious environments, although none involve driving or
simulator activities. Instead, participants engaged in
tasks such as reading, observing, or remaining idle.
The videos were processed using OpenCV, a C++
library for image manipulation. Each video was con-
verted into individual frames, with 750 frames ex-
tracted per video in a distributed manner based on
its duration, ensuring a representative coverage of the
entire video. In addition, given that the focus of
this system is on detecting drowsiness from facial ex-
pressions, we applied a cropping technique to isolate
participants faces. This preprocessing step was im-
plemented using OpenCV’s Haar Cascade classifiers.
After cropping, the resolution of the images was re-
duced to 64x64 pixels.
To maintain consistency with the emotion detec-
tion system, the data were divided into training, val-
idation and test sets, following an 80/10/10 split.
Specifically, frames from 48 participants were allo-
cated to the training set, 6 participants to the valida-
tion set, and 6 participants to the test set. This divi-
sion was performed on a per-subject basis to ensure
that no images from the same individual appeared in
both the training and evaluation sets, thus preventing
overfitting and ensuring that the model’s performance
generalized to unseen subjects. The final dataset con-
sists of 72,000 images in the training set and 9,000 in
both validation and test set. Figure 1 provides exam-
ple images extracted from the original dataset.
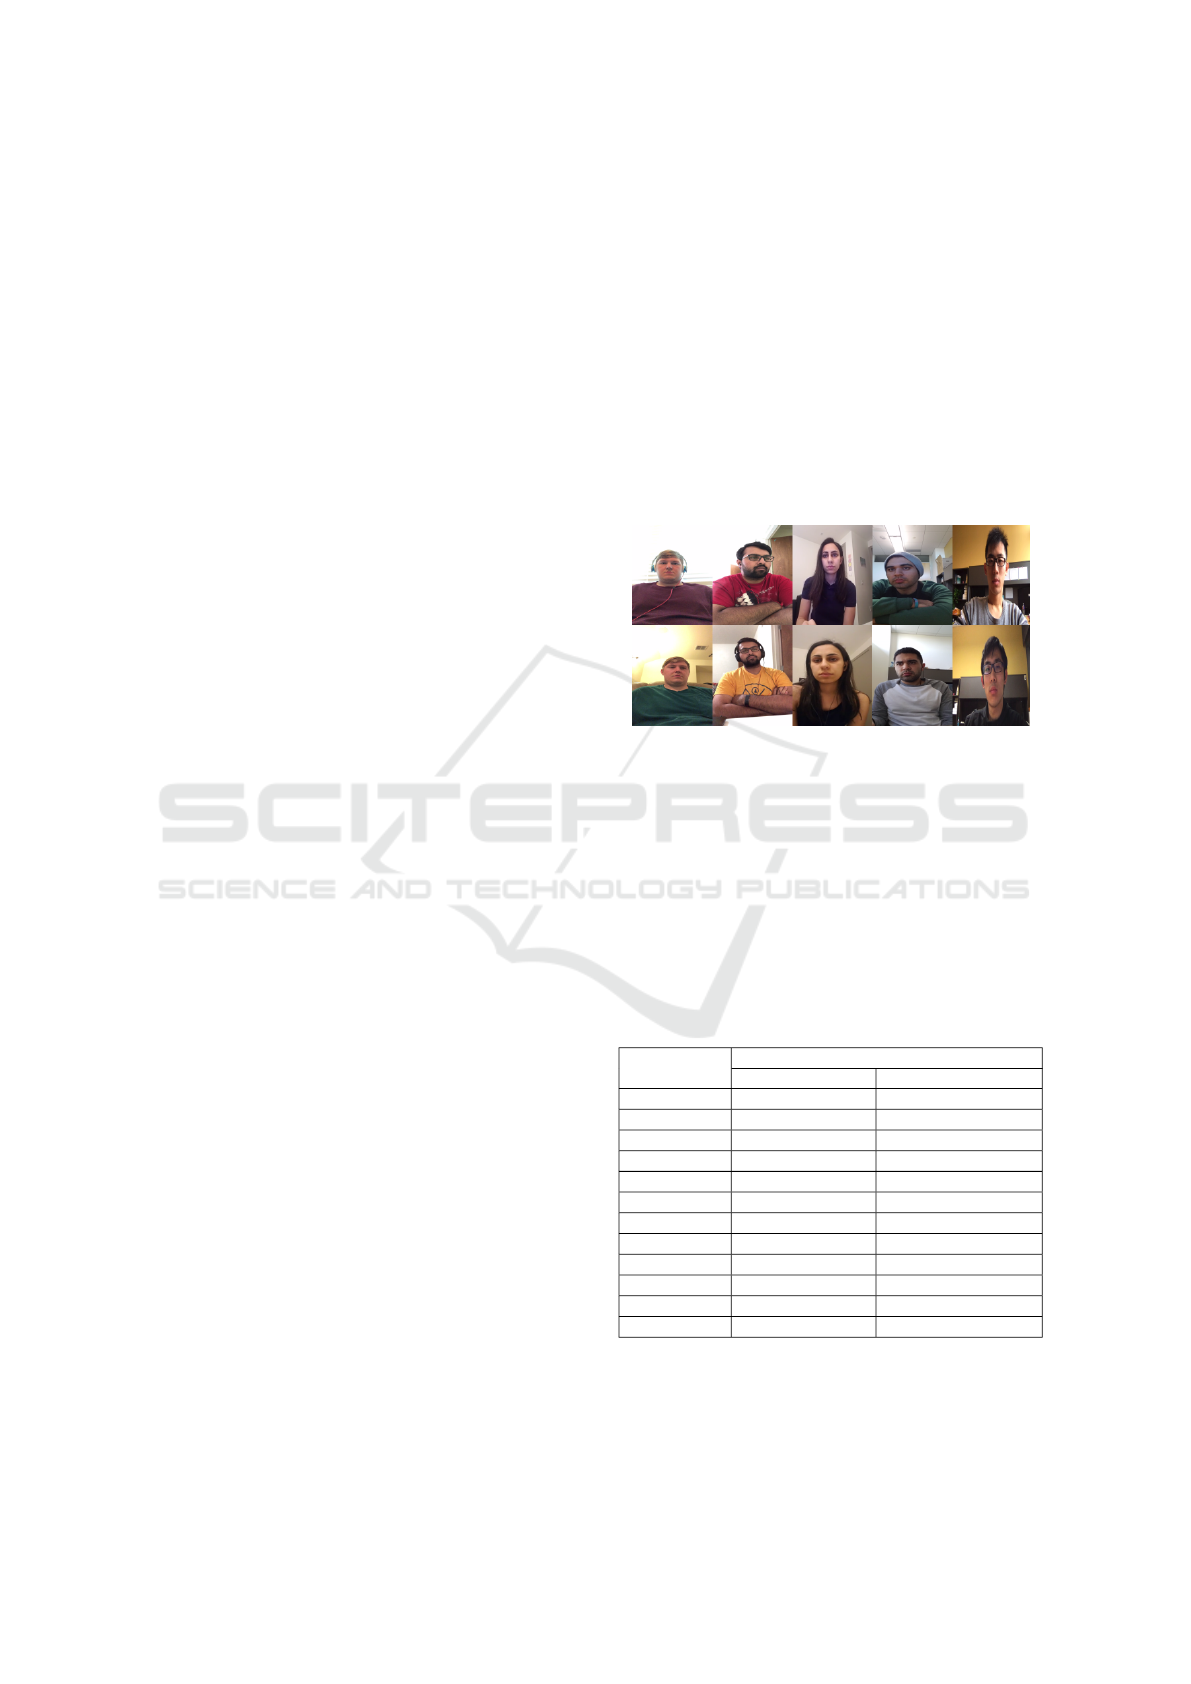
Figure 1: UTA-RLDD image examples. Alert images (first
row). Drowsy images (second row).
3.3 Architectures and Hyperparameters
In the domain of CNN, several baseline architectures
have been established as effective for image-based
analysis tasks. We show in Table 1 those used in this
work ordered from least to most complex in terms of
depth and number of parameters and we also include
the number of epochs that each model was trained in.
Table 1: Architectures and training epochs of both systems.
Model
Training Epochs
Emotion Models Drowsiness Models
LetNet 50 50
LetNetBD 50 50
AlexNet 50 50
AlexNetBD 50 50
ZfNet 50 50
ZfNetBD 50 50
VGG-11 25 25
VGG-11BN 50 50
VGG-16 25 25
VGG-16BD 50 50
VGG-19 25 25
VGG-19BD 50 50
In the names, “BD” suffix indicates that the model
architecture includes both, Batch Normalization and
Dropout layers, and “BN” suffix that the model only
includes Batch Normalization layers. Batch Normal-
VEHITS 2025 - 11th International Conference on Vehicle Technology and Intelligent Transport Systems
336

ization helps stabilize the learning process by normal-
izing activations, while Dropout prevents overfitting
by randomly deactivating neurons during training.
Regarding hyperparameters, in Table 2 we sum-
marize those used for every model in both systems.
Table 2: Hyperparameters of both systems.
Hyperparameter Emotion Drowsiness
Activation Function
(Intermediate Layers)
ReLU
Activation Function
(Output Layer)
SoftMax Sigmoid
Optimizer Adam
Learning Rate 0.0003 0.000001
Batch Size 32 16
Note that all of the experiments and training were
made using data augmentation techniques like ran-
dom rotations and random flips in order to increase
training data. Thus, we enhance the network’s abil-
ity to learn the key features of the images rather than
“memorizing” the input data, thereby greatly reduc-
ing the likelihood of overfitting.
4 RESULTS
4.1 Emotion Models Results
The results, collected in Table 3 in descending order
of test accuracy, show that most models performed
reasonably well on the training set, achieving accu-
racy values between 0.7 and 0.9. However, certain
models, such as LeNet, struggled to surpass 60%.
Table 3: Accuracy results of emotion models.
Model Train Validation Test
VGG-16BD 0.7577 0.6627 0.6441
VGG-19BD 0.7729 0.6560 0.6374
VGG-11BN 0.8858 0.6471 0.6371
ZfNetBD 0.8139 0.6348 0.6213
AlexNetBD 0.7792 0.6323 0.6188
VGG-11 0.6893 0.6117 0.6099
ZfNet 0.8271 0.6183 0.5926
AlexNet 0.7473 0.5896 0.5764
LeNet 0.5579 0.5269 0.5341
LeNetBD 0.4616 0.5096 0.5216
VGG-16 0.2509 0.2473 0.2470
VGG-19 0.2491 0.2473 0.2470
Models like VGG-16 and VGG-19, while deep and
complex, initially yielded poor results due to their ar-
chitecture’s complexity. However, introducing batch
normalization and dropout layers (resulting in VGG-
16BD and VGG-19BD) significantly improved their
performance. On the validation set, the VGG mod-
els incorporating these adjustments performed best,
achieving around 66% accuracy. Test set results
closely mirrored those of the validation set, suggest-
ing that the data distribution between the two sets was
highly similar, which is encouraging.
Accuracy analysis over test set results indicate that
deeper models tend to perform better, and the use of
batch normalization was critical for high-performing
models on small datasets with low-resolution images.
The VGG-16BD model emerged as the top performer
with 64.4% accuracy, and thus, was selected as the
final model for the emotion detection system. Nev-
ertheless, if we examine the training accuracy col-
umn, we observe that VGG-16BD only achieved 0.76.
Therefore, it was decided to repeat its training with
100 epochs, instead of 50, with the aim of slightly
improving its performance. After training for 100
epochs, this model achieved 66.3% accuracy on the
test set, which represents a 2% improvement com-
pared to the model trained for only 50 epochs. Fur-
thermore, the confusion matrices in Figure 2 demon-
strate that the model trained for 100 epochs performs
better across all classes, except for angry. Particu-
larly, for the disgust class (which is the minority class
and the worst categorized by the rest of the models),
60% of the images are correctly classified.
Figure 2: VGG-16BD results trained for 50 epochs (left)
and trained for 100 epochs (right).
Regarding other notable aspects, the classes most
frequently misclassified by the model include fear,
anger and neutral, which are often confused with sad-
ness, while the disgust class is misclassified as anger
in 18% of cases. In contrast, the happy and surprise
classes achieved the best results, with accuracy values
of 0.86 and 0.82, respectively.
4.2 Drowsiness Models Results
Similar to the emotion detection system, the perfor-
mance of all selected models on the drowsiness detec-
tion task is analyzed. Table 4 shows that the majority
of models achieved over 90% accuracy on the train-
ing set, with a few models slightly underperforming
Analyzing Model Behavior for Driver Emotion Recognition and Drowsiness Detection Using Explainable Artificial Intelligence
337
at around 80%. This is a stark contrast to the emo-
tion detection system, where training accuracy values
were between 24.9 and 88.6.
Table 4: Accuracy results of drowsiness models.
Model Train Validation Test
AlexNet 0.9434 0.6592 0.7184
LeNet 0.9699 0.7224 0.6797
LeNetBD 0.9139 0.6646 0.6630
VGG-11BN 0.8074 0.6334 0.6486
VGG-16 0.9672 0.7367 0.6421
VGG-16BD 0.9727 0.7490 0.6370
VGG-19 0.8268 0.6884 0.6236
VGG-19BD 0.9567 0.7579 0.6152
ZfNet 0.9642 0.6067 0.6083
VGG-11 0.9317 0.6660 0.5918
AlexNetBD 0.8036 0.6719 0.5112
ZfNetBD 0.9406 0.7454 0.4928
The validation set results indicate consistent per-
formance across most models, with VGG-19BD, both
VGG-16, ZfNetBD and LeNet performing best, reach-
ing accuracy values higher than 70% and up to 76%.
However, test set performance diverges from the val-
idation set results, unlike the emotion detection mod-
els. The main reason for this is the division of the
original dataset by subjects. Since the validation set
consists of six different subjects from those in the test
set, the features learned by the models may perform
better for the images of some subjects than for oth-
ers. Additionally, depending on the quality and rep-
resentativeness of each subject’s images, it may be
easier for the models to classify them. For example,
there may be some subjects within a set whose videos
are not as representative as those in the other set, or
whose poor lighting conditions make it difficult to
clearly see the subject’s features. As a result, the dif-
ferences in model performance between the two sets
are more pronounced. Moreover, the fluctuations in
validation accuracy during the training are much more
abrupt, compared to the gradual improvement seen in
the training of emotion detection models.
Analyzing the confusion matrices, we observed
that most models performed better at predicting the
awake class. VGG-19BD and VGG-19 were notable
exceptions, excelling in predicting the drowsy class,
due to their higher complexity, which make them
more effective at learning subtle features. In Figure 3,
the confusion matrix of the model with the highest ac-
curacy (AlexNet) on the test set is compared with the
second one (LeNet). However, this result comes at the
cost of excellent prediction for the awake class but
very poor performance for the drowsy class. There-
fore, it is not sufficient to base the final model selec-
tion solely on the accuracy values achieved.
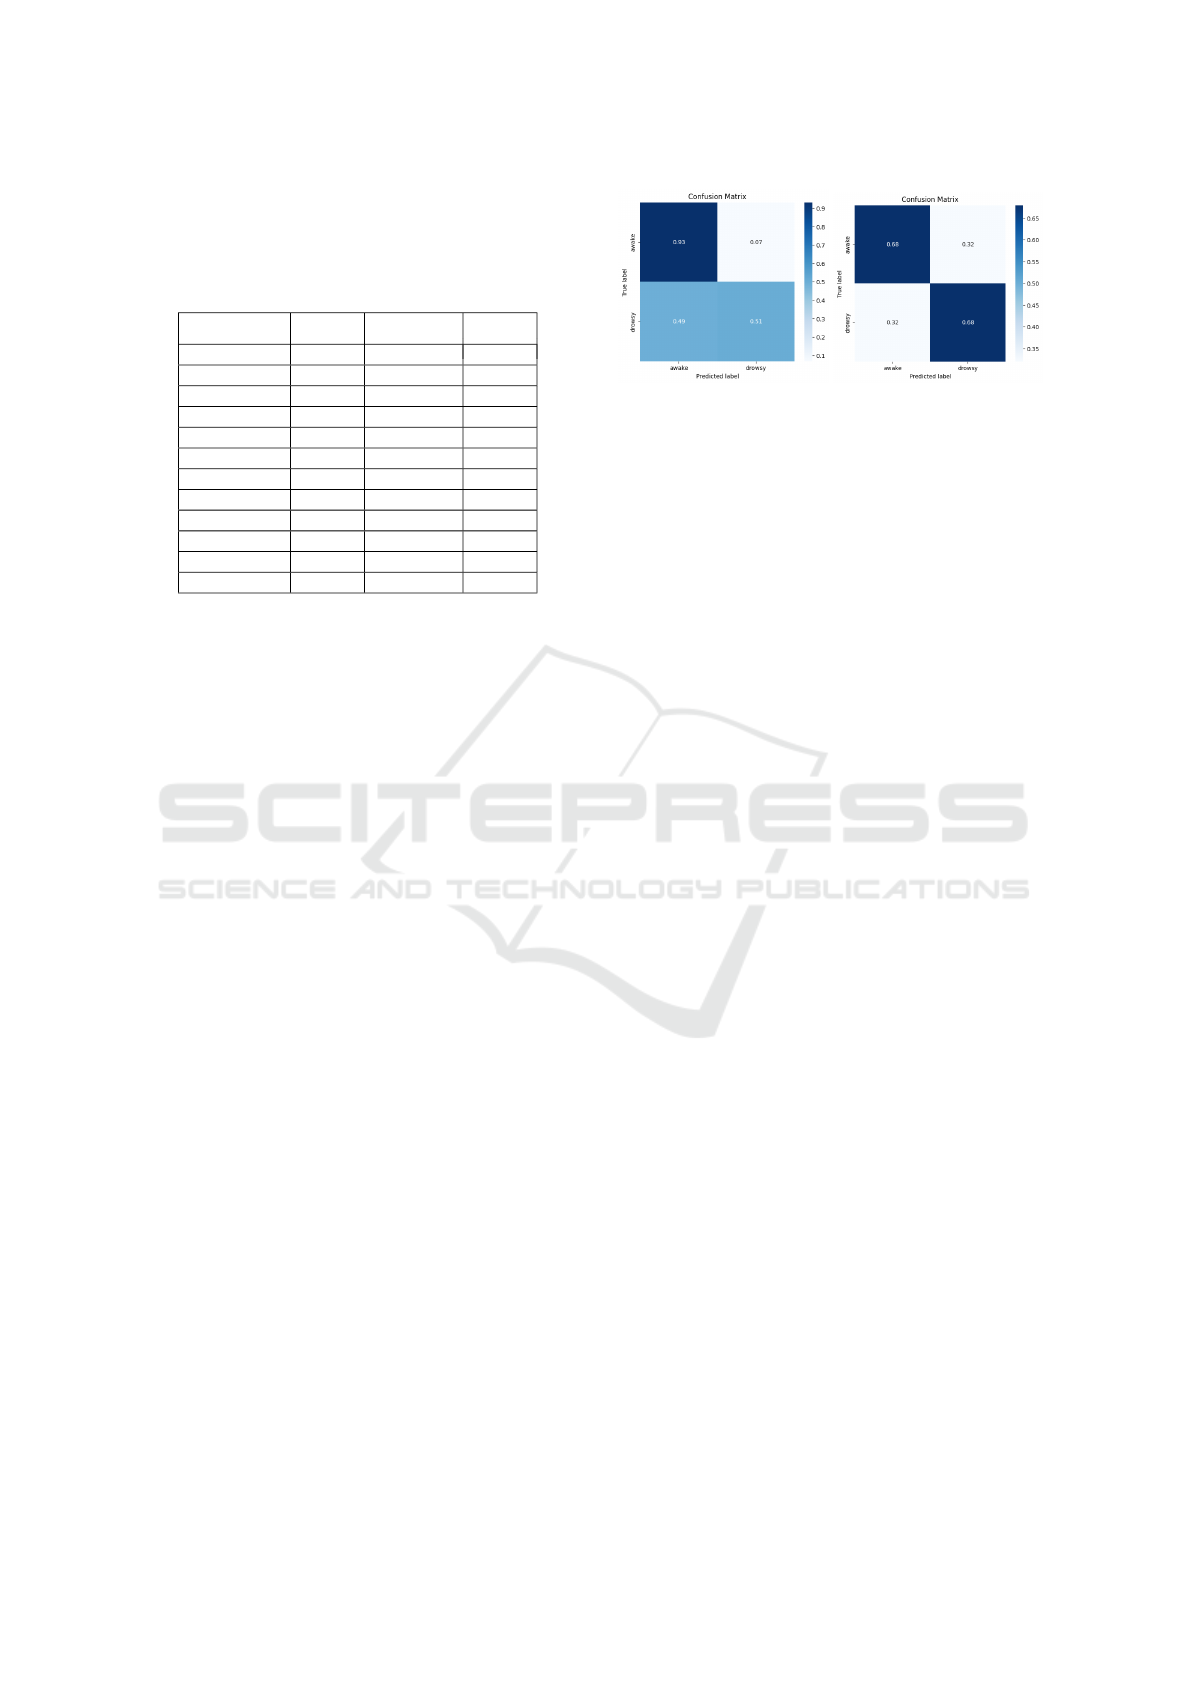
Figure 3: AlexNet confusion matrix (left) and LeNet con-
fusion matrix (right).
After analyzing all the results in Table 4, along
with the graphs and confusion matrices of the mod-
els, LeNet was chosen as the final model due to its
good performance on both the test and validation sets,
its balanced confusion matrix and its false positive
rate of 32%. This metric is particularly important in
the context of driver monitoring, since a high false
positive rate could lead to unnecessary alerts. Al-
though some models, such as AlexNet, have a lower
rate (below 7%), they exhibit very poor accuracy for
the drowsy class. Therefore, this low false positive
rate cannot be considered valid, as the model is classi-
fying more than 70% of instances as awake, making it
unsurprising that there are hardly any false positives.
5 XAI ANALYSIS
Given the inherently non-explanatory nature of neu-
ral networks, which are considered “black box” mod-
els, the need arises to understand the reasons that lead
these types of algorithms to make certain decisions.
Being able to explain the results can be significantly
beneficial, offering advantages such as trust, inter-
pretability, transparency and stability. In addition, it
can enhance model performance by identifying and
rectifying potential issues in decision-making.
In the context of XAI, various approaches are pre-
sented, such as textual or simplification explanations
and feature relevance, among others. However, in
the context of this work, we need to utilize algo-
rithms that can apply explainability to input images
while being compatible with CNN. This will allow us
to understand which parts of the images the gener-
ated model places greater importance on when mak-
ing decisions. Some of the most commonly used tech-
niques that meet the aforementioned requirements are
LIME (Ribeiro et al., 2016), SHAP (Lundberg and
Lee, 2017) and XRAI (Kapishnikov et al., 2019). The
last one is a method of attribution based on integrated
gradients which divides the image into regions and
calculates the importance of each one. This results
VEHITS 2025 - 11th International Conference on Vehicle Technology and Intelligent Transport Systems
338
in the observation of the most relevant sets of pixels
rather than individual pixels separated by spaces. Due
to its flexibility, ease of implementation, and compu-
tational efficiency, it has been the chosen technique
for the development of this work.
At this point, some of the main results obtained
by applying the XRAI technique during image clas-
sification by the final models chosen in the previous
section are presented. The figures shown below con-
sist of four images, presented in the following order
from left to right:
• Original: The input image to the classification
model tagged with its real label (left) and the pre-
diction (right).
• Heat Map: An image of a heat map overlaying the
original image, indicating the most important re-
gions in light colors and the least important areas
in darker colors in the model’s prediction.
• Top 30%: An image that uses the segments as a
mask, displaying only the top 30% of the original
image that holds the highest importance.
• Top 10%: Top 10% of the original image with the
greatest importance. This image allows visualiza-
tion of which part of the original image was most
considered during the model’s classification.
5.1 Emotion XRAI Observations
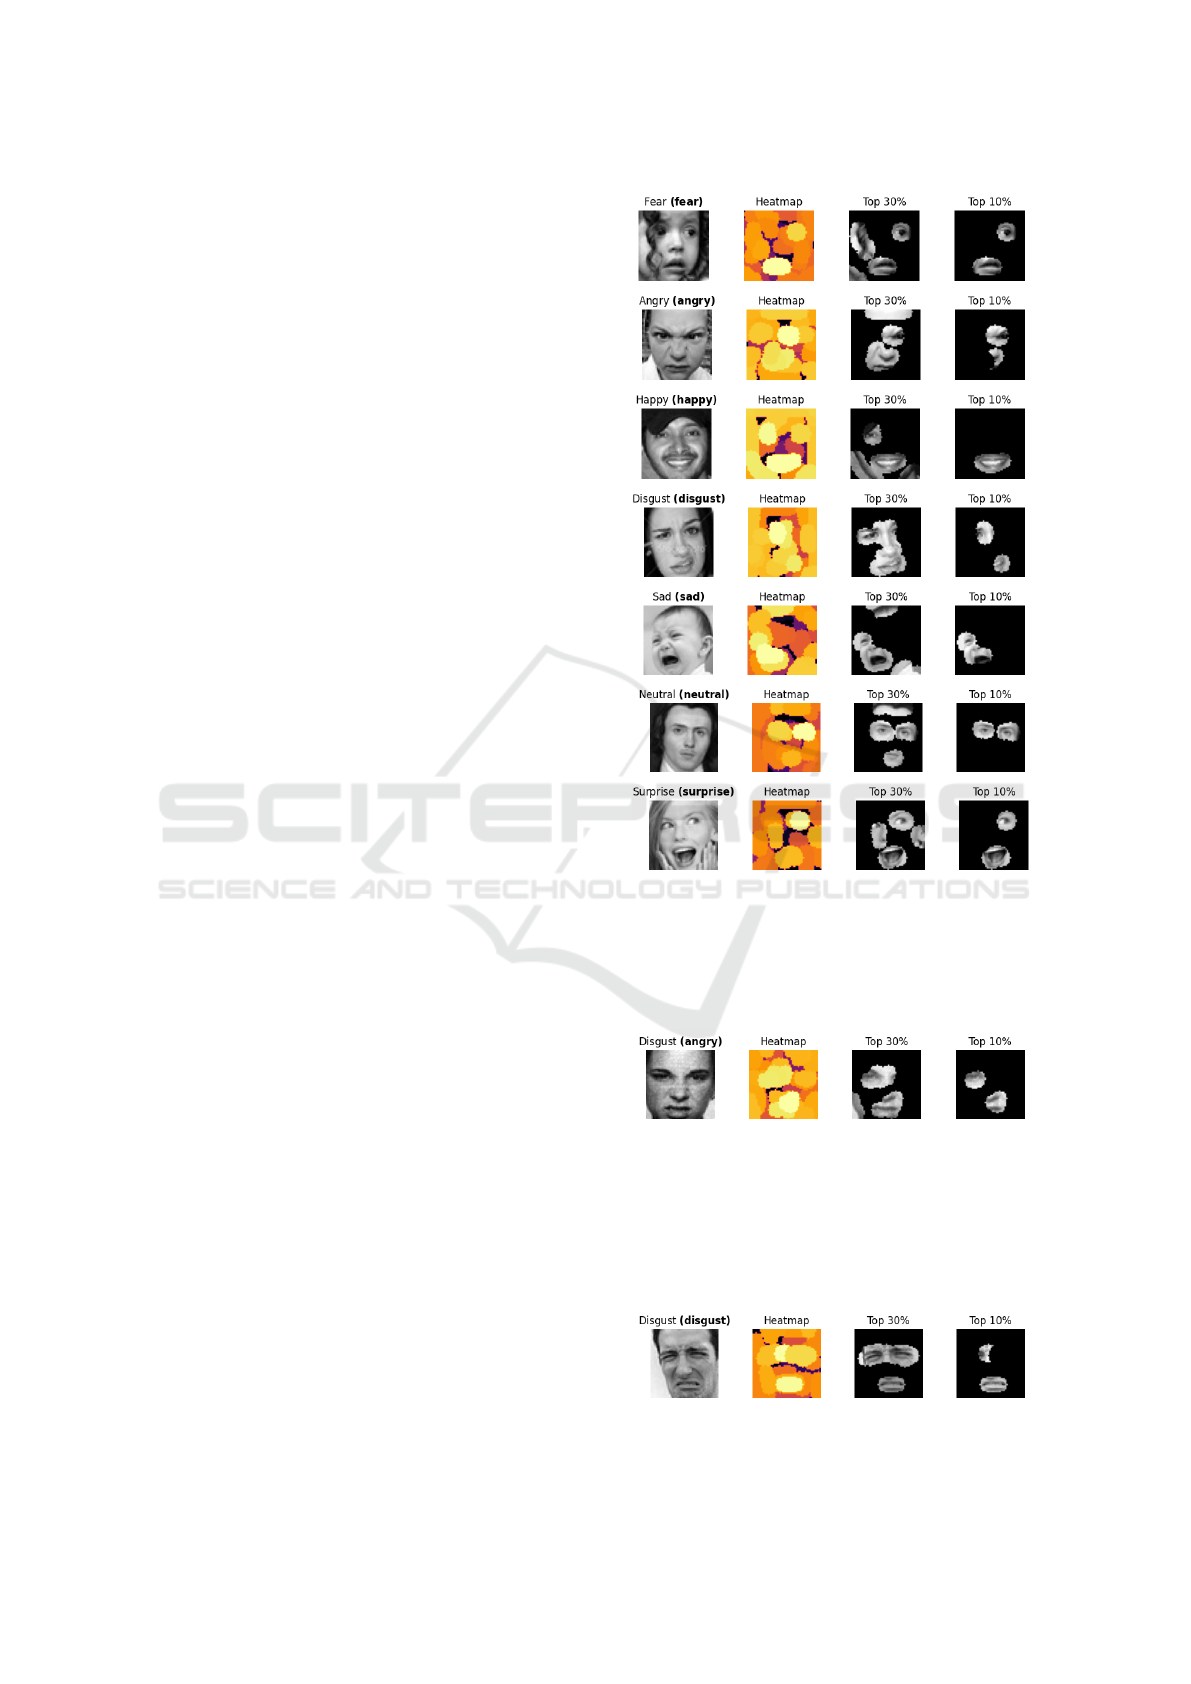
Figure 4 present an example of each class where the
model made correct predictions.
In these images, it can be observed that the model
focuses on representative aspects of each class. We
see that it places more importance on areas such as
the mouth, eyes, or certain facial expressions and ges-
tures. For instance, in the image of the surprise class,
the region of highest importance is the mouth, as an
open mouth is a clear sign of surprise. Similarly, in
the happy image, the smile is also a clear indicator of
happiness. In contrast, for the neutral class, we see
that the model also pays attention to the eyes, since
focusing solely on the mouth may not be decisive in
determining whether a person is in a neutral state.
After conducting various tests with images from
all classes, it has been demonstrated that the model
assigns greater importance to the regions of the im-
ages that a human would consider when determining
a person’s emotion based on their facial expression.
Furthermore, the application of XAI also allowed
for a better understanding of certain issues that could
not be addressed solely through the metrics or results
of the models. For example, by displaying images
from the disgust class that were classified as angry by
the model, as shown in Figure 5, it became evident
Figure 4: XAI applied to well classified emotion images.
that in many of these images, the subject does indeed
appear to be angry. Therefore, it is normal and under-
standable that the model confuses these two classes in
a manner similar to a human.
Figure 5: “Disgust” image mislabeled as “angry”.
It was also observed that for these types of classes,
such as disgust or angry, the model not only took
into account the mouths and eyes but also considered
the facial expressions produced in the eyes, nose, and
mouth, as seen in Figure 6.
Figure 6: Sample showing importance in facial expressions.
Analyzing Model Behavior for Driver Emotion Recognition and Drowsiness Detection Using Explainable Artificial Intelligence
339
5.2 Drowsiness XRAI Observations
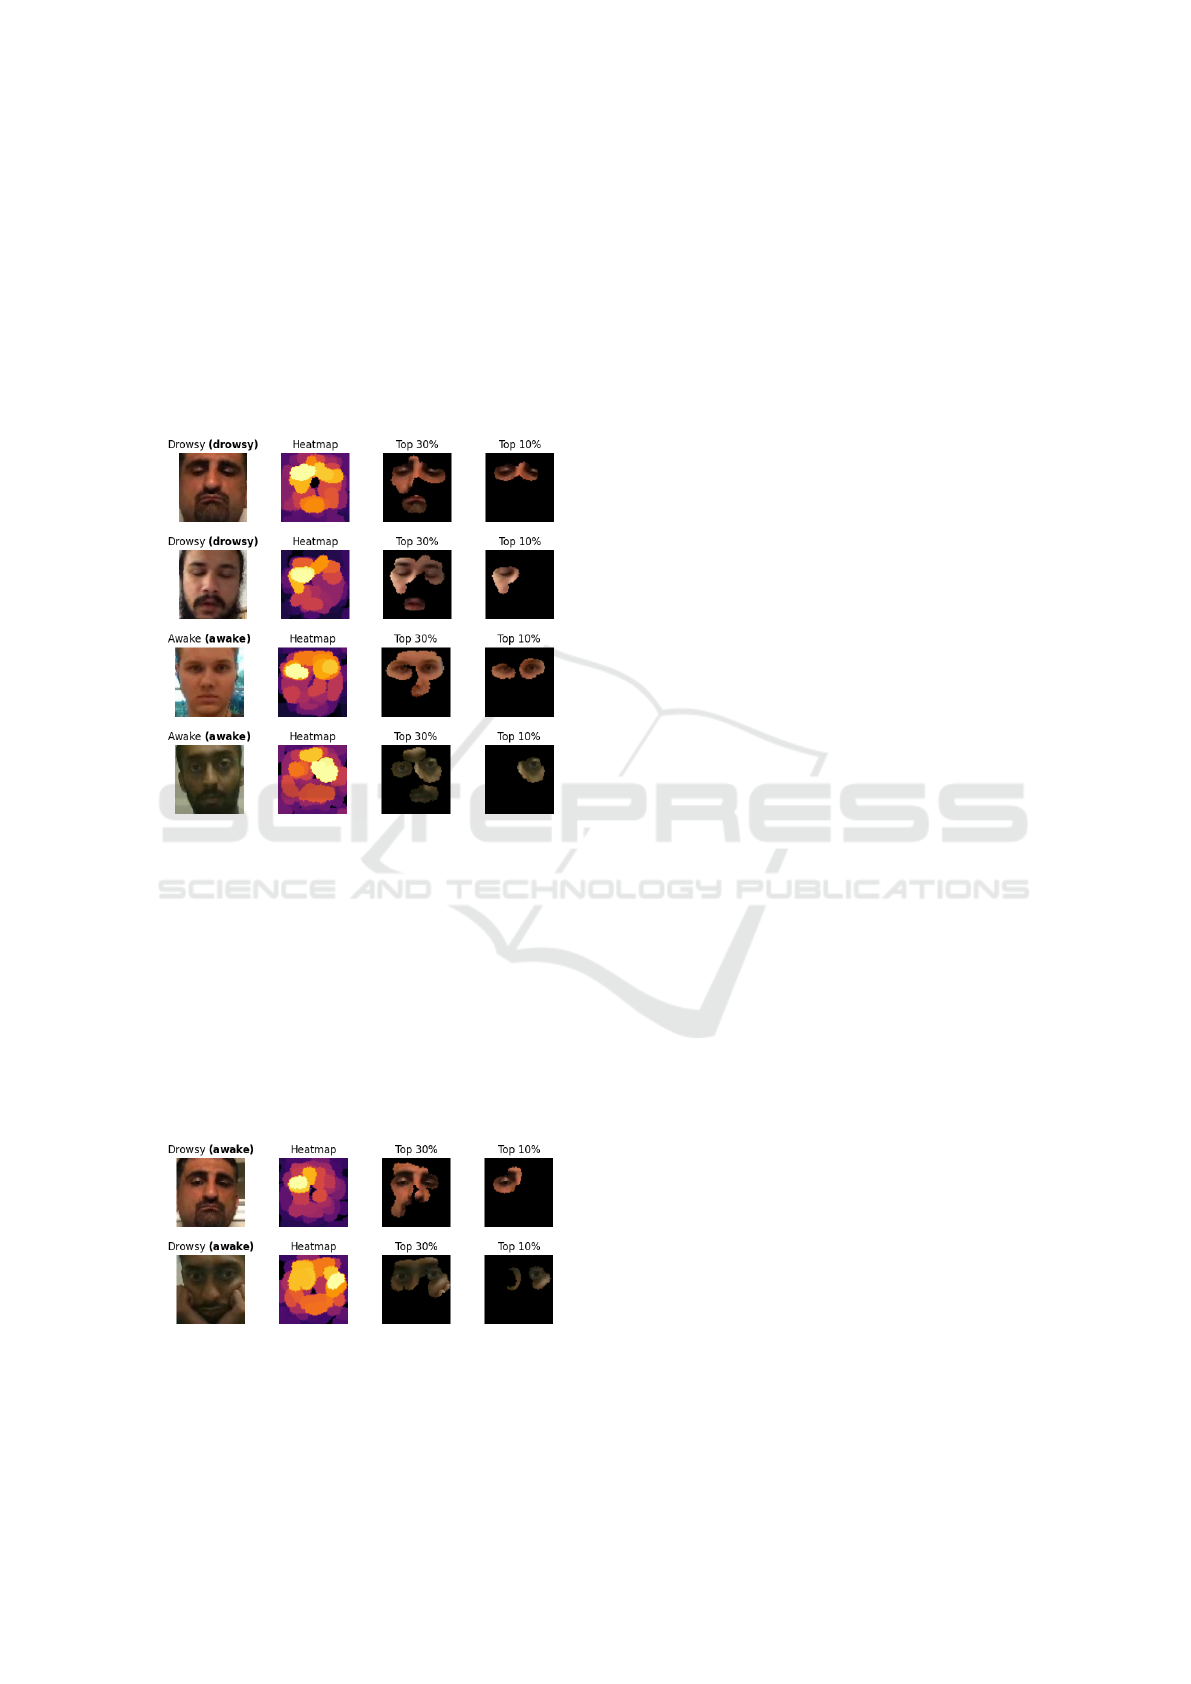
Figure 7 present two illustrative examples of correct
predictions for each class. It can be observed that the
model particularly focuses on the eyes to determine
the classification of the image. This is expected, as
the eyes are one of the main indicators of drowsiness,
being slightly or completely closed, as seen in the two
images of the drowsy class, or quite open, as is the
case in the images of the awake class.
Figure 7: XAI applied to well classified drowsiness images.
Regarding some of the misclassified images, we
analyzed that many of those classified as awake that
were actually drowsy, were images in which the sub-
jects appear with their eyes open and show no visible
signs of drowsiness, as shown in Figure 8. This issue
arises from the use of images extracted from videos,
as all images from a video classified as drowsy are
also labeled as drowsy. However, in some of these im-
ages, the subject does not appear to be tired, as they
are neither yawning nor have their eyes closed, nor
showing any other sign of drowsiness.
Figure 8: “Drowsy” labeled images classified as “awake”.
On the other hand, the application of XAI also re-
vealed some interesting aspects, such as that images
of subjects wearing glasses were often classified as
drowsy, as the model assigned the highest importance
to the regions of the images where the edges of the
glasses appeared during prediction. Other images,
despite being correctly classified, received attention
from the model in areas that are not relevant. In some
cases, the model focused on the mouth and ignored
the eyes when the subject had his eyes closed. Thus,
the conclusion in this situation is that the model has
not been able to accurately infer the appropriate fea-
tures that indicate whether a subject is drowsy or not.
6 SYSTEMS COMPARISON
When comparing the results of both systems, it is ev-
ident that drowsiness detection presents more com-
plex challenges in various aspects. In spite of achiev-
ing similar accuracy in the final models, the applica-
tion of XAI reveals that the emotion detection model
performs significantly better and aligns more closely
with the objectives. Firstly, the lower variability in
drowsiness data limits the models’ ability to gener-
alize correctly and leads to overfitting to the training
images, which explains the irregular validation accu-
racy graphs. In contrast, emotions, being relatively
stable manifestations on the human face, can be cap-
tured more accurately from static images. Drowsi-
ness, on the other hand, is a progressive process that
can fluctuate rapidly, and its effective detection re-
quires the analysis of temporal sequences to identify
patterns such as slow blinking or nodding. Images
alone fail to reflect these temporal variations, making
it significantly challenging for models based solely on
these images to predict drowsiness accurately. Fur-
thermore, drowsiness detection must contend with the
interpretation of more subtle signals than emotions,
which are often more explicit and easier to categorize.
7 CONCLUSIONS
This study has yielded significant insights into the
performance of emotion and drowsiness detection
non-intrusive systems. Furthermore, XAI has demon-
strated that these models effectively focus on facial
features that humans use for emotion and drowsiness
interpretation. In the domain of drowsiness detection,
we observed that models achieved faster learning due
to the reduced variability in data. However, the cycli-
cal nature of drowsiness symptoms introduces signif-
icant noise when using frames extracted from videos.
The application of XAI revealed that the quality
and balance of training datasets directly influence the
generalizability of the models, highlighting the neces-
VEHITS 2025 - 11th International Conference on Vehicle Technology and Intelligent Transport Systems
340

sity for well-curated data in future research. It is more
effective to train a model capable of accurately pre-
dicting specific situations and transfer the alert logic
to the ADAS. In other words, a model should be
trained on images where the class is clearly distin-
guishable, allowing it to achieve high performance in
classifying those images. Meanwhile, in the ADAS,
this model’s predictions can be combined with an al-
gorithm that determines when to alert the driver. This
method allows the model to focus on what it does
best: analyzing images and predicting states, while
the ADAS evaluates when it is appropriate to alert the
driver based on a combination of additional factors,
such as the duration of the detected drowsiness, vehi-
cle’s speed and other environmental parameters. Fur-
thermore, XAI has provided significant insights into
the model’s behavior, which would have been impos-
sible to ascertain solely by examining the accuracy
metrics. For instance, there are cases where images
labeled as drowsy were classified as awake due to the
absence of actual signs of fatigue. This finding re-
veals that these misclassifications are a consequence
of incorrectly labeled images, underscoring the criti-
cal importance of accurate dataset labeling. This fa-
cilitates the drawing of crucial conclusions, as those
mentioned before in this section, and paves the way
for future research avenues in driver monitoring.
In conclusion, we believe that the continued ap-
plication of XAI will be crucial for not only foster-
ing transparency and building trust in AI systems but
also for refining model behavior. By revealing the in-
fluence of specific features on predictions, XAI em-
powers practitioners to make informed adjustments,
ultimately leading to more reliable and effective deep
learning applications. Despite these advances, much
remains to be done to fully achieve interpretability
in CNN models. This research represents a prelim-
inary exploration, and we anticipate that continued
efforts will bring further clarity and refinement, ad-
vancing the development of transparent and reliable
AI applications for emotion and drowsiness detection
in ADAS. Drowsiness detection remains an open and
challenging problem but it is clear that deep learning
techniques have significant potential for incorporation
into ADAS, facilitating innovations that can greatly
enhance roadway safety and reduce accidents.
ACKNOWLEDGEMENTS
This research was funded by
MCIN/AEI/10.13039/501100011033 grant numbers
PID2022-140554OB-C32, PDC2022-133684-C31.
REFERENCES
Ghoddoosian, R., Galib, M., and Athitsos, V. (2019). A
realistic dataset and baseline temporal model for early
drowsiness detection.
Goodfellow, I. J., Erhan, D., Carrier, P. L., Courville, A.,
Mirza, M., Hamner, B., Cukierski, W., Tang, Y.,
Thaler, D., Lee, D.-H., Zhou, Y., Ramaiah, C., Feng,
F., Li, R., Wang, X., Athanasakis, D., Shawe-Taylor,
J., Milakov, M., Park, J., Ionescu, R., Popescu, M.,
Grozea, C., Bergstra, J., Xie, J., Romaszko, L., Xu,
B., Chuang, Z., and Bengio, Y. (2013). Challenges
in representation learning: A report on three machine
learning contests.
Jeon, M. (2016). Don’t cry while you’re driving: Sad driv-
ing is as bad as angry driving. International Journal
of Human–Computer Interaction, 32(10):777–790.
Jeon, M., Roberts, J., Raman, P., Yim, J.-B., and Walker,
B. N. (2011). Participatory design process for an in-
vehicle affect detection and regulation system for var-
ious drivers. In The Proceedings of the 13th Inter-
national ACM SIGACCESS Conference on Computers
and Accessibility, ASSETS ’11, page 271–272, New
York, USA. Association for Computing Machinery.
Kapishnikov, A., Bolukbasi, T., Vi
´
egas, F., and Terry, M.
(2019). Xrai: Better attributions through regions.
Lorente, M. P. S., Lopez, E. M., Florez, L. A., Espino, A. L.,
Mart
´
ınez, J. A. I., and de Miguel, A. S. (2021). Ex-
plaining deep learning-based driver models. Applied
Sciences, 11(8).
Lundberg, S. and Lee, S.-I. (2017). A unified approach to
interpreting model predictions.
Mag
´
an, E., Sesmero, M. P., Alonso-Weber, J. M., and San-
chis, A. (2022). Driver drowsiness detection by apply-
ing deep learning techniques to sequences of images.
Applied Sciences, 12(3).
Ribeiro, M. T., Singh, S., and Guestrin, C. (2016). ”why
should i trust you?”: Explaining the predictions of any
classifier.
Sheykhivand, S., Mousavi, Z., Rezaii, T. Y., and Farzamnia,
A. (2020). Recognizing emotions evoked by music
using cnn-lstm networks on eeg signals. IEEE Access,
8:139332–139345.
Tamanani, R., Muresan, R., and Al-Dweik, A. (2021). Esti-
mation of driver vigilance status using real-time facial
expression and deep learning. IEEE Sensors Letters,
5(5):1–4.
Verma, B. and Choudhary, A. (2018). A framework for
driver emotion recognition using deep learning and
grassmann manifolds. pages 1421–1426.
Zepf, S., Hernandez, J., Schmitt, A., Minker, W., and Pi-
card, R. W. (2020). Driver emotion recognition for
intelligent vehicles: A survey. ACM Comput. Surv.,
53(3).
˚
Akerstedt, T. and Gillberg, M. (1990). Subjective and ob-
jective sleepiness in the active individual. The Inter-
national journal of neuroscience, 52:29–37.
Analyzing Model Behavior for Driver Emotion Recognition and Drowsiness Detection Using Explainable Artificial Intelligence
341
