
Urban Growth in Metropolitan Regions Using Dynamic Modeling by
Cellular Automata: A Comparative Analysis Between Brazil and
Portugal
Elizabeth Maria Feitosa da Rocha de Souza
1a
, Antonio Alberto Teixeira Gomes
2b
and Vandre Soares Viegas
1c
1
Federal University of Rio de Janeiro, Department of Geography, Graduate Program in Geography Geosciense Institute,
Rio de Janeiro, Brazil
2
University of Porto, Faculty of Arts and Humanities, Porto, Portugal
Keywords: Cellular Automata, Spatial Dynamic Models, Urban Areas, Metropolitan Regions.
Abstract: This study synthesizes the outcomes of land use changes obtained through the implementation of dynamic
modeling by cellular automata across two metropolitan regions in Portugal and Brazil. The purpose is to
analyze the primary findings acquired, considering the particularities of each nation and evaluate the
potentialities of the used data. The study examined the metropolitan regions of MRRJ (Rio de Janeiro, Brazil)
and AMP (Porto, Portugal). Modifications were implemented in the DinamicaEgo software to the
fundamental data representing static and dynamic variables for each context. The findings revealed a
substantial increase of urban areas in the MRRJ, and the modeling demonstrated its applicability across the
two contexts, considering the requisite modifications for the data accessible in each country.
1 INTRODUCTION
Cellular models in urban modelling became implicit
in early computer models of the 1960s, e.g., the work
of Chapin and Weiss for North Carolina (Chapin and
Weiss,1968) Waldo Tobler's model for Detroit in
1970 (Tobler, 1970), and the model developed by
Couclelis for Los Angeles in 1989 (Couclelis,1989).
Cellular automata (CA) have emerged as the
prevailing architectural design employed in spatial
simulation models. Cellular automata, as defined by
Stephen Wolfram, are mathematical representations
of physical systems in which time and space are
discrete (Wolfram, 1983). These representations take
the form of a regular uniform grid, where each
location contains a discrete variable. In accordance
with a predetermined set of local rules and the values
of the variables in their immediate vicinity at the
previous time increment, the variables in each cell are
updated simultaneously. CA models have the
capability to emulate various concerns associated
a
https://orcid.org/0000-0002-2672-8169
b
https://orcid.org/0000-0002-1764-0659
c
https://orcid.org/0000-0002-2880-8314
with land use changes. They can be used to create
self-modifiable models for high-resolution urban land
use dynamics, prototypes to simulate land conversion
via integrated Geographic Information Systems (GIS)
(Clarke, et al 1997; White et al, 1997; Wu, 1998) and
have numerous applications for simulating scenarios
involving urban dynamics (Barredo et al, 2003;
White, and Engelen, 1993). The use of dynamic
models can support the definition of environmental
public policies that involve the assessment of land use
and land cover as a fundamental component to unders-
tand changes that may result from combined biophysi-
cal and socioeconomic factors, with both short-term
and long-term impacts (Meyer and Turner, 1992).
In this context, the research aimed to identify
potential scenarios of land use and land cover change
until the year 2050 in the Metropolitan Area of Porto
(AMP) and the Metropolitan Region of Rio de Janeiro
(MRRJ), specifically within the boundaries of
urbanized territories, while observing changes
between classes and specificities.
142
Souza, E. M. F. R., Gomes, A. A. T. and Viegas, V. S.
Urban Growth in Metropolitan Regions Using Dynamic Modeling by Cellular Automata: A Comparative Analysis Between Brazil and Portugal.
DOI: 10.5220/0013205000003935
Paper published under CC license (CC BY-NC-ND 4.0)
In Proceedings of the 11th International Conference on Geographical Information Systems Theory, Applications and Management (GISTAM 2025), pages 142-149
ISBN: 978-989-758-741-2; ISSN: 2184-500X
Proceedings Copyright © 2025 by SCITEPRESS – Science and Technology Publications, Lda.
2 STUDY AREA
The study area encompasses two Metropolitan
Regions: Metropolitan Area of Porto (AMP) and the
Metropolitan Region of Rio de Janeiro (MRRJ -
Figure 1). Although referred to by different
acronyms—AMP for the Metropolitan Area of Porto
in Portugal and MRRJ for the Metropolitan Region of
Rio de Janeiro in Brazil—both regions fulfil
analogous roles within their respective national
contexts. In 2021, the Porto Metropolitan Area
(AMP), composed of 17 municipalities, had a
population of approximately 1,7 million inhabitants
distributed across an area of 2,040 km². Meanwhile,
the Rio de Janeiro Metropolitan Region (RMRJ),
consisting of 22 municipalities, was home to around
12 million inhabitants in an area of 6,700 km², with
significantly higher population density due to the
concentration of people in municipalities like Rio de
Janeiro, São Gonçalo, and Duque de Caxias. These
regions represent important urban hubs in their
respective countries, facing distinct challenges in
terms of planning and urban development.
Each area functions as a logistical hub for regional
planning, economic development, and the
coordination of urban services. Both regions
represent densely populated areas that support
integrated infrastructure alongside public policy
frameworks. This functional alignment underscores
the significance of metropolitan regions as
foundational elements in urban planning and
governance in each country.
Figure 1: Study area - Areas considered in the study for
comparison purposes
Situated in southeastern Brazil, the Metropolitan
Region of Rio de Janeiro (MRRJ) is an extremely
urbanized, multifaceted, and diverse region. This
region, which includes the capital city, Rio de Janeiro,
and significant neighbouring municipalities including
São Goncalo, Duque de Caxias, and Niterói, is
renowned for its geographical, historical, and
economic importance. Based on a survey carried out
in 2022 by the Brazilian Institute of Geography and
Statistics (IBGE, 2022), the Metropolitan Region of
Rio de Janeiro is the second most populous
metropolitan area in Brazil, comprising 74% of the
total population of the state of Rio de Janeiro, with an
estimated 12 million inhabitants.
The Metropolitan Area of Porto is the second
largest in Portugal, encompassing 17 municipalities
around the city of Porto. According to data from the
Land Use and Occupation Map - COS2022 (Instituto
Nacional de Estatística, 2022).
The AMP has emerged as a strategic area for
advancing mobility and sustainability projects,
essential for the region's future.
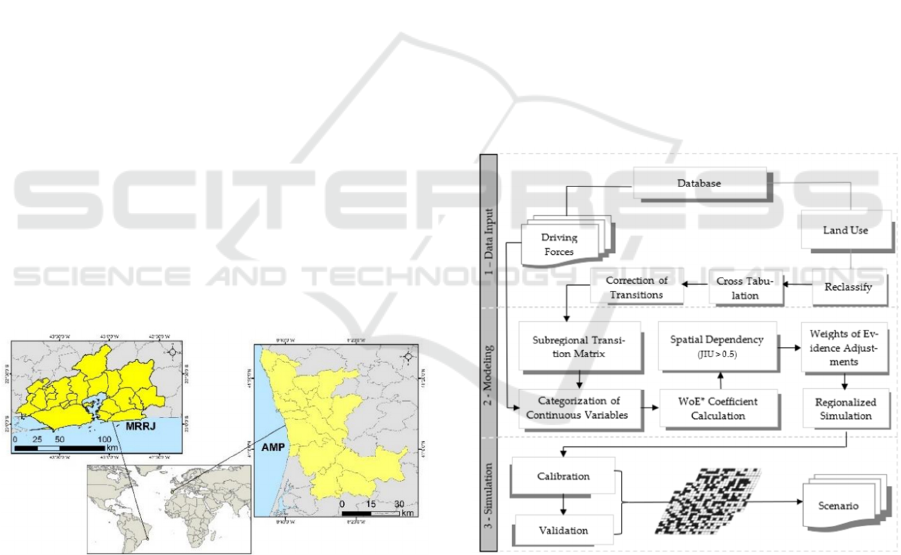
3 MATERIALS AND METHODS
The CA model used in this work is implemented in
the Dinamica EGO (Environment for Geoprocessing
Objects) platform 7.4, a software developed by
researchers from Federal University of Minas Gerais
(UFMG). The methodology used is presented
according to the scheme shown in Figure 2.
Figure 2: Workflow (*WoE – Weights of Evidence).
Simulation models utilize two types of
explanatory variables, divided between Static and
Dynamic. The former remains unchanged at each
temporal step of the model, while the latter changes
with each iteration based on the distance from the
central axis being analyzed.
The first step in the modeling process is
parameterization using the Weight of Evidence
method, following the Bayesian approach. This
Urban Growth in Metropolitan Regions Using Dynamic Modeling by Cellular Automata: A Comparative Analysis Between Brazil and
Portugal
143

involves assigning weights to different input
variables based on their relevance to the specific
problem.
Historical transition matrices are calculated. The
transition matrix describes a system that changes in
discrete increments of time. In the Dinamica EGO
platform, matrices are calculated using a Markovian
model, which combines the Markov Chains technique
with Cellular Automata. Dinamica EGO also employs
Markov chains to determine the amount of change, as
well as cellular automata to reproduce patterns of
these changes from probability maps, which are
calculated using the Weight of Evidence statistical
method (Soares Filho et al, 2002). Cellular automata
(CA)-based models have been widely used due to
their ability to simulate dynamic spatial patterns. The
choice of the CA-Markov model in this study is
justified by its integration of Markov transition
matrices with dynamic spatial modeling, enabling the
capture of land use changes with high temporal and
spatial granularity.
For the desired period—a range of years—two
types of matrices are generated: a global matrix,
representing the transition rates for the entire training
period, and a multistep matrix, which reflects annual
changes. The global matrix aggregates all transitions
across the specified period, while the multistep matrix
allows for more granular modeling by representing
changes on an annual basis.
It is important to clarify which transitions are
being modeled, as this directly influences the
simulation outcomes. In DINAMICA, transitions are
managed through two Cellular Automata (CA)
algorithms: the Patcher, which simulates the
aggregation of land patches, and the Expander, which
models the expansion of existing areas. These
mechanisms ensure that spatial patterns align with the
observed dynamics, providing a robust framework for
projecting future scenarios.
In Dinamica EGO, a set of sub-regional functors
is used to process the data separately in each sub-
region. In this model, transitions are simulated
annually for each of the subdivisions, dividing a map
into parts for separate data processing and then
combining the results. This allows the modeler to
define operations that should be applied only to
specific sub-regions or different parameters and
coefficients. The result is a model that respects the
regional context. In both cases, the transitions of
interest focus on changes to urban, vegetation, and
cultivated areas.
The dynamic variables considered in this study
are exclusively related to land use and land cover in
the years specified for each region: AMP and MRRJ.
These variables reflect temporal changes that directly
influence the projected scenarios and are updated in
each iteration of the model. The static variables, on
the other hand, remain constant throughout the
modeling process and represent potential factors
influencing the observed and projected land use
changes. These variables include hydrography,
transportation systems, and topography, which play a
fundamental role in defining spatial patterns of urban
expansion and enable the simulation of future
scenarios. The dynamic variables include distances
from existing urban areas, which are updated at each
iteration of the model, while static variables, such as
elevation and the hydrographic network, remain
unchanged. Dinamica EGO uses Markov matrices to
determine transition rates and spatial patterns based
on weights of evidence calculated using the Bayesian
method.
In summary, the calibration was conducted using
the Expander and Patcher functions, which simulate,
respectively, the expansion of existing patches and
the formation of new urban patches. To address the
specificities of the study area, the model was
regionalized, dividing the territory into subareas with
distinct characteristics and adjusting parameters for
each region. This process allowed for greater
accuracy in annual simulations, respecting regional
contexts and producing results tailored to the
geographic complexity of each studied area.
Validation was based on spatial similarity between
simulated and observed maps from 2021 (RMRJ) and
2019 (AMP), using fuzzy methods and moving
windows. The simulation was regionalized to account
for local characteristics of the territory, such as
differences between rugged terrain areas and
lowlands. The model annually simulates transitions,
adjusting parameters to reflect local dynamics and
generate accurate predictions of urban expansion.
3.1 Metropolitan Area Porto –
Portugal - Model
The Metropolitan Area of Porto (AMP) was modeled
utilizing the subsequent variables: land use and
occupation, roads and railways, hydrography,
elevation and slope.
The elevation and slope values were derived using
the USGS-provided NASADEM Digital Elevation
Model (30m spatial resolution).
At a 1:10,000 scale, the road network is an
integral component of the National Motorway
Network, while the railway network is an extension
of the National Railway Network.
GISTAM 2025 - 11th International Conference on Geographical Information Systems Theory, Applications and Management
144

The hydrographic network is a 1:200,000 scale
representation of the principal channels and rivers
extracted from the Hydrography Network of
Continental Portugal. Only the main rivers and
channels were considered. While pertinent to the
simulation process, this class is regarded as limiting
in the modeling process for the expansion of the
urbanized class.
In the study, the Land Use and Occupation Map
(COS) for 2015 and 2018 was considered for the
preliminary analysis, focusing on the base period
2015–2018. The primary categories analyzed were
vegetated cover, agricultural regions, and urbanized
areas. To project future scenarios, the model
incorporated simulations for specific years: 2030,
2040, and 2050. A cross-tabulation analysis was
conducted using the converted matrix dataset,
maintaining the same spatial resolution to assess
changes over time and validate the model's outputs.
3.2 Metropolitan Region in Rio De
Janeiro/Brasil - Model
In MRRJ, the initial and final maps come from the
time series provided by Mapbiomas (collection 7.1),
including the years 2016 and 2021, that is, a period of
05 years, con-sidered sufficient to identify areas of
urban expansion.
The MapBiomas 7.1 collection includes annual
land use and land cover data for the period 1985 to
2021. The secondary data taken from the platform
have some spatial inconsistencies in the thematic
classifications, often due to noise and main-ly in
classes and transversal themes, e.g., agriculture and
pasture. Currently, there are 30 classes available,
from macro-classes 1 - Forest; 2 - Non-Forest Natural
Formation; 3 - Farming; 4. Non vegetated area; 5 –
Water. The static variables were obtained from
official Brazilian agencies (hydrography, road
system, and topography).
The first stage of adjusting the Mapbiomas data
consists of correcting incorrect transitions that
normally occur in the form of isolat-ed pixels and
have no correspondence in the real world, for
example, a pixel classified as urban infrastructure
should not transition to the water class.
The established rule was that no pixel originally
classified as urban infrastructure (class 24) - Areas
with significant density of buildings and roads -
should transition to other classes. After the correc-
tion, the other subclasses other than urban
infrastructure were converted to the “Others” class,
maintaining binary use maps.
Finally, the last phase involves data calibration,
validation, and scenario observation. The maximum
value of the Fuzzy similarity index is considered,
using exponential decay for window sizes of 3x3,
5x5, 7x7, 9x9, and 11x11 as a validation method. The
index varies from 0 to 1, where 1 indicates perfect
spatial agreement.
Kernel Density Estimation was applied in the
study to enhance the identification of change-prone
areas.
4 RESULTS
Regarding the parameterization of the transition
algorithms, Expander and Patcher, the model
achieved better validation results with a higher
percentage assigned to the Expander algorithm:
0.92% (RMRJ) and 0.87% (AMRJ).
Considering the threshold mentioned in (Soares
Filho et al, 2002), where values close to 0.6 in the
similarity index with exponential decay indicate
adequate spatial congruence between simulated and
real maps, it is reasonable to conclude that, in terms
of suitable similarity, the period from 2015 to 2018
(AMP) and from 2016 to 2021 (MRRJ) showed
satisfactory adjustments, especially in the 3x3
window.
4.1 Metropolitan Region in Rio De
Janeiro/Brasil
To Metropolitan Region of Rio de Janeiro Based on
the model, the following areas are identified as
particularly promising for urban expansion in 2050:
Situated west of the Capital, on the boundary between
the Santa Cruz and Guaratiba communities.
Additional noteworthy localities within the Capital
comprise Campo Grande, Vila Militar, Campo dos
Afonsos, Vargem Grande, and Recreio dos
Bandeirantes. These are areas with available spaces
for urban occupation and increased construction.
Furthermore, the Baixada Fluminense encompasses
municipalities Duque de Caxias, Magé, Nova Iguacu,
and Seropedica, all of which exhibit substantial
prospects for development.
In the East Fluminense, Maricá, Niterói, and São
Goncalo are the municipalities that are undergoing
the most significant urban development. In the
Mountain subregion, Petrópolis municipality
observes noteworthy urban expansion in the vicinity
of the central area, which encompasses the Vila
Militar and Valparaíso neighborhoods. In the
southern region, notable residential areas include
Urban Growth in Metropolitan Regions Using Dynamic Modeling by Cellular Automata: A Comparative Analysis Between Brazil and
Portugal
145
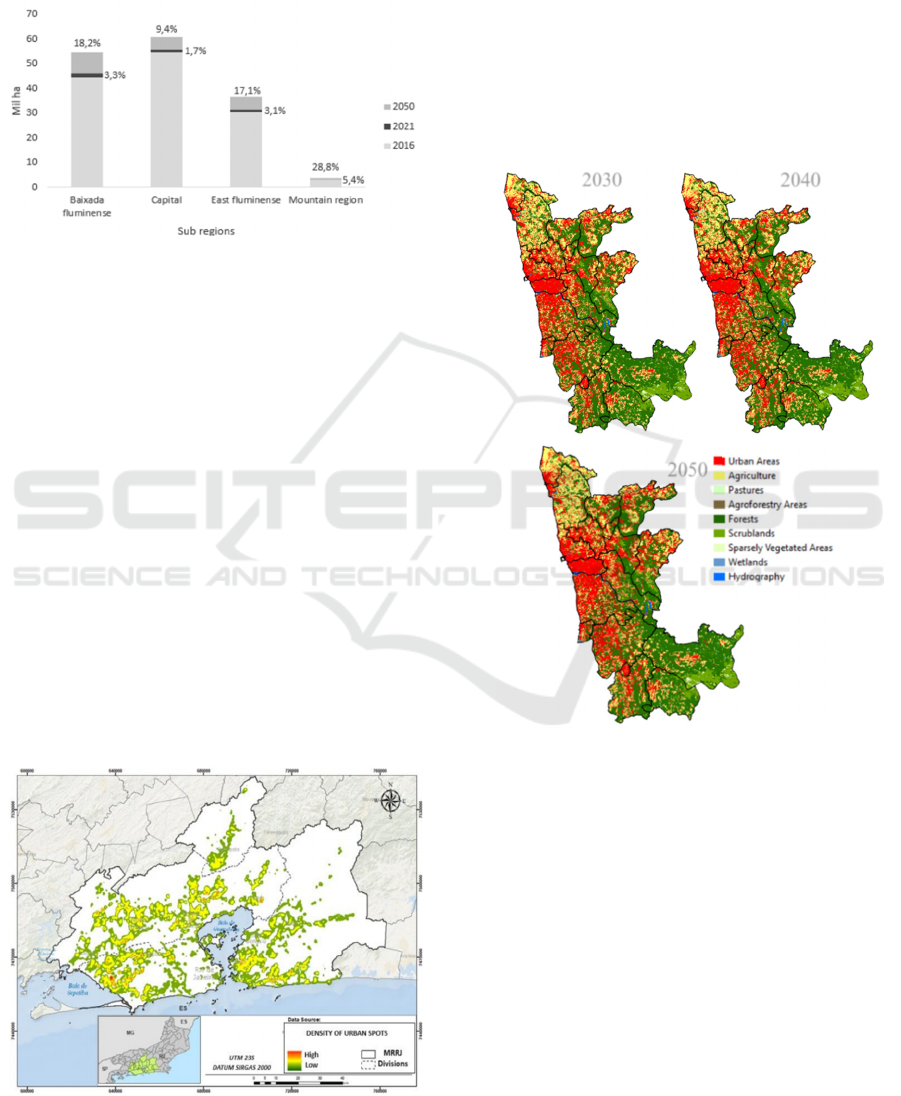
Independência and Quitandinha. Notable are the
regions of Mosela to the west and Bonsucesso and
Itaipava to the north. The aforementioned regions
symbolize the anticipated epicenters of urban growth
as predicted by the model for the year 2050 (Figure 3).
Figure 3: Urbanization by subregion through 2050,
represented graphically by absolute and relative values.
Kernel density estimation (Figure 4) was
employed to depict urban expansion in 2050. This
interpolator enables the determination of the
magnitude of a particular occurrence throughout an
entire region (Freire, 2015). Druck et al, (2004)
describe how the Kernel density estimator creates a
surface whose value is proportional to the sample
intensity per unit area and fits a two-dimensional
function to the considered events in order to estimate
the point intensity of the process across the entire
study region. Kernel Density estimates the intensity
of events (in this case, urbanization) per unit of area,
generating a continuous surface that highlights
regions with higher concentrations of change. This
technique complemented the analysis based on
transition matrices, enabling the mapping of regions
with significant urban change. The use of this
methodology was essential due to the high variability
in land use in the MRRJ, providing a more detailed
Figure 4: Urban Expansion Scenario for 2050 in MRRJ.
view of urbanization hotspots and enhancing future
scenarios for urban planning and environmental
management.
Municipalities outside the capital (Rio de Janeiro)
highlight a current trend of urban expansion and
demand for housing and new developments.
4.2 Metropolitan Area Porto - Portugal
The Figure 5 highlights the results obtained after
modeling for the years 2030, 2040, and 2050 with a
detailed analysis of the evolution.
Figure 5: Future Landuse Scenarios for AMP in 2030, 2040,
and 2050.
A 2.66 percent increase in urbanized territories is
observed across the entire study area from 2030 to
2040, and a 2.55 percent increase from 2040 to 2050.
The projected increases for agricultural regions are
1.13% and 1.08%, correspondingly. On the contrary,
a decline in forested regions is noted, fluctuating by
approximately 1.8% during both time periods.
The Figure 6 delineates the regions where
anticipated alterations occur during the examined time
frames. There is a total of 2274 polygons. From 2023
to 2040, there is a projected total of 1097 regions
undergoing changes, namely involving the conversion
of brush areas into urbanized zones and the
transformation of brush areas into agricultural land.
2030
2040
2050
GISTAM 2025 - 11th International Conference on Geographical Information Systems Theory, Applications and Management
146
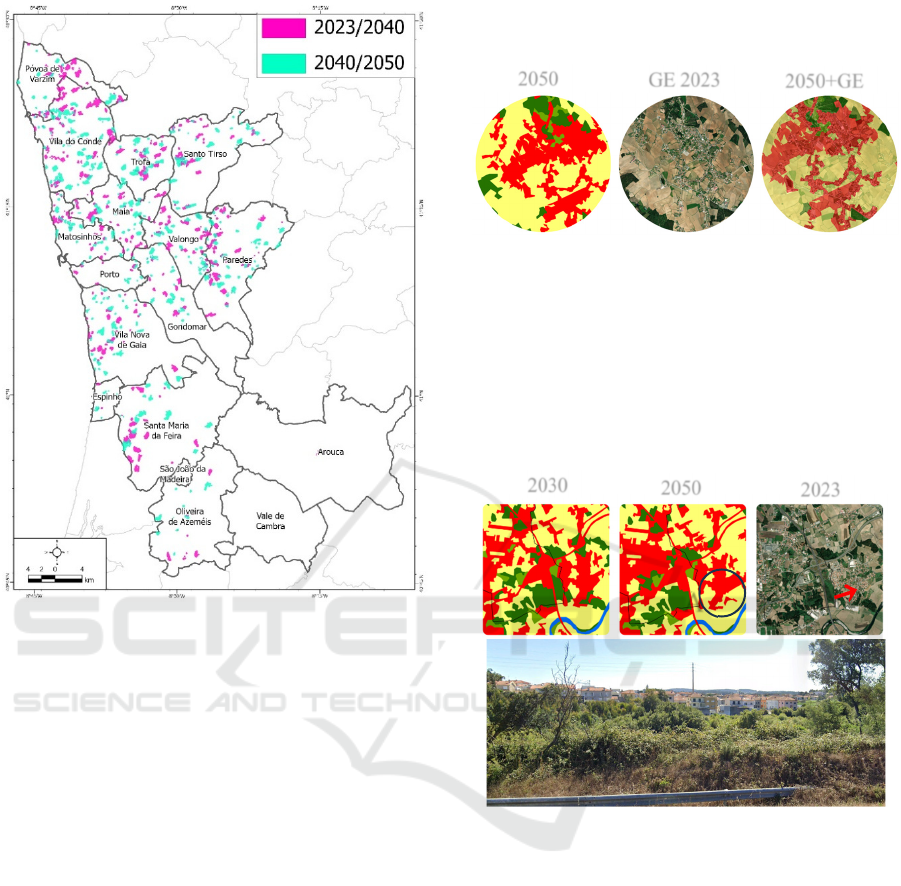
Figure 6: Regions with alterations in landuse during 2023 –
2040 and 2040 and 2050.
There is a significant concentration of expansion
near the cities of Vila Nova de Gaia, Matosinhos, and
Gondomar, which are already densely urbanized
areas close to the metropolitan center of Porto. This
growth suggests a continuous trend of urbanization in
peri-urban areas and an expansion into zones with
existing infrastructure.
In the period from 2040 to 2050, growth appears
more dispersed, with new urbanization points
emerging in regions such as Paredes, Santo Tirso, and
Oliveira de Azeméis, indicating a possible gradual
decentralization of the observed expansion. This
pattern suggests a potential saturation of central areas
and a search for new development zones on the
periphery of the AMP, leading to a more balanced
growth between municipalities in the northern and
southern parts of the Metropolitan Area. These data
highlight the need for integrated urban planning to
meet the growing demands for infrastructure and
services in these emerging regions.
Figure 7 highlights the projection for the Serra do
Monte area (Northern Region of the AMP), with three
representations: the 2050 projection showing
urbanized area growth; a 2023 GE image as a
reference; and a combination of both, indicating
urban area densification and anticipated changes.
Figure 7: Changes in 2050 for Serra do Monte, Northern
Region of the AMP.
Figure 8 demonstrates the predominant vegetation
scenario near the A28 highway, which may be
impacted by increased urban construction by 2050.
The imagem also highlights an on-site view of the
area. The red arrow indicates the direction of the
photo's viewpoint.
Figure 8: Changes in 2050 for Póvoa de Varzim.
Vila Nova de Gaia, located south of Porto, is
expected to expand residential growth in areas with
exposed soil and available land, as highlighted in
Figure 9.
The results presented for the Metropolitan
Regions of Rio de Janeiro (RMRJ) and the
Metropolitan Area of Porto offer distinct perspectives
regarding urban expansion projections. In the RMRJ,
there is a notable focus on specific expansion areas,
particularly in sub-regions with significant growth,
such as the Baixada Fluminense and the East
Fluminense. In the case of the Metropolitan Area of
Porto, direct changes in land use stand out, detailing
transformations in agriculture and urbanized
territories. The conversion of areas from scrubland
and agriculture into urbanized territories is
emphasized. In both contexts, the results converge by
A
A
2030
2050
2023
2050
GE 2023
2050+GE
Urban Growth in Metropolitan Regions Using Dynamic Modeling by Cellular Automata: A Comparative Analysis Between Brazil and
Portugal
147
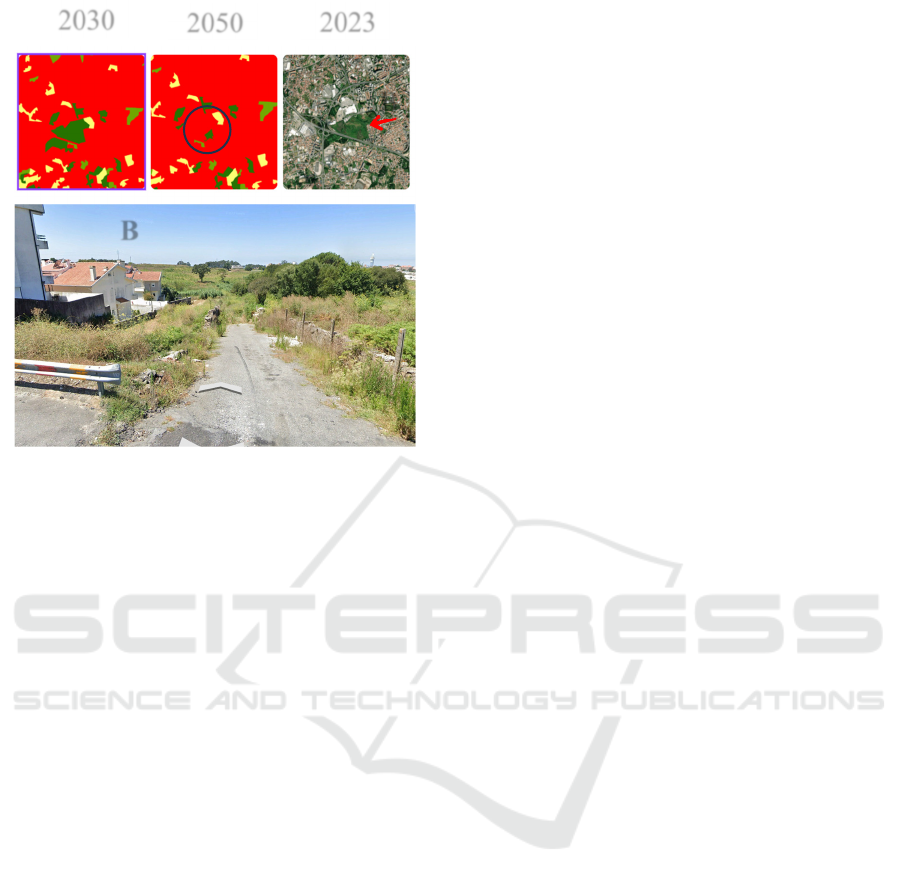
Figure 9: Changes in 2050 for Vila Nova de Gaia.
highlighting challenges related to urban growth, such
as inadequate infrastructure and environmental
impacts, underscoring the need for sustainable public
policies and careful urban planning in both regions.
5 CONCLUSIONS
This study presents a synthesis of the outcomes
achieved by employing cellular automata to perform
dynamic modeling in multiple metropolitan regions
of Portugal and Brazil. The research centers on the
primary discoveries, taking into account the specific
characteristics of each nation and the data utilized,
while analyzing the metropolitan areas of Rio de
Janeiro (RMRJ) and Porto (AMP). The DinamicaEgo
software was modified with respect to the
fundamental data that represented static and dynamic
variables in each respective context. The findings
unveiled a significant rise in RMRJ, thereby
illustrating the model's versatility in different
settings, contingent upon the data requirements of
each country.
The findings pertaining to urban expansion
projections for the Metropolitan Region of Rio de
Janeiro (RMRJ) and the Metropolitan Area of Porto
(AMP) present unique and discernible viewpoints.
RMRJ places considerable emphasis on particular
expansion zones, particularly in rapidly developing
subregions like Baixada Fluminense and East
Fluminense. Particular attention is paid to explicit
alterations in land use within AMP, which pertain to
agricultural and urbanized regions. Both contexts
emphasis the transformation of agricultural and
scrubland regions into urbanized ones. The findings
converge in that they emphasize the environmental
impacts and insufficient infrastructure associated
with urban expansion, thereby emphasizing the
necessity for sustainable public policies and
meticulous urban planning in both areas.
In future stages of the research, new variables are
intended to be included in the modeling process. The
boundaries of protected areas in the AMP may improve
the delineation of urban areas for future decades.
ACKNOWLEDGEMENTS
We would like to express our sincere gratitude to
CNPq (National Council for Scientific and
Technological Development) and FAPERJ
(Foundation for Research Support of the State of Rio
de Janeiro) for their financial support, which was
essential to the successful development of this
research. Their contributions have played a crucial
role in enabling us to carry out this work.
REFERENCES
Barredo, J.; Kasanko, M.; McCormick, N.; Lavalle, C.
(2003) Modelling dynamic spatial processes:
simulation of urban future scenar-ios through cellular
automata. Landscape and Urban Planning, 64, 145–
160.
Chapin, J.R.; Weiss, S.F. (1968). A probabilistic model for
residential growth. Transportation Research, v.2 p 375-
390.
Clarke, K.; Hoppen, S.; Gaydos, L. (1997) A self-modifying
cellular automaton model of historical urbanization in
the San Francisco Bay area. Environment and Planning
B, 24, 247–261.
Couclelis, H. (1989) Macrostructure and Microbehavior in
a Metropolitan Area. Environment and Planning B,
v.16, p.141-154.
Druck, S., Carvalho, M. S., Câmara, G., & Monteiro, A. V.
M. (2004). Análise Espacial de Dados Geográficos.
Brasília: Embrapa.
Freire, F. H. M. A. (2015). Introdução à Estatística
Espacial. Recuperado de http://www.observatoriodas
metropoles.ufrj.br/download/aulasanalise-espacial.pdf/
Instituto Brasileiro de Geografia e Estatística (IBGE).
(2022). Censo results 2022. Acesso https://censo20
22.ibge.gov.br/panorama/
Instituto Nacional de Estatística (INE). (2022). Land Use
and Occupation Map (COS2022). Lisboa: INE.
2030
2050
2023
B
B
GISTAM 2025 - 11th International Conference on Geographical Information Systems Theory, Applications and Management
148

Meyer, W. B., & Turner, B. L. (1992). Human population
growth and global land-use/cover change. Annual
review of ecology and systematics, 23(1), 39-61.
Soares-Filho, B. S., Cerqueira, G. C., & Pennachin, C. L.
(2002). DINAMICA—a stochastic cellular automata
model designed to simulate the landscape dynamics in
an Amazonian colonization frontier. Ecological
Modelling, 154(3), 217-235.
Tobler, W. R. (1970). A computer movie simulating urban
growth in the Detroit region. Economic Geography,
46(2), 234–240.
White, R.; Engelen, G.; Uljee, I. (1997) The use of
constrained cellular automata for high-resolution
modeling of urban land use dy-namics. Environment
and Planning B, 24, 323–343.
White, R.; Engelen, G. (1993). Cellular automata and
fractal urban form: a cellular modelling approach to
the evolution of land use patterns. Environment and
Planning A, 25, 1175–1199.
Wolfram, S. (1983) Statistical mechanics of cellular
automata. Review of modern physics, v. 55, p.601-643.
Wu, F. (1998) SimLand: A prototype to simulate land
conversion through the integrated GIS and CA with
AHP-derived transition rules. International Journal of
Geographical Information Systems, 12(1), 63–82.
Urban Growth in Metropolitan Regions Using Dynamic Modeling by Cellular Automata: A Comparative Analysis Between Brazil and
Portugal
149
