
Towards Synergistic Effects of C-ITS Services: Assessing the Joint
Impact of GLOSA and CACC on Traffic Efficiency and Sustainability
Manuel Walch
1 a
, Calvin Clausnitzer
2
and Matthias Neubauer
1 b
1
Logistikum - Department of Logistics Management, University of Applied Sciences Upper Austria,
Wehrgrabengasse 1-3, 4400 Steyr, Austria
2
Master’s Degree Program Supply Chain Management, University of Applied Sciences Upper Austria,
Wehrgrabengasse 1-3, 4400 Steyr, Austria
{manuel.walch, matthias.neubauer}@fh-steyr.at, cclausnitzer@fastmail.fm
Keywords:
Cooperative Intelligent Transport System, C-ITS, GLOSA, CACC, Impact Assessment, Traffic Simulation.
Abstract:
This paper investigates the combined effects of Cooperative Adaptive Cruise Control (CACC) and Green Light
Optimal Speed Advisory (GLOSA) on traffic efficiency and sustainability using microscopic traffic simula-
tions. Addressing a gap in the literature, the research focuses on the simultaneous use of these Cooperative
Intelligent Transport System (C-ITS) services rather than their individual effects. Simulations were conducted
at three test sites with varying traffic characteristics and different penetration rates of C-ITS technologies. The
results demonstrate that CACC significantly improves traffic flow and reduces CO
2
emissions starting at a
16% penetration rate. However, the effects of GLOSA were marginal and statistically insignificant within the
chosen simulation setup. The combined use of CACC and GLOSA provided slight improvements over CACC
alone, though these differences were not statistically significant. The findings highlight the substantial bene-
fits of CACC in enhancing traffic flow and reducing emissions, particularly at higher penetration rates. The
study underscores the importance of widespread adoption of CACC and calls for further research to explore
additional service combinations to optimise the potential of C-ITS for sustainable transportation.
1 INTRODUCTION
Conventional traffic management systems are increas-
ingly reaching their capacity limits due to the con-
tinuous rise in urban traffic volumes worldwide (Eu-
rostat, 2023). The increase in traffic volume has re-
sulted in longer journey times, a greater frequency
of stop-and-go movements, and an overall rise in en-
ergy consumption. These factors not only affect the
efficiency and sustainability of urban transportation
but also have a detrimental impact on the quality of
life of residents in these areas (Walch et al., 2024).
In response to these challenges, technologies that en-
hance traffic management through the use of connec-
tivity and automation, commonly known as Coopera-
tive Intelligent Transport Systems (C-ITS), are gain-
ing prominence (European Commission, 2016).
Among these technologies, Cooperative Adaptive
Cruise Control (CACC) and Green Light Optimal
Speed Advisory (GLOSA) aim to support enhancing
traffic efficiency and sustainability. CACC stabilises
a
https://orcid.org/0000-0001-6404-9813
b
https://orcid.org/0000-0001-7419-1506
traffic flow by enabling vehicles to coordinate speeds
and promptly respond to traffic changes, enhancing
driver comfort. GLOSA, on the other hand, optimises
intersection passage by advising drivers on speeds to
avoid unnecessary stops during traffic signal cycles.
Both technologies aim to improve traffic efficiency
while reducing emissions and fuel consumption by
promoting smoother driving.
While numerous studies have demonstrated the ef-
fectiveness of individual C-ITS services (see Section
2), research on their combined application is limited.
Walch et al. (2025) conducted a comprehensive liter-
ature review of 104 papers, highlighting this gap in
research and emphasizing the need for further stud-
ies. Therefore, this study seeks to bridge that gap
by investigating the impacts of GLOSA and CACC,
both individually and in combination, to determine
whether their joint implementation yields comple-
mentary, reinforcing, or conflicting effects. Addition-
ally, it aims to assess the advantages of simultaneous
use compared to isolated applications.
The paper is structured as follows: Section 2
presents related work on the individual impacts of
342
Walch, M., Clausnitzer, C. and Neubauer, M.
Towards Synergistic Effects of C-ITS Services: Assessing the Joint Impact of GLOSA and CACC on Traffic Efficiency and Sustainability.
DOI: 10.5220/0013207600003941
Paper published under CC license (CC BY-NC-ND 4.0)
In Proceedings of the 11th International Conference on Vehicle Technology and Intelligent Transport Systems (VEHITS 2025), pages 342-349
ISBN: 978-989-758-745-0; ISSN: 2184-495X
Proceedings Copyright © 2025 by SCITEPRESS – Science and Technology Publications, Lda.
GLOSA and CACC. Section 3 illustrates the applied
methodology while section 4 discusses the results of
the simulation studies and investigates the effect of
combining CACC and GLOSA.
2 RELATED WORK
The potential effects of GLOSA and CACC have been
the subject of numerous studies in the scientific liter-
ature.
GLOSA systems enhance traffic flow by optimis-
ing vehicle speed to reduce unnecessary stops. Kat-
saros et al. (2011) found that GLOSA can reduce
waiting times by up to 80% at a 50% penetration rate,
where the penetration rate corresponds to the propor-
tion of vehicles equipped with and using the relevant
C-ITS service. Multi-segment GLOSA, which opti-
mises flow across multiple traffic lights, has demon-
strated greater efficiency but poses more significant
implementation challenges (Khayyat et al., 2024).
Environmentally, GLOSA can decrease CO
2
emis-
sions by 9.9% at 100% penetration, alongside reduc-
tions in travel time (5.7%) and waiting time (18.2%)
(Lebre et al., 2015). Noise pollution can also be mit-
igated through reduced acceleration events (Umwelt-
bundesamt, 2024a).
CACC has been shown to improve traffic effi-
ciency and reduce environmental impact. Rios-Torres
and Malikopoulos (2017) demonstrated that highway
merging scenarios exhibit travel time reductions of
7–13%, coupled with up to 53% lower emissions.
HomChaudhuri et al. (2017) showed that these sys-
tems mitigate braking shockwaves and nearly elimi-
nate red light idling. Even at low penetration rates,
CACC achieves traffic flow stabilisation and emission
reductions (Wang et al., 2015). The environmental
benefits are also evident at low rate levels, with NO
x
emission reductions beginning at a 20% penetration
rate.
Kamal et al. (2015) investigated the impact of an
eco-driving system consisting of CACC and GLOSA,
and observed a 2% reduction in fuel consumption and
a 2.8% decrease in travel time with 10% vehicle pene-
tration. The system of Asadi and Vahidi (2011), com-
bining ACC with traffic light data resulted in CO
2
sav-
ings of up to 56%. Xin et al. (2018) expanded the ca-
pabilities of ACC by integrating V2X technology to
anticipate the onset of red lights leading to reduced
travel times (4.9%) and fuel consumption (25.5%).
Liu and El Kamel (2016) demonstrated that the in-
tegration of V2X into CACC systems resulted in an
improvement in traffic flow at intersections. To as-
sess the combined impacts of C-ITS services, Walch
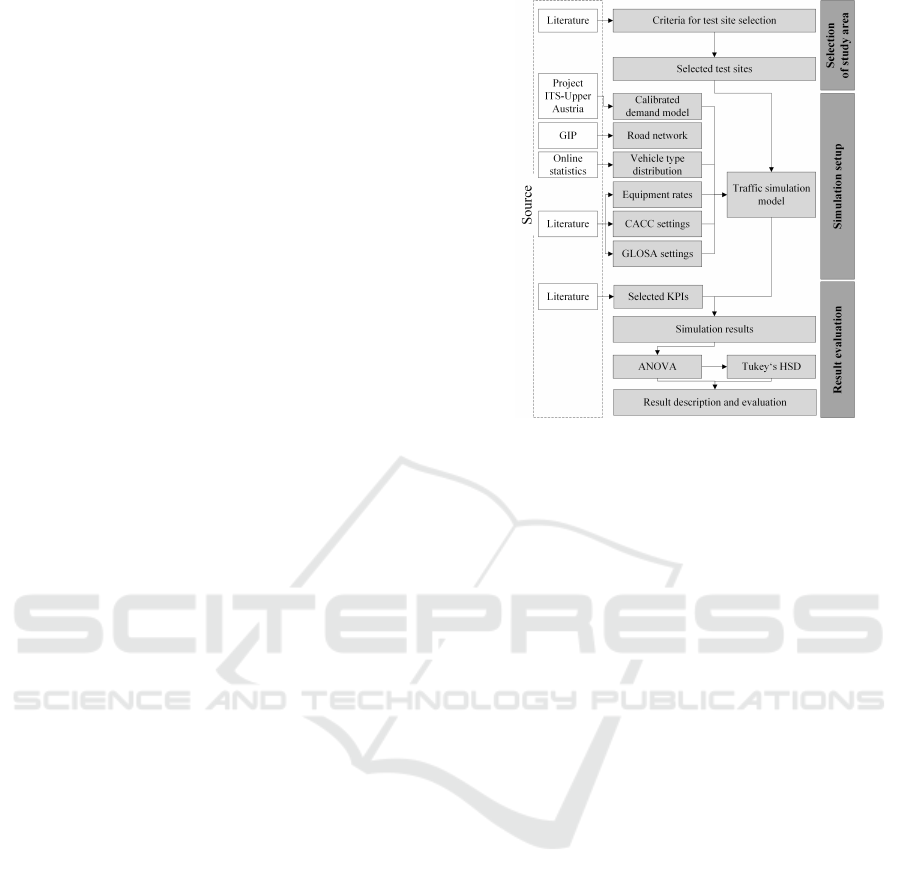
Figure 1: Methodology.
et al. (2024) proposed a qualitative impact evaluation
model using causal loop diagrams, demonstrating its
utility in analysing service combinations such as Road
Hazard Warning, Road Works Warning, Traffic Jam
Ahead Warning and Shockwave Dampening.
3 METHODOLOGY
This section builds upon the related work discussed
in Section 2 to present a framework for the simulative
assessment of the combined C-ITS services. Figure
1 illustrates the methodology employed in this study,
while the subsequent sections delve into the individ-
ual components in depth.
3.1 Selection of Study Area
The following sections outline the site selection crite-
ria and describe the chosen test sites.
3.1.1 Criteria for Test Site Selection
The selection of suitable test sites is essential for
effectively evaluating Intelligent Transport Systems
(ITS). To ensure a comprehensive evaluation, several
criteria were considered during the site selection pro-
cess. GLOSA, for instance, requires at least one traf-
fic light-controlled intersection, with test sites featur-
ing multiple traffic signals being particularly valuable.
Additionally, test sites must include sufficiently long
road segments to influence vehicle speed. Moreover,
different regional types, including urban and suburban
Towards Synergistic Effects of C-ITS Services: Assessing the Joint Impact of GLOSA and CACC on Traffic Efficiency and Sustainability
343

sections, were considered a key factor in site selec-
tion. Sites with available historical traffic data were
prioritized for simulation calibration and validation,
improving result accuracy.
In this study, the Travel Time Index (TTI) (INRIX,
2024) was used to identify relevant road sections. TTI
measures the ratio of the average travel time along a
route to the free-flow time, defined as the 15th per-
centile of observed travel times. By analyzing TTI
data, road segments with delays caused by high traf-
fic volumes were identified.
3.1.2 Description of Selected Test Sites
Three Austrian test sites were selected for the simula-
tion studies based on the criteria described.
The B1 test site spans approx. 12 km, starting at
the highway interchange and extending past Linz Air-
port. It is characterized by a predominantly straight,
two-lane road with 20 traffic signals placed between
400 and 1,000 meters apart, and a speed limit of 70
km/h. The B3 test site, located near Mauthausen,
covers a 3 km stretch connecting northeastern Up-
per Austria to Linz. This single-lane road features
two traffic signals that significantly impact traffic flow
during peak hours, with speed limits varying from
50 km/h at intersections to 100 km/h on other sec-
tions. The B139 test site extends 1.5 km from the
R
¨
omerbergtunnel as a western bypass of Linz city
center. This inner-city route, with a speed limit of 50
km/h, includes several curves and eight traffic signals,
leading to frequent braking and acceleration.
3.2 Simulation Setup
The following section outlines the process of creating
and calibrating the simulation model used to assess
the impact of GLOSA, CACC and their service com-
bination (SC).
3.2.1 SUMO Traffic Simulation Model
This study employs an adapted version of the SUMO
traffic simulation model from the ITS-Upper Austria
project (Presinger, 2021), incorporating a recalibrated
demand model based on traffic data collected over a
year. Thereby, data from induction loops and radar
sensors were utilised for calibration. Due to the un-
equal distribution of traffic volume on the individual
days of the week, only data from Tuesday to Thurs-
day were considered, and data from public holidays
and school holidays were excluded. Furthermore,
origin-destination (OD) matrices for the state of Up-
per Austria were employed in conjunction with the
Table 1: Traffic Simulation - R
2
values.
Test Site R
2
B1 0.9222
B3 0.9401
B139 0.6627
sensor data. The demand model was calibrated us-
ing SUMO’s routeSampler.py tool. The R
2
(Backhaus
et al., 2018) values for model calibration are presented
in Table 1, with sites B1 and B3 demonstrating high
quality and B139 exhibiting moderate quality.
3.2.2 Definition of Vehicle Type Distribution
The demand model initially only considered passen-
ger cars, but was updated with emission class data
derived from statistical distributions of drive tech-
nologies (Statistik Austria, 2024; Umweltbundesamt,
2024b).
3.2.3 Definition of Penetration Rates
A key parameter in assessing the impact of C-ITS is
the penetration rate. This allows investigating how the
impact intensifies as the number of users increases.
The rates chosen in this study are based on Rogers’
diffusion of innovations theory (Rogers, 2003) which
divides society into five groups of adopters: innova-
tors (2.5%), early adopters (13.5%), early majority
(34%), late majority (34%), and laggards (16%).
3.2.4 GLOSA Settings
This study used the GLOSA algorithm implemented
in SUMO (SUMO, 2025a). When defining the pa-
rameters for GLOSA, it is necessary to give particular
consideration to the recommended speed. Research
indicates that speeds around 50-60% of the limit do
not overly disrupt traffic while still maximising the
use of green lights (Eckhoff et al., 2013). Conse-
quently, the minimum speed on all three test routes
will be set to 55% of the speed allowed. With re-
gard to the maximum speed, the SUMO default value
(110% of speed limit) is assumed for all scenarios.
In addition, the activation distance is critical to
GLOSA’s efficiency. For a speed of 50 km/h, the opti-
mal activation point is approximately 350 m from the
traffic light (Katsaros et al., 2011). Shorter distances
hinder speed adjustments, increasing fuel consump-
tion and travel times. In cases of closer traffic light
spacing, the activation distance is reduced to 250 me-
ters to avoid communication issues (Katsaros et al.,
2011). For the B139 route with many traffic lights,
a 250 m activation distance is used, while for the B3
and B1 routes the distance is set at 500 m. The study
VEHITS 2025 - 11th International Conference on Vehicle Technology and Intelligent Transport Systems
344
uses single-segment GLOSA, offering speed recom-
mendations for the next traffic light only.
3.2.5 CACC Settings
This study uses the CACC model implemented in
SUMO, based on Milan
´
es and Shladover (2014), Xiao
et al. (2017), and Xiao et al. (2018). The model adapts
vehicle following behavior based on gap and speed
differences, regulated by four modes (speed control
mode, gap control mode, gap-closing mode and col-
lision avoidance mode). The study uses the default
CACC parameters, ensuring consistency with prior
research.
3.3 Result Evaluation
In the following section, the evaluation design em-
ployed in this study is described.
3.3.1 Selection of Impact Categories and KPIs
This study uses traffic efficiency and sustainability to
assess the impact of CACC and GLOSA, as both tech-
nologies aim to optimise traffic flow and reduce envi-
ronmental impact. The KPIs used include lost time
and CO
2
emissions to reflect the ability of the C-ITS
service to improve traffic flow and to measure the en-
vironmental benefits (SUMO, 2025b).
3.3.2 Statistical Evaluation
The simulations included three C-ITS services
(GLOSA, CACC, and SC), three test sites (see Sec-
tion 3.1.2), five penetration rates (see Section 3.2.3),
and ten different seed values. Additionally, simula-
tions were conducted without C-ITS on all test sites
to provide a basis for comparison, resulting in a total
of 480 simulation runs.
The results for each test route and penetration rate
combination were analyzed using an ANOVA to as-
sess whether the use of no C-ITS, GLOSA, CACC,
or SC had a statistically significant effect on lost time
and CO
2
emissions. If significant, Tukey’s HSD Post-
Hoc test was conducted for pairwise comparisons to
determine which factors exhibited statistically signif-
icant differences. This process allows for concrete
conclusions regarding the impacts of individual or
combined C-ITS services.
4 RESULTS
The following sections present the results of the sim-
ulation studies.
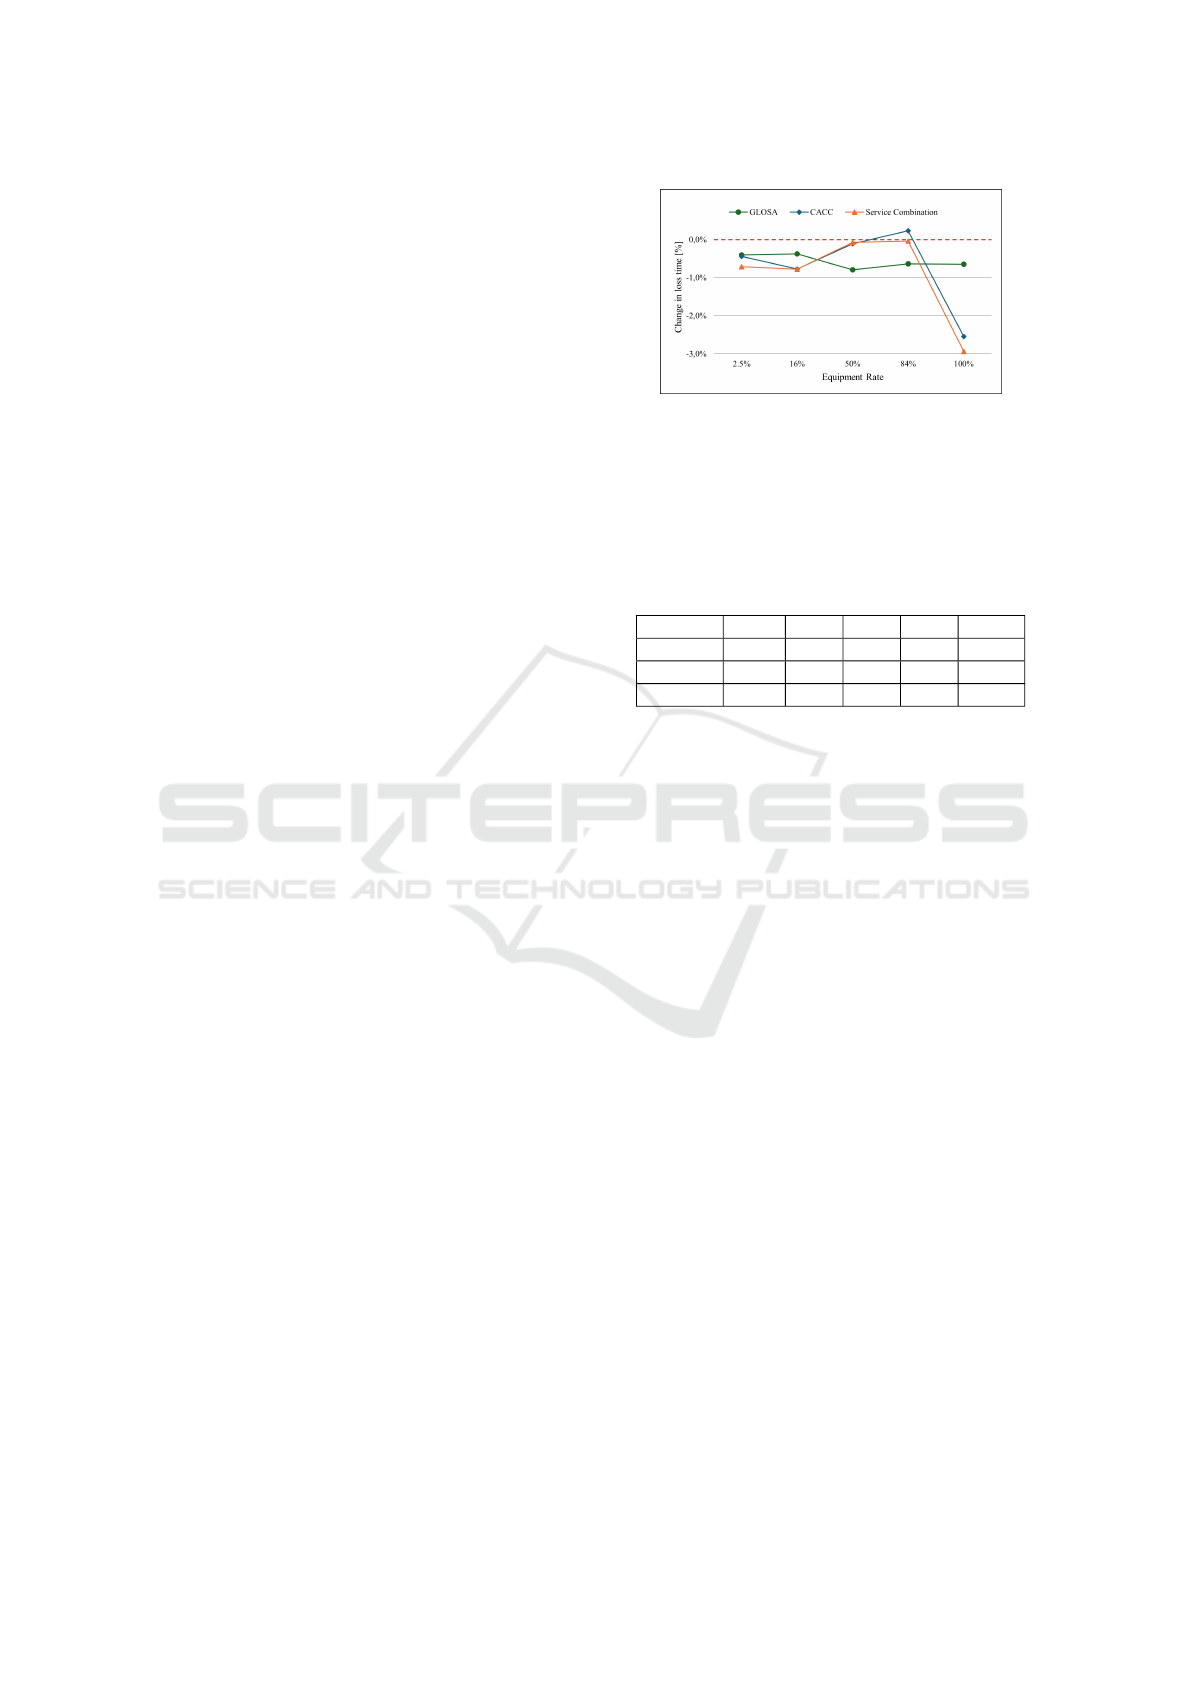
Figure 2: Results B1 - Loss Time.
4.1 Impact on Loss Time
The ANOVA results comparing loss time across the
scenarios (i) no C-ITS services, (ii) CACC, (iii)
GLOSA, and (iv) SC, are presented in Table 2.
Table 2: ANOVA p-Values - Loss Time.
Test Site 2.5% 16% 50% 84% 100%
B1 - - - - ***
B3 - *** *** *** ***
B139 *** *** *** *** ***
∗∗∗
≤ 0.001
∗∗
≤ 0.01
∗
≤ 0.05
The test site B1 shows that up to a penetration rate
of 84%, no statistically significant impact on loss time
is observed with any C-ITS service. Only at a pen-
etration rate of 100% does a significant impact oc-
cur. As shown in Figure 2, variations in loss time
compared to the baseline are observed at penetration
rates up to 84%, with GLOSA demonstrating a max-
imum improvement of 0.8% at 50% penetration. At
100%, CACC and SC exhibit more substantial reduc-
tions in loss time, with improvements of up to 2.5%
and nearly 3%, respectively. Notably, CACC and SC
exhibit slight increases in loss time at 50% and 84%
penetration rates, while GLOSA shows no significant
change in loss time at these levels.
Tukey’s HSD Post-Hoc test (Table 3) confirms
that, although GLOSA leads to improvements com-
pared to the baseline scenario (Figure 2), these are not
statistically significant. The combination of CACC
and GLOSA, however, results in statistically signifi-
cant reductions in loss time, with the effect of CACC
being the main contributor.
At test site B3, significant differences in loss time
are observed except at the 2.5% penetration rate (Ta-
ble 2), with the results presented in Figures 3 and 4.
At 2.5%, the changes are similar across all ser-
vices. Reductions in loss time are significant for
CACC and SC above 16% penetration, while GLOSA
shows marginal changes. The results of Tukey’s HSD
Post-Hoc test are similar to the test site B1 (see Table
4). Due to the very small changes in loss times with
GLOSA, the difference with the baseline scenario is
Towards Synergistic Effects of C-ITS Services: Assessing the Joint Impact of GLOSA and CACC on Traffic Efficiency and Sustainability
345
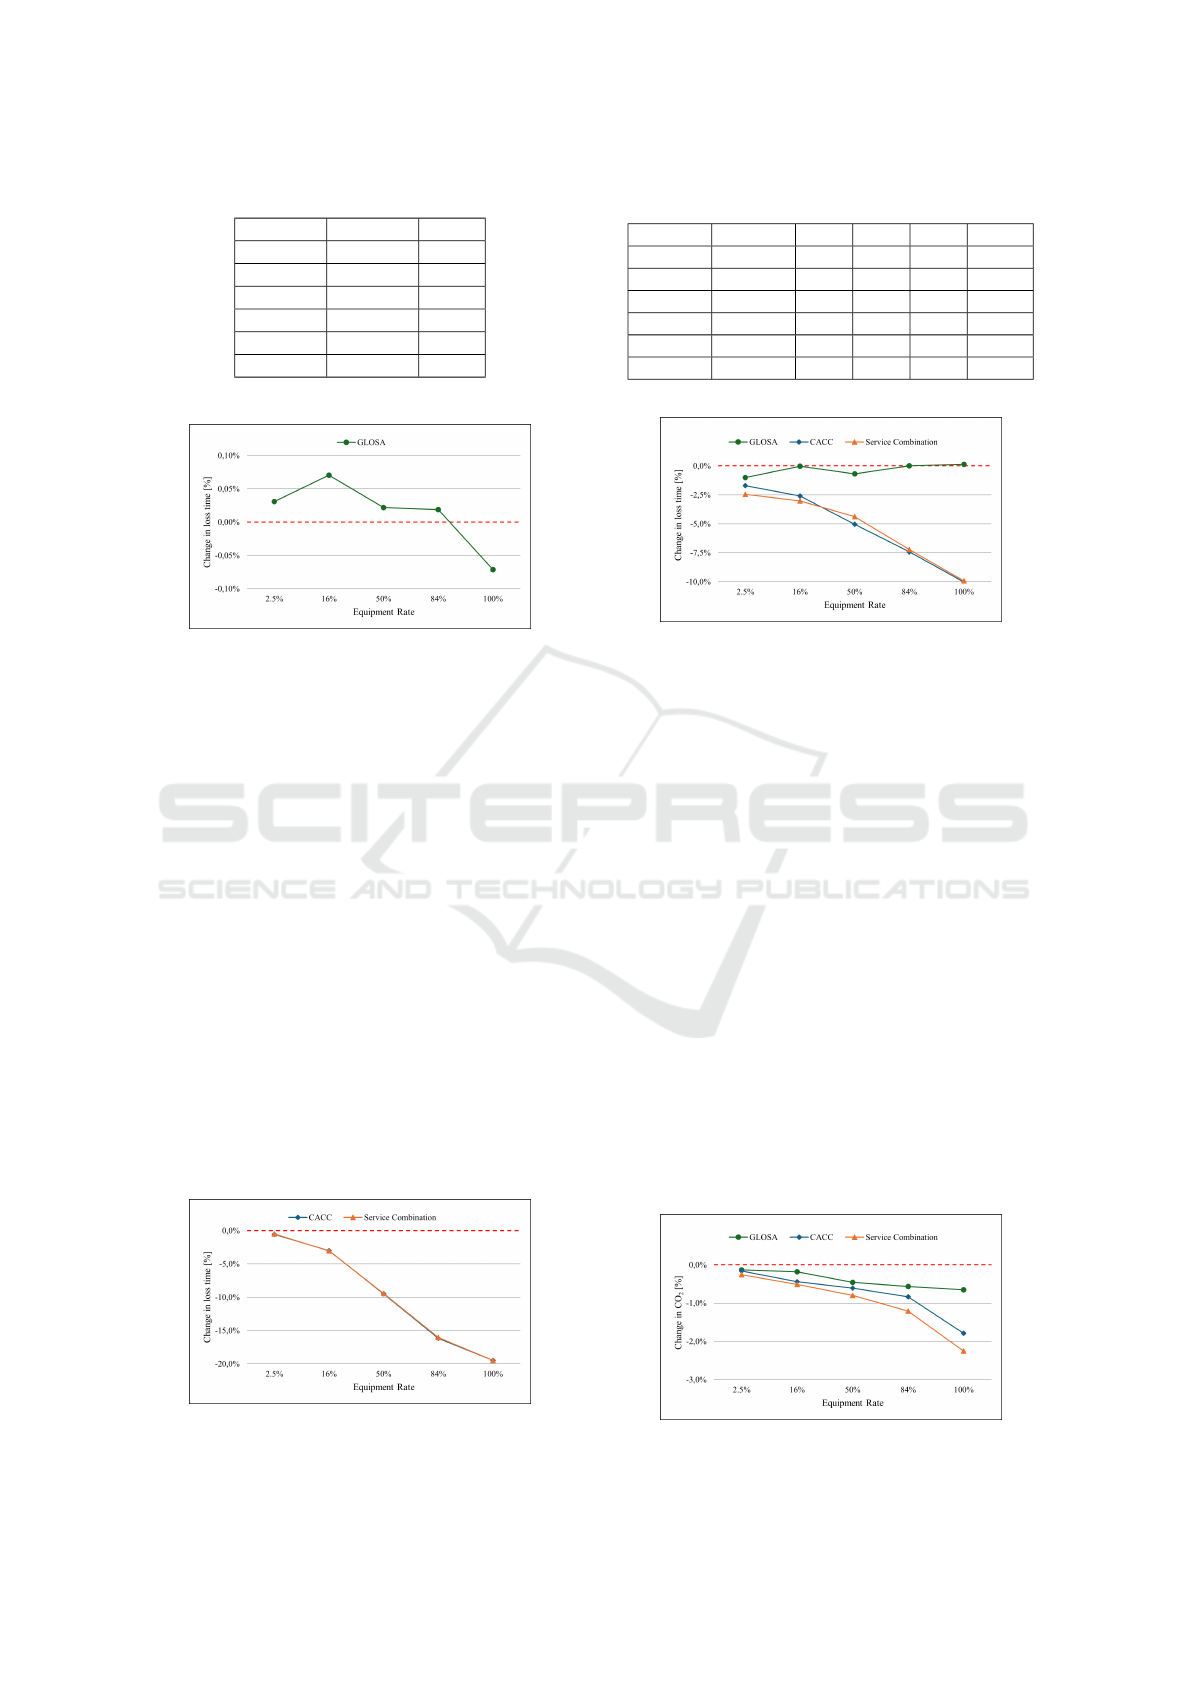
Table 3: B1 - Tukey’s HSD p-Values - Loss Time.
Service 1 Service 2 100%
- GLOSA -
- CACC ***
- SC ***
GLOSA CACC ***
GLOSA SC ***
CACC SC -
∗∗∗
≤ 0.001
∗∗
≤ 0.01
∗
≤ 0.05
Figure 3: Results B3 - Loss Time (GLOSA).
not significant. This marginal effect of GLOSA can
also be seen when looking at the differences between
CACC and SC, as they show almost identical results
in the reduction of lost time.
For test site B139, significant differences in loss
time are observed for all penetration rates (Table 2),
as illustrated in Figure 5.
Like B1 and B3, both CACC and SC exhibit a
reduction in loss time as penetration rates increase,
while GLOSA shows only marginal changes. Con-
sequently, Tukey’s HSD Post-Hoc test demonstrates
a pattern that is mostly analogous to that observed in
test locations B1 and B3. GLOSA does not result in
any notable enhancement in comparison to the base
scenario. With CACC, substantial differences from
the baseline scenario can be identified at relatively
low penetration rates, although the p-value of 2.5%
or 16% is lower than at higher penetration rates. SC
demonstrates a notable improvement in performance
compared to GLOSA alone, but not to CACC alone.
In conclusion, while GLOSA does not show sig-
nificant improvements compared to the baseline sce-
Figure 4: Results B3 - Loss Time (CACC & SC).
Table 4: B3 - Tukey’s HSD p-Values - Loss Time.
Serv. 1 Serv. 2 16% 50% 84% 100%
- GLOSA - - - -
- CACC *** *** *** ***
- SC *** *** *** ***
GLOSA CACC *** *** *** ***
GLOSA SC *** *** *** ***
CACC SC - - - -
∗∗∗
≤ 0.001
∗∗
≤ 0.01
∗
≤ 0.05
Figure 5: Results B139 - Loss Time.
nario at any of the test sites, CACC and SC both lead
to significant reductions in loss time. The comparison
between CACC and SC reveals no difference in their
performance, and adding GLOSA to CACC does not
result in further reductions in loss time.
4.2 Impact on Co
2
The ANOVA of CO
2
emissions across the four sce-
narios (i) no C-ITS services, (ii) CACC, (iii) GLOSA,
and (iv) SC, reveals statistically significant differ-
ences at penetration rates of 16% and higher for all
test sites, as shown in Table 6.
The detailed examination of CO
2
emissions for
test site B1, depicted in Figure 6, demonstrates that at
a 2.5% penetration rate, changes are minimal and not
statistically significant. However, with higher pen-
etration rates, a continuous decrease in emissions is
observed. The differences in the effectiveness of ser-
vices or combinations become more pronounced at
higher penetration rates.
Tukey’s HSD Post-Hoc test (Table 7) indicates
that from a 16% penetration rate, all services except
Figure 6: Results B1 - CO
2
.
VEHITS 2025 - 11th International Conference on Vehicle Technology and Intelligent Transport Systems
346
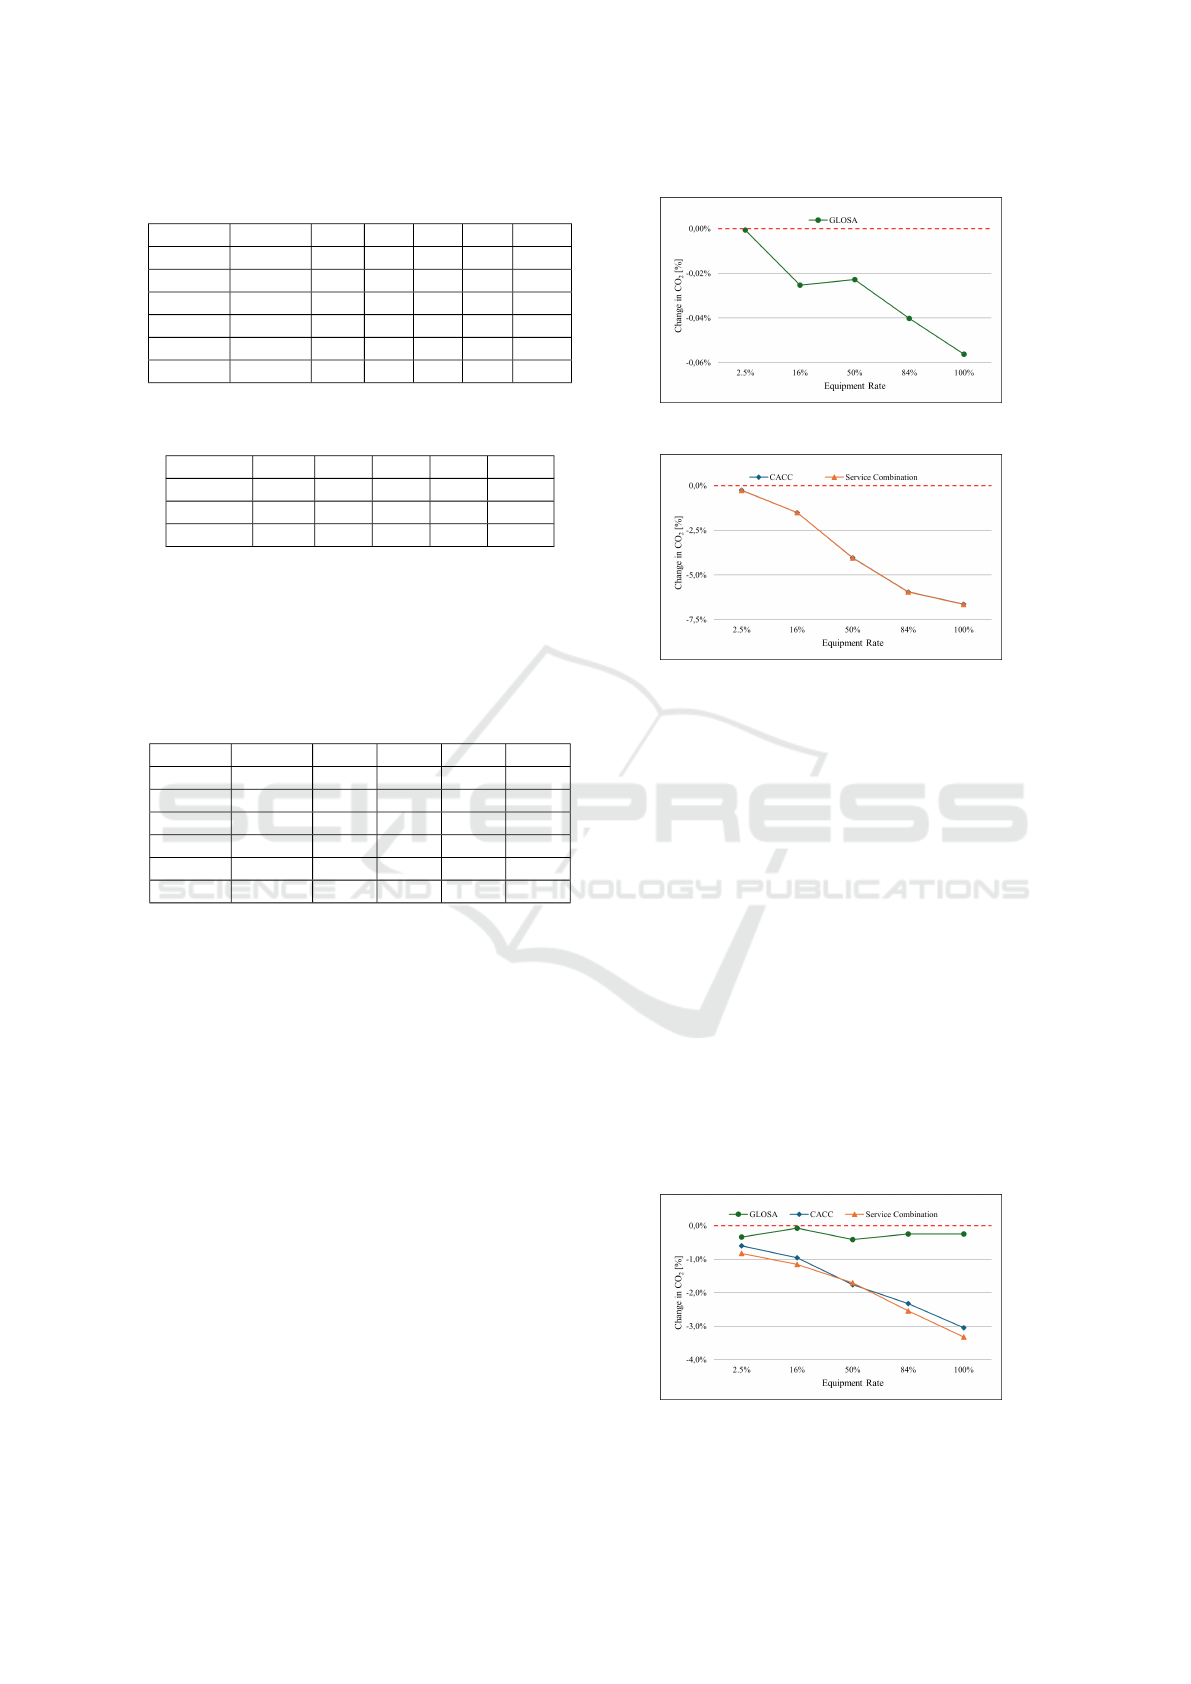
Table 5: B139 - Tukey’s HSD p-Values - Loss Time.
Serv. 1 Serv. 2 2.5% 16% 50% 84% 100%
- GLOSA - - - - -
- CACC * * *** *** ***
- SC *** ** *** *** ***
GLOSA CACC - * *** *** ***
GLOSA SC - ** *** *** ***
CACC SC - - - - -
∗∗∗
≤ 0.001
∗∗
≤ 0.01
∗
≤ 0.05
Table 6: ANOVA p-Values - CO
2
.
Test Site 2.5% 16% 50% 84% 100%
B1 - *** *** *** ***
B3 - *** *** *** ***
B139 ** *** *** *** ***
∗∗∗
≤ 0.001
∗∗
≤ 0.01
∗
≤ 0.05
GLOSA (at lower penetration rates) exhibit signifi-
cant reductions in emissions. SC performs signifi-
cantly better than GLOSA and CACC at 84% and
100% penetration rates. CACC only shows signifi-
cant differences from GLOSA at 100% penetration.
Table 7: B1 - Tukey’s HSD p-Values - CO
2
.
Serv. 1 Serv. 2 16% 50% 84% 100%
- GLOSA - ** *** ***
- CACC ** *** *** ***
- SC ** *** *** ***
GLOSA CACC - - - ***
GLOSA SC - * *** ***
CACC SC - - * **
∗∗∗
≤ 0.001
∗∗
≤ 0.01
∗
≤ 0.05
Similarly, for test site B3, the results show signif-
icant changes at a penetration rate of 16% and higher
(Table 6), but the impact of GLOSA is minimal in
comparison to CACC and SC. As demonstrated in
Figures 7 and 8, the emissions from CACC and SC
are almost identical, and the effect of GLOSA is neg-
ligible.
Tukey’s HSD test (Table 8) confirms that GLOSA
does not result in significant reductions compared to
the baseline, while CACC and SC both show substan-
tial differences from GLOSA and the baseline.
For B139, the ANOVA (Table 6) reveals that sig-
nificant reductions in CO
2
emissions are observed
even at 2.5% penetration rate for SC, and a contin-
uous decrease is seen for both CACC and SC. Figure
9 illustrates these trends.
Tukey’s HSD Post-Hoc test (see Table 9) again
shows that there is no statistical significance in the
change in CO
2
emissions between GLOSA and the
baseline simulation. The difference in the similar
curves between CACC and SC is also not statistically
significant. Therefore, as in B3, it can be assumed that
Figure 7: Results B3 - CO
2
(GLOSA).
Figure 8: Results B3 - CO
2
(CACC & SC).
the simultaneous use of CACC and GLOSA does not
lead to an improvement in CO
2
emissions compared
to the use of CACC alone.
4.3 Discussion
A comparison of our simulation results with those in
the literature reveals both similarities and key differ-
ences due to varying contexts, scales, and parameters.
The simulations for CACC showed a significant re-
duction in loss time and CO
2
emissions at penetra-
tion rates as low as 16% for test sites B3 and B139.
This is consistent with the findings of Rios-Torres and
Malikopoulos (2017), who demonstrated reductions
in travel times by 7-13% and CO
2
emissions by up
to 53%. However, Rios Torres’ study focused primar-
ily on highway conditions, while our simulations cov-
ered a mix of urban and suburban environments. The
magnitude of improvements observed in our study
suggests that CACC’s benefits in more complex ur-
Figure 9: Results B139 - CO
2
.
Towards Synergistic Effects of C-ITS Services: Assessing the Joint Impact of GLOSA and CACC on Traffic Efficiency and Sustainability
347
Table 8: B3 - Tukey’s HSD p-Values - CO
2
.
Serv. 1 Serv. 2 16% 50% 84% 100%
- GLOSA - - - -
- CACC *** *** *** ***
- SC *** *** *** ***
GLOSA CACC *** *** *** ***
GLOSA SC *** *** *** ***
CACC SC - - - -
∗∗∗
≤ 0.001
∗∗
≤ 0.01
∗
≤ 0.05
Table 9: B139 - Tukey’s HSD p-Values - CO
2
.
Serv. 1 Serv. 2 2.5% 16% 50% 84% 100%
- GLOSA - - - - -
- CACC - * *** *** ***
- SC ** ** *** *** ***
GLOSA CACC - * *** *** ***
GLOSA SC - ** *** *** ***
CACC SC - - - - -
∗∗∗
≤ 0.001
∗∗
≤ 0.01
∗
≤ 0.05
ban settings are still present but somewhat diminished
compared to controlled highway scenarios.
In contrast, the performance of GLOSA in our
study did not yield significant improvements in most
cases, even at higher penetration rates. This result
differs from Katsaros et al. (2011), who reported up
to an 80% reduction in waiting times at intersections
under ideal conditions, such as single-segment opti-
mization of traffic lights. The limited improvements
in our study can likely be attributed to the use of real-
world traffic data, which spanned multiple intersec-
tions with diverse traffic conditions. Moreover, Le-
bre et al. (2015) observed CO
2
reductions of up to
9.9% with 100% GLOSA penetration, while our re-
sults showed only modest reductions, typically below
1%. This discrepancy may be due to the fact that
Lebre’s study focused on intersections, whereas our
test sites involved multi-kilometre roads, with traffic
light-controlled intersections representing a smaller
proportion of the total area. The limited impact of
GLOSA, particularly at test site B3, may explain the
small improvements observed. Overall, while the re-
sults of our study may not be directly comparable to
previous works due to differences in experimental set-
tings (e.g., test sites, simulation parameters, traffic
volumes, C-ITS implementations), our findings align
with the general trend in the literature. They suggest
that C-ITS, particularly CACC, can improve traffic ef-
ficiency and sustainability, albeit with varying effec-
tiveness depending on the conditions of the study.
5 CONCLUSION
This study provides insights into the impact of C-ITS
on traffic efficiency and sustainability. By examining
the performance of CACC and GLOSA, both individ-
ually and in combination, across different penetration
rates, this research contributes to understanding how
these systems influence loss time and CO
2
emissions.
The results demonstrate that CACC mostly yields
significant improvements in both loss time and CO
2
emissions at penetration rates of 16% and above. In
contrast, GLOSA shows improvements in both loss
time and CO
2
emissions compared to a non-use of
C-ITS, however, the effects of GLOSA mostly re-
main statistically insignificant. The combined use of
CACC and GLOSA shows marginal improvements
over CACC alone but does not produce statistically
significant differences in loss time at any of the test
sites. This suggests that while GLOSA may com-
plement CACC to some extent in reducing emissions
and loss time, it does not drastically enhance traf-
fic efficiency or sustainability. The results also indi-
cate that the effectiveness of both systems mostly in-
creases with higher penetration rates, highlighting the
importance of widespread adoption to fully leverage
the benefits of these technologies.
In conclusion, this study highlights the impor-
tance of CACC as a tool for enhancing traffic flow
and reducing emissions. It presents a methodological
framework for evaluating individual C-ITS services
as well as their combinations, and examines their var-
ied impacts across different categories. Additionally,
it proposes an approach for testing combinations of
C-ITS services. Future research could further inves-
tigate the integration of additional C-ITS services to
maximise the potential of cooperative driving tech-
nologies for sustainable and efficient transportation.
ACKNOWLEDGEMENTS
The work leading to the results was funded by the
State of Upper Austria within the project SUBSTAN-
TIATE (grant no. 895978), managed by the Austrian
Research Promotion Agency (FFG).
REFERENCES
Asadi, B. and Vahidi, A. (2011). Predictive cruise control:
Utilizing upcoming traffic signal information for im-
proving fuel economy and reducing trip time. IEEE
Trans. on Control Systems Techn., 19(3):707–714.
VEHITS 2025 - 11th International Conference on Vehicle Technology and Intelligent Transport Systems
348

Backhaus, K., Erichson, B., Plinke, W., and Weiber, R.
(2018). Multivariate Analysemethoden. Springer
Berlin Heidelberg, Berlin/Heidelberg, 15 edition.
Eckhoff, Halmos, and German (2013). Potentials and limi-
tations of green light optimal speed advisory systems.
IEEE Vehicular Networking Conference.
European Commission (2016). A european strategy on co-
operative intelligent transport systems, a milestone to-
wards cooperative, connected and automated mobility.
Eurostat (2023). Statistics — eurostat: Stock of ve-
hicles by category and nuts 2 regions. url:
https://ec.europa.eu/eurostat/databrowser/view/
tran r vehst/default/table?lang=en. accessed:
18.10.2024.
HomChaudhuri, B., Vahidi, A., and Pisu, P. (2017). Fast
model predictive control-based fuel efficient control
strategy for a group of connected vehicles in urban
road conditions. IEEE Transactions on Control Sys-
tems Technology, 25(2):760–767.
INRIX (2024). Data and metrics definitions. url:
https://docs.inrix.com/ra/dataandmetrics/. accessed:
15.01.2025.
Kamal, M. A. S., Taguchi, S., and Yoshimura, T. (2015). In-
tersection vehicle cooperative eco-driving in the con-
text of partially connected vehicle environment. In
2015 IEEE 18th Int. Conference on Intelligent Trans-
portation Systems, pages 1261–1266. IEEE.
Katsaros, Kernchen, Dianati, and Rieck (2011). Perfor-
mance study of a green light optimized speed advisory
(glosa) application using an integrated cooperative its
simulation platform. International Wireless Commu-
nications & Mobile Computing Conference.
Khayyat, M., Gabriele, A., Mancini, F., Arrigoni, S., and
Braghin, F. (2024). Enhanced traffic light guidance for
safe and energy-efficient driving: A study on multiple
traffic light advisor (mtla) and 5g integration. Journal
of Intelligent & Robotic Systems, 110(2).
Lebre, M.-A., Le Mou
¨
el, F., M
´
enard, E., Garnault, A.,
Brada
¨
ı, B., and Picron, V. (2015). Real scenario and
simulations on glosa traffic light system for reduced
co2 emissions, waiting time and travel time.
Liu, B. and El Kamel, A. (2016). V2x-based decentralized
cooperative adaptive cruise control in the vicinity of
intersections. IEEE Transactions on Intelligent Trans-
portation Systems, 17(3):644–658.
Milan
´
es, V. and Shladover, S. E. (2014). Modeling coopera-
tive and autonomous adaptive cruise control dynamic
responses using experimental data. Transportation
Research Part C: Emerging Technologies, 48:285–
300.
Presinger, C. (2021). Calibration and validation of meso-
scopic traffic flow simulation. PhD thesis, Technical
University Graz.
Rios-Torres, J. and Malikopoulos, A. A. (2017). Auto-
mated and cooperative vehicle merging at highway
on-ramps. IEEE Transactions on Intelligent Trans-
portation Systems, 18(4):780–789.
Rogers, E. M. (2003). Diffusion of innovations. Free Press,
New York, 5th ed. edition.
Statistik Austria (2024). Kfz-bestand. url:
https://www.statistik.at/statistiken/tourismus-und-
verkehr/fahrzeuge/kfz-bestand. accessed: 18.10.2024.
SUMO (2025a). Glosa - sumo documentation. url:
https://sumo.dlr.de/docs/simulation/glosa.html.
accessed: 15.01.2025.
SUMO (2025b). Tripinfo - sumo documentation.
url: https://sumo.dlr.de/docs/simulation/output/ trip-
info.html. accessed: 15.01.2025.
Umweltbundesamt (2024a). Straßenverkehrsl
¨
arm. url:
https://www.umweltbundesamt.de/themen/laerm/
verkehrslaerm/strassenverkehrslaerm#larmsanierung-
larmschutz-an-bestehenden-strassen. accessed:
18.10.2024.
Umweltbundesamt (2024b). Umwelt - bestand am
1. januar 2024 nach umwelt-merkmalen. url:
https://www.kba.de/de/statistik/fahrzeuge/bestand/
umwelt/2024/2024 umwelt uebersicht.html. ac-
cessed: 18.10.2024.
Walch, M., Neubauer, M., Schildorfer, W., and Schirrer, A.
(2024). Modelling interrelations between c-its impact
categories: a system-dynamics approach using causal
loop diagrams. European Transport Research Review,
16(3):1–27.
Walch, M., Schirrer, A., and Neubauer, M. (2025). Im-
pact assessment of cooperative intelligent transport
systems (c-its) - a structured literature review. Euro-
pean Transport Research Review.
Wang, Z., Chen, X., Ouyang, Y., and Li, M. (2015). Emis-
sion mitigation via longitudinal control of intelligent
vehicles in a congested platoon. Computer-Aided
Civil and Infrastructure Engineering, 30(6):490–506.
Xiao, L., Wang, M., Schakel, W., and van Arem, B.
(2018). Unravelling effects of cooperative adaptive
cruise control deactivation on traffic flow characteris-
tics at merging bottlenecks. Transportation Research
Part C: Emerging Technologies, 96:380–397.
Xiao, L., Wang, M., and van Arem, B. (2017). Realistic
car-following models for microscopic simulation of
adaptive and cooperative adaptive cruise control ve-
hicles. Transportation Research Record: Journal of
the Transportation Research Board, 2623(1):1–9.
Xin, Q., Fu, R., Yuan, W., Liu, Q., and Yu, S. (2018). Pre-
dictive intelligent driver model for eco-driving using
upcoming traffic signal information. Physica A: Sta-
tistical Mechanics and its Applications, 508:806–823.
Towards Synergistic Effects of C-ITS Services: Assessing the Joint Impact of GLOSA and CACC on Traffic Efficiency and Sustainability
349
