
Towards Impact Assessment of Cooperative Routing on Traffic
Efficiency: A System Dynamics Approach
Manuel Walch
a
and Matthias Neubauer
b
Logistikum - Department of Logistics Management, University of Applied Sciences Upper Austria,
Wehrgrabengasse 1-3, 4400 Steyr, Austria
Keywords:
Cooperative Intelligent Transport System, Cooperative Routing, Impact Assessment, System Dynamics.
Abstract:
The proliferation of connected vehicles and Cooperative Intelligent Transport Systems (C-ITS) introduces
novel opportunities for enhancing various aspects in traffic (e.g., efficiency, sustainability, safety). As C-ITS
gains prominence, evaluating its impact requires comprehensive impact assessment studies. While micro-
scopic simulators and Agent-based Models (ABM) dominate C-ITS evaluations, this paper adopts an alterna-
tive approach, utilizing System Dynamics (SD) to assess the impact of Cooperative Routing (CR) on traffic
efficiency. Thereby a Stock-Flow Model (SFM) is developed, considering parameters such as equipment rates,
delay thresholds, and route update intervals. Results indicate that even a low equipment rate (25%) signifi-
cantly improves traffic efficiency. However, high equipment rates with prolonged route update intervals intro-
duce challenges, causing route overloads and increased delays. These effects are consistent with the current
literature on CR using ABM. Furthermore, this study suggests possibilities for model extensions, including
predictive rerouting, alternative rerouting criteria, and consideration of sustainability impacts. Overall, these
findings contribute to further development in the direction of cooperative connected and automated mobility.
1 INTRODUCTION
In recent years, the automotive landscape has wit-
nessed a surge in the integration of sensors and com-
munication technology capabilities in vehicles, facil-
itating data collection and inter-vehicle communica-
tion (Lu et al., 2014). With more than 100 million
connected vehicles expected to be on the road, an op-
portunity arises to address traffic-related challenges
and enhance overall traffic efficiency (Statista, 2023;
European Commission, 2016). The potential for inter-
vehicle communication creates opportunities for the
development of innovative services designed to en-
hance traffic conditions. These services are referred
to as Cooperative Intelligent Transport Systems (C-
ITS). One such service, Cooperative Routing (CR),
enables vehicles to share trip information, allowing
others to optimize routes based on predefined criteria.
Impact assessments of C-ITS frequently employ
microscopic traffic simulators and agent-based mod-
eling (ABM) to evaluate traffic efficiency, sustainabil-
ity or safety (Pribyl et al., 2020; Soon et al., 2019; Wu
et al., 2019; Agriesti et al., 2020). A literature review
a
https://orcid.org/0000-0001-6404-9813
b
https://orcid.org/0000-0001-7419-1506
by Walch et al. (2025) highlights the dominance of
these methods in C-ITS studies. While ABM is well-
suited for evaluations of vehicle interactions and traf-
fic dynamics, it may not always be necessary to sim-
ulate traffic at such granularity. A viable alternative
are System Dynamics (SD) models, offering a higher
level of abstraction and proving useful in capturing
feedback effects, a critical aspect for C-ITS. Addi-
tionally SD facilitates scenario testing as it is less re-
source intensive than ABM. This allows for the rapid
and flexible assessment of parameter configurations
and the evaluation of their impact on multiple impact
categories. Therefore, this work introduces a SD ap-
proach utilizing Stock-Flow Models (SFM) as a tool
to assess the impact of a simple CR application across
different scenarios, with a focus on traffic efficiency.
This paper is structured as follows: Section 2 ex-
plains the methodology applied. Section 2.1 outlines
the model concept, followed by the development of a
SFM and its rerouting logic in Section 2.2. Section
3 defines scenarios with varying parameters and com-
pares simulation outcomes, including findings from
recent ABM studies. The paper concludes with key
insights, limitations, and future research directions for
using SD in C-ITS impact assessments.
350
Walch, M. and Neubauer, M.
Towards Impact Assessment of Cooperative Routing on Traffic Efficiency: A System Dynamics Approach.
DOI: 10.5220/0013207800003941
In Proceedings of the 11th International Conference on Vehicle Technology and Intelligent Transport Systems (VEHITS 2025), pages 350-357
ISBN: 978-989-758-745-0; ISSN: 2184-495X
Copyright © 2025 by Paper published under CC license (CC BY-NC-ND 4.0)

2 METHODOLOGY
System Dynamics (SD) is an interdisciplinary ap-
proach to modeling the dynamic behavior of com-
plex systems over time, focusing on feedback loops
and interdependencies rather than isolated variable
relationships (Forrester, 1969). It starts with qual-
itative Causal Loop Diagrams (CLDs) to visualise
variable interactions and progresses to quantitative
SFMs by classifying variables as stocks (levels), flows
(rates), auxiliaries and parameters, and incorporating
the causal links identified from the CLDs (Breite-
necker et al., 2008).
In this paper the principle of SD is applied to the
context of Intelligent Transport Systems. A C-ITS
service known as Cooperative Routing (CR) will be
modelled using a SD approach to test the impacts
of different parameter configurations on traffic effi-
ciency. To this end, a model concept was first devel-
oped, which was used to create a quantitative SFM
based on a qualitative CLD. The modelling process
for developing the simulation model is described in
more detail in the following sections.
2.1 Model Concept
CR is a C-ITS service enabling vehicles to dy-
namically adjust routes using real-time traffic data
shared between vehicles and infrastructure. This ser-
vice optimizes routing recommendations based on
criteria such as minimizing delays or travel times,
thereby approaching a system optimal equilibrium
state (Wardrop, 1952). In this study, CR is applied to
a simple scenario where vehicles travel from a source
to a target area, choosing among three route options
(Figure 1).
Figure 1: Model Concept – Cooperative Routing.
In the Base Scenario (without CR), vehicles fol-
low a predefined route based on individual prefer-
ences or typical traffic patterns. The baseline daily
traffic volumes for these routes reflect real-world data
from EVIS.AT (2024). CR introduces the ability for
equipped vehicles to reroute dynamically when de-
lays are detected, improving traffic distribution and
reducing congestion. The model incorporates the con-
cept of an equipment rate, representing the propor-
tion of vehicles equipped with C-ITS technology and
therefore capable of utilizing CR. Equipped vehicles
adjust their routes in real time according to the rerout-
ing logic, while unequipped vehicles continue along
their initially selected paths, unaffected by rerouting
recommendations.
In order to avoid excessive complexity in the
model and to be able to transfer the concept to a sys-
tem dynamics model, the following simplifying as-
sumptions were made:
• Perfect Information: Assumes accurate real-
time traffic information with no errors, outliers,
or communication delays, and therefore accurate
rerouting recommendations.
• 100% Compliance Rate: Assumes all vehicles
follow rerouting recommendations.
• No Additional Flows: Assumes routes have no
additional in- and outflows, except for the source
and target areas.
• No Subsequent Route Changes: Assumes once
a vehicle selects a route, it cannot be altered along
the way.
2.2 Development of the Stock-Flow
Model (SFM)
The model development began with a CLD based by
the research of Walch et al. (2024), which examined
impact propagation and rebound effects across vari-
ous impact categories of C-ITS services. A modi-
fied and condensed version of the CLD from Walch
et al. (2024) was then converted into a SFM using
VENSIM. A universal structure for vehicle flow and
Key Performance Indicator (KPI) calculation was de-
signed to apply to all three route options. The model
was further enhanced with a rerouting logic based
on computed KPI values, specifically using the de-
lay rerouting criterion. The finalized, comprehensive
model is detailed in the Annex (see Figure 8).
2.2.1 Basic Structure – Route Options
The SFM, shown in Figure 2 for Route Option 1, pro-
vides a standardized structure applicable to all route
options. Vehicles enter the queue based on Input Data
derived from daily traffic volume measurements, with
inflow calculated using both input data and traffic vol-
ume exceeding route capacity.
Vehicles in the queue make route decisions based
on a rerouting criterion, and the respective number of
vehicles depending on the C-ITS EQUIPMENT RATE
will be rerouted. Route departure from the queue is
Towards Impact Assessment of Cooperative Routing on Traffic Efficiency: A System Dynamics Approach
351
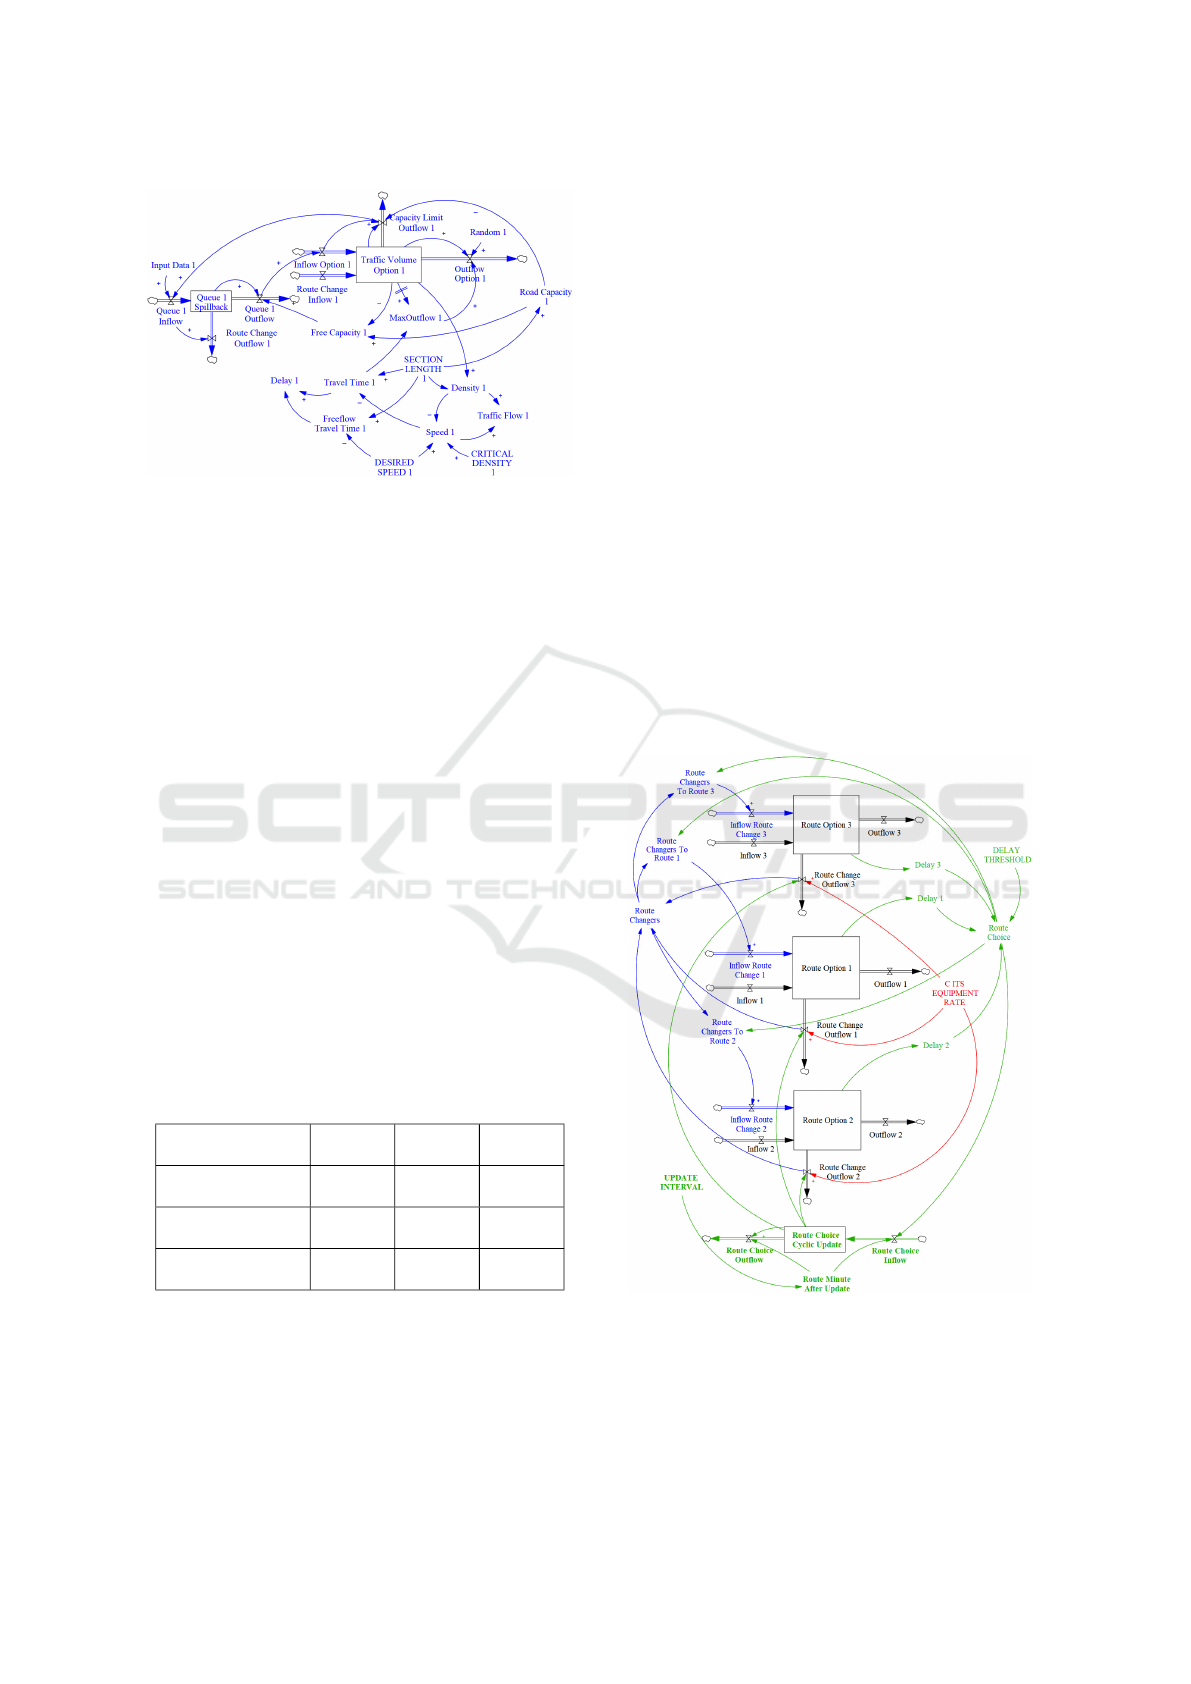
Figure 2: Basic Stock-Flow Model - Route Variants.
determined by the outflow equation of Queue 1 Out-
flow, ensuring it aligns with available road capacity on
the intended route based on the traffic volume in the
queue. The stock Traffic Volume represents vehicles
actively traveling, with outflows accounting for des-
tinations reached or capacity constraints. Traffic effi-
ciency Key Performance Indicators (KPIs) are calcu-
lated using Traffic Volume and fundamental diagram
equations. Density is derived from Traffic Volume
and SECTION LENGTH, while traffic Speed is cal-
culated using Density, DESIRED SPEED, and CRIT-
ICAL DENSITY via Drake’s equation (Drake et al.,
1966). Traffic Flow is computed as the product of
Speed and Density, while Travel Time incorporates
SECTION LENGTH and Speed. To prevent infinite
travel times, a minimum speed threshold of 0.83 m/s
(3 km/h) is applied. Delay, calculated by subtracting
Freeflow Travel Time from Travel Time, serves as in-
put for the routing logic.
The SFM applies uniformly across all routes, with
default parameter values outlined in Table 1. These
defaults allow for dynamic parameter adjustment dur-
ing simulations, enabling sensitivity analysis and sce-
nario testing.
Table 1: Default Values - Basic Structure Parameters.
Parameter Route
Option 1
Route
Option 2
Route
Option 3
SECTION
LENGTH [m]
4,000 6,000 8,000
DESIRED SPEED
[m/s]
27.78 27.78 27.78
CRITICAL
DENSITY [veh/m]
0.035
1
0.035
1
0.035
1
1
Parameter value was selected, to set the maximum
traffic flow to 2,100 veh/h (Rodrigue, 2020).
2.2.2 Rerouting Logic
The rerouting logic of the SFM, depicted in Figure 3,
builds on the structure outlined in Figure 2. For clar-
ity, the SFM structures for each route option are ab-
breviated, with each rectangle labeled ”route option”
representing a complete SFM as shown in Figure 2,
highlighting only the most important in- and outflows.
The logic compares Delays between route options
to select the one with the lowest delay (Route Choice).
A DELAY THRESHOLD is incorporated to prevent
rerouting for minor Delays, ensuring rerouting occurs
only when the threshold is exceeded. To stabilize fre-
quent route fluctuations, a cyclic update mechanism,
represented by the stock Route Choice Cyclic Update,
enforces a fixed interval (UPDATE INTERVAL) dur-
ing which the selected route remains constant.
Rerouting calculations consider the proportion of
vehicles equipped with C-ITS (C-ITS EQUIPMENT
RATE) and are based on the route determined by the
cyclic update mechanism. Vehicles are rerouted only
from routes not selected by the Route Choice calcula-
tions. For example, if option 1 is selected, C-ITS-
equipped vehicles originally destined for options 2
and 3 are redirected to option 1, while vehicles al-
ready assigned to option 1 remain. The aggregated re-
sult, representing all vehicles to be rerouted, is stored
in the variable Route Changers.
Figure 3: Rerouting Logic - Simplified View.
Default values for the parameters (C-ITS EQUIP-
MENT RATE, Delay Threshold, Update Interval) are
set to 0 but can be dynamically modified during sim-
ulations. Combining the basic SFM for each route
VEHITS 2025 - 11th International Conference on Vehicle Technology and Intelligent Transport Systems
352

Figure 4: Results - Base Scenario.
option (Figure 2) with the rerouting logic (Figure 3)
results in the complete SFM for CR (compare Figure
8 in the Annex).
3 RESULTS
The described SFM was implemented in VENSIM
and served as the basis for assessing the impact of
CR. A series of scenarios, each with unique parameter
configurations, were systematically defined, tested,
and analyzed. The results from these tests are detailed
and compared in the subsequent subsections.
3.1 Base Scenario
The simulation results for the Base Scenario, where
no rerouting occurs and vehicles follow their assigned
routes, are summarized in Figure 4. Default parame-
ters were applied, with the simulation covering one
full day (1,440 minutes). The figure highlights traffic
efficiency KPIs, including Traffic Volume and Delay.
The traffic patterns reveal notable peaks: route op-
tion 1 experiences a morning surge in Traffic Volume,
while route option 3 has an evening peak. Route op-
tion 2 shows a smaller morning peak but a signifi-
cant evening increase. Based on calculations using
the fundamental diagram, it can be inferred that these
peaks correspond to reduced Speeds, resulting in in-
creased Travel Times and significant Delays. For in-
stance, Delays exceed 1,000 seconds (16.6 minutes)
on route option 1 in the morning and 1,400 seconds
(23.3 minutes) on route option 2 in the evening.
Overall, the results depict high Traffic Volumes ex-
perienced by each route at specific simulation inter-
vals, suggesting potential traffic efficiency improve-
ments through strategic rerouting. Subsequent sec-
tions delve into scenarios featuring different parame-
ter settings designed to explore rerouting effects.
3.2 Scenario I
In Scenario I, a C-ITS EQUIPMENT RATE of 25%
was applied, meaning a quarter of all vehicles on all
routes were rerouted to the route with the lowest delay
(Route Choice Cyclic Update). The following param-
eters were used:
• C-ITS EQUIPMENT RATE: 25%
• DELAY THRESHOLD: 0 seconds
• UPDATE INTERVAL: 0 minutes
The results, depicted in Figure 5, demonstrate sig-
nificant improvements in traffic efficiency. Traffic
Volume was distributed more evenly across all three
route options, with only one peak in the evening.
As a result, Delays saw substantial reductions com-
pared to the Base Scenario. Morning peak Delays
were nearly eliminated, dropping to under 15 seconds,
while evening peak Delays for all routes were reduced
to less than 105 seconds (1.75 minutes), compared to
23.3 minutes in the Base Scenario.
The route change graphs highlight dynamic alter-
nations in route choices, driven by the redistribution
of Traffic Volumes. Early in the simulation, route op-
tion 1 was selected continuously for approximately 70
minutes, but thereafter frequent alternations occurred,
ensuring balanced Delays. When vehicles rerouted to
a specific route increased its Traffic Volume and Den-
sity, leading to higher Travel Times and Delays, an-
other route was selected in the subsequent time step.
Rerouting was performed every minute, even when
Delays were minimal, as shown in the Delay and
Route Changers graphs for the first 800 minutes. In
summary, it is observed that a relatively low C-ITS
EQUIPMENT RATE of 25% already leads to signifi-
cant improvements in traffic efficiency. However, as
will be discussed in Section 3.4, further increases in
the C-ITS EQUIPMENT RATE do not necessarily cor-
respond to improvements in traffic efficiency.
3.3 Scenario II
Scenario II builds on the setup of Scenario I with a
C-ITS EQUIPMENT RATE of 25%, but introduces
additional conditions: a DELAY THRESHOLD of 60
seconds, ensuring rerouting only occurs when the De-
lay on an unchosen route exceeds this threshold, and
an UPDATE INTERVAL of 5 minutes, where Route
Choice Cyclic Update is updated only at these inter-
vals. The applied parameters are:
Towards Impact Assessment of Cooperative Routing on Traffic Efficiency: A System Dynamics Approach
353
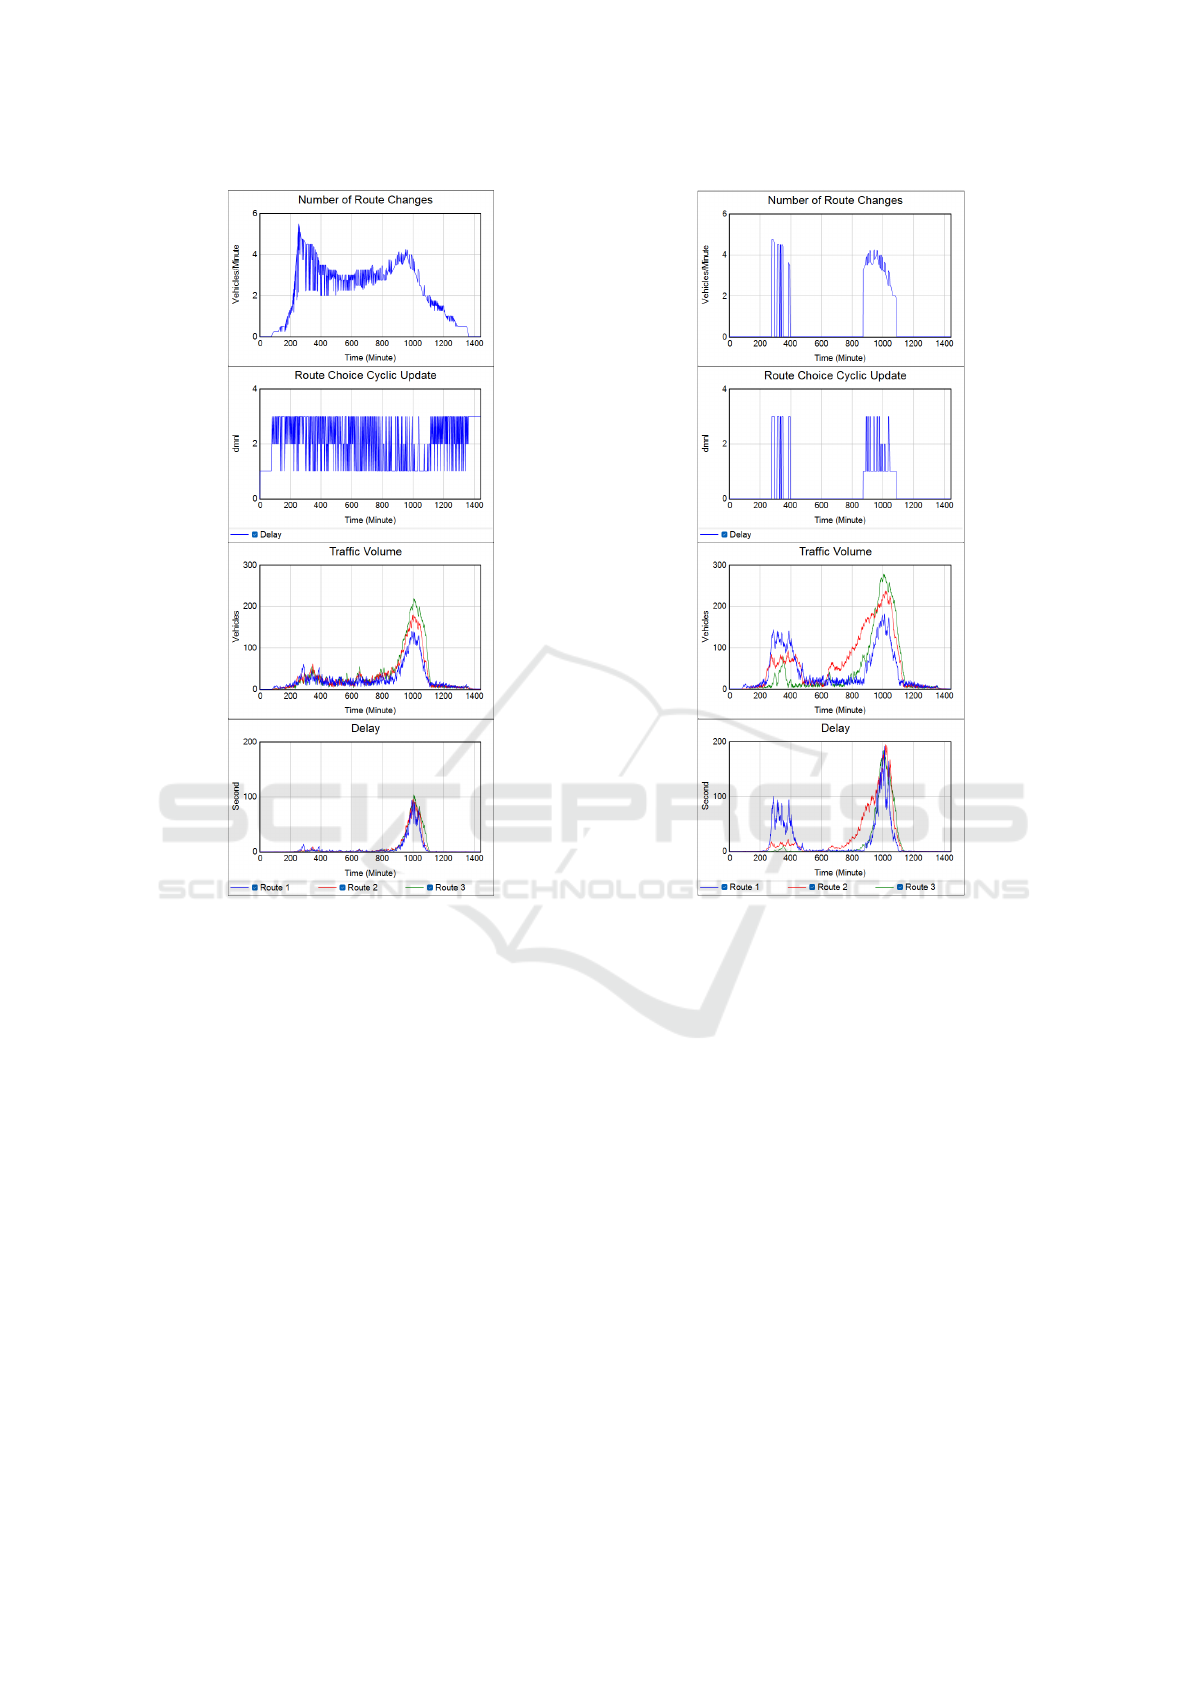
Figure 5: Results - Scenario I.
• C-ITS EQUIPMENT RATE: 25%
• DELAY THRESHOLD: 60 seconds
• UPDATE INTERVAL: 5 minutes
The results (see Figure 6) reveal key differences
from Scenario I. Rerouting does not occur continu-
ously but starts at minute 276, redirecting vehicles to
route option 3. After this, rerouting is absent for sev-
eral hours until the evening.
Unlike Scenario I, the Route Choice Cyclic Up-
date exhibits fewer alternations due to the 5-minute
update interval. This results in less balanced Traffic
Volumes among the three routes. In terms of Delay,
Scenario II shows increased peaks compared to Sce-
nario I. Morning Delay for route option 1 reaches 100
seconds (1.67 minutes), while evening peak Delays
for all routes range between 180 and 190 seconds (3
to 3.17 minutes). Despite these increases compared to
Scenario I, Scenario II still achieves significant traffic
efficiency improvements over the Base Scenario.
Figure 6: Results - Scenario II.
3.4 Scenario III
Scenario III applies a C-ITS EQUIPMENT RATE of
100%, where all vehicles are rerouted to the current
Route Choice Cyclic Update. The DELAY THRESH-
OLD and UPDATE INTERVAL remain similar to Sce-
nario II. The parameters used are:
• C-ITS EQUIPMENT RATE: 100%
• DELAY THRESHOLD: 60 seconds
• UPDATE INTERVAL: 5 minutes
The results (see Figure 7) demonstrate that while
Scenario III achieves improvements compared to the
Base Scenario, it performs worse than Scenarios I and
II. A detailed analysis reveals fluctuations in Traffic
Volume and Delay. This decline in efficiency arises
from the high C-ITS EQUIPMENT RATE, which re-
sults in all vehicles being rerouted to the route with
the lowest Delay. Although this temporarily alleviates
congestion on high-delay routes, it risks overloading
the selected route, leading to inefficiencies.
VEHITS 2025 - 11th International Conference on Vehicle Technology and Intelligent Transport Systems
354
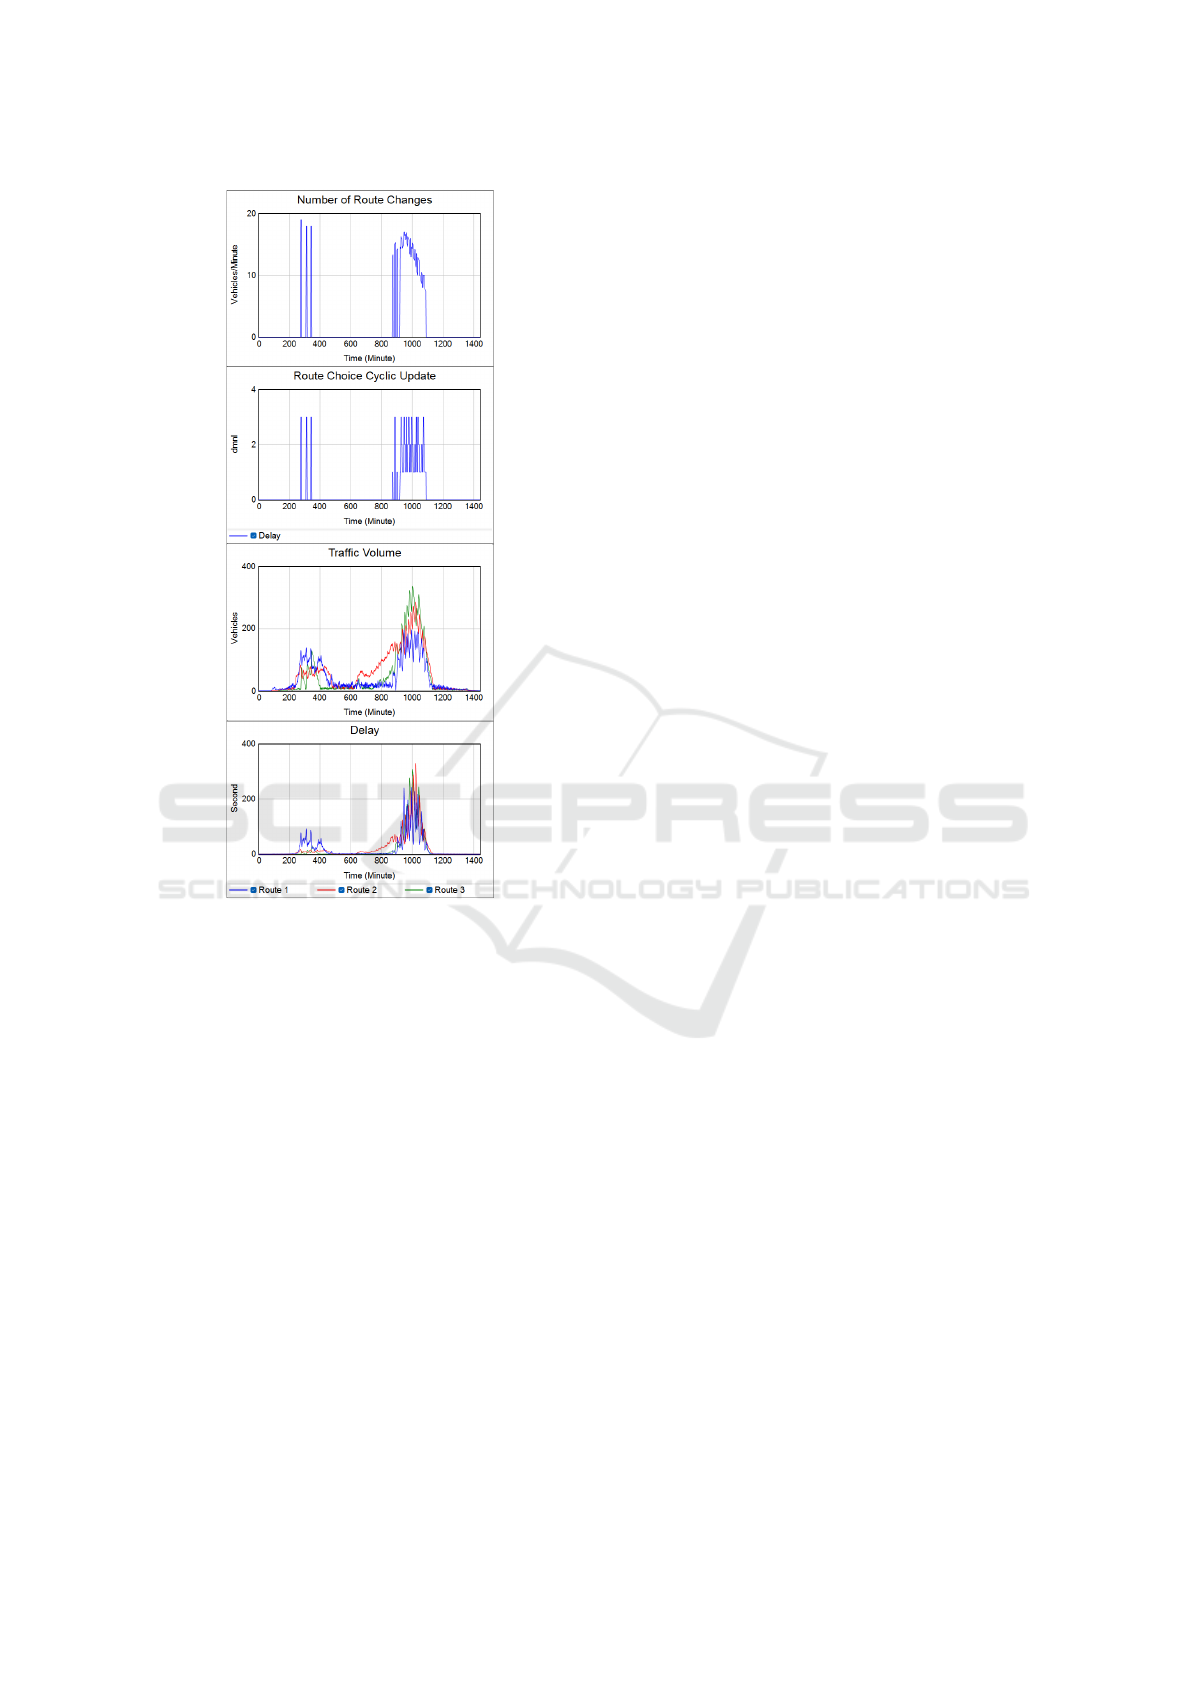
Figure 7: Results - Scenario III.
The combination of a 100% C-ITS EQUIPMENT
RATE with an UPDATE INTERVAL reinforces this
effect. For 5 consecutive minutes, all vehicles from
two routes are rerouted to the currently selected route,
causing rapid increases in Traffic Volume and De-
lays. Once the interval elapses, vehicles are rerouted
again, resulting in similar effects on the newly se-
lected route. This cyclic pattern disrupts traffic dis-
tribution, causing uneven Traffic Volume and higher
Delay. The morning Delay for route option 1 reaches
up to 90 seconds (1.5 minutes). During the evening
peak, Delays for route options 1, 2, and 3 reach 240
seconds, 330 seconds, and 310 seconds, respectively.
4 SYSTEM DYNAMICS VS.
AGENT-BASED MODELS
Comparing the findings from this SD-based study to
existing literature using ABM reveals consistency in
results, despite differences in methodology.
For instance, Kim et al. (2020) explored CR for
enhancing traffic flow via ABM with SUMO and
OMNET++ simulators on a Manhattan grid network.
Their findings showed that CR significantly increased
average speed and reduced travel time. However, for
equipment rates near 100%, benefits began to dimin-
ish. Improvements were substantial up to a 20% rate,
with continued, albeit reduced, efficiency gains be-
tween 20% and 60%. Beyond 60%, high volumes
of rerouted vehicles caused congestion on alterna-
tive routes, mirroring the trends identified in the SD
model. Similarly, Wedel et al. (2009) investigated CR
using SUMO and VSimRTI simulations in Cologne.
Their results demonstrated significant travel time re-
ductions (up to 50%) for both cooperative and con-
ventional vehicles at 80% equipment. Cooperative
vehicles showed benefits even at a 20% rate, while
conventional vehicles required at least 60% to see im-
provements. At approximately 75% equipment, regu-
lar vehicles outperformed cooperative ones due to re-
maining on main routes, avoiding congested alterna-
tive paths. Katsaros et al. (2011) analyzed CR based
on congestion levels using SUMO and JiST/SWANS.
Their work revealed that travel times decreased sig-
nificantly up to an equipment rate of 60%. However,
equipment rates exceeding 80% led to adverse effects,
as collective rerouting congested alternative routes.
They proposed improving rerouting algorithms to pre-
vent simultaneous diversion of all equipped vehicles.
The results obtained from the SD approach are con-
sistent with ABM findings in terms of trends in travel
time and speed improvements across varying equip-
ment rates. Notably, both approaches identify dimin-
ishing returns or even adverse effects at high equip-
ment rates due to overloading of alternative routes.
The SD approach offers a macroscopic traffic sim-
ulation model, in contrast to ABM’s microscopic ap-
proach, which requires detailed agent behavior cali-
bration. This reduces modeling effort in C-ITS im-
pact assessment, as the SD model does not require
such detailed implementation. Additionally, the SD
model explicitly encodes interrelationships and feed-
back loops between different impact categories, en-
hancing interpretability. In contrast, ABM implicitly
captures these effects in the results analysis. The SD
framework supports rapid scenario testing and sensi-
tivity analysis, enabling quick exploration of parame-
ter variations, while ABMs require extensive compu-
tational resources and time for multiple simulations
and post-simulation analysis. Therefore, while both
models produce comparable results, the SD approach
offers advantages in terms of modeling efficiency, ex-
plainability, and immediate scenario testing, making
it a valuable tool for assessing C-ITS impacts.
Towards Impact Assessment of Cooperative Routing on Traffic Efficiency: A System Dynamics Approach
355

5 CONCLUSION
This work applies the SD modeling technique to as-
sess the impact of the C-ITS service CR on traffic effi-
ciency. By using the developed SFM, multiple scenar-
ios were defined to test different parameter combina-
tions and compare the results. The findings highlight
the influence of the C-ITS EQUIPMENT RATE, DE-
LAY THRESHOLD, and UPDATE INTERVAL on re-
sults, with all scenarios showing improvements over
the Base Scenario to varying degrees.
Key findings indicate that low C-ITS EQUIP-
MENT RATEs yield significant traffic efficiency im-
provements. However, rerouting all C-ITS equipped
vehicles (100% C-ITS EQUIPMENT RATE) to the
route with the lowest Delay can cause overloads, par-
ticularly with long UPDATE INTERVALs, leading to
Delays. Introducing a DELAY THRESHOLD helps
avoid rerouting for minimal Delays, though this re-
duces overall efficiency as it takes some Delay to ini-
tiate rerouting. High UPDATE INTERVALs in com-
bination with a high C-ITS EQUIPMENT RATE lead
to route overloads. A more selective rerouting strat-
egy, where only a portion of equipped vehicles are
rerouted for optimal performance, is recommended.
Future extensions of the model could include pre-
dictive rerouting based on anticipated outcomes, in-
tegration of different rerouting criteria such as Free
Capacity or Travel Time, and the inclusion of stochas-
tic elements to account for compliance probabilities.
Additionally, the model could be expanded to assess
other impact categories such as sustainability, consid-
ering factors like CO
2
emissions and noise levels, al-
lowing for rerouting criteria that balance both traffic
efficiency and sustainability.
ACKNOWLEDGEMENTS
The work leading to the results was funded by the
State of Upper Austria within the project SUBSTAN-
TIATE (grant no. 895978), managed by the Austrian
Research Promotion Agency (FFG).
REFERENCES
Agriesti, S., Studer, L., Marchionni, G., Gandini, P., and
Qu, X. (2020). Roadworks warning - closure of a lane,
the impact of c-its messages. Infrastructures, 5(3):27.
Breitenecker, F., Judex, F., Popper, N., Breitenecker, K.,
Mathe, A., and Mathe, A. (2008). Love emotions be-
tween laura and petrarch an approach by mathematics
and system dynamics. Journal of Computing and In-
formation Technology, 16(4):255.
Drake, Joseph L. Schofer, and A. D. May (1966). A statis-
tical analysis of speed-density hypotheses. Highway
Research Record 154, pages 53–87.
European Commission (2016). A european strategy on co-
operative intelligent transport systems, a milestone to-
wards cooperative, connected and automated mobility.
EVIS.AT (2024). Evis.at - echtzeit verkehrsinformation
straße
¨
osterreich.
Forrester, J. W. (1969). Industrial dynamics: Students’ edi-
tion. MIT Press, Cambridge, Mass, 6th printing edi-
tion.
Katsaros, K., Kernchen, R., Dianati, M., Rieck, D., and Zi-
noviou, C. (2011). Application of vehicular communi-
cations for improving the efficiency of traffic in urban
areas. Wireless Communications and Mobile Comput-
ing, 11(12):1657–1667.
Kim, K., Koo, S., and Choi, J.-W. (2020). Analysis on path
rerouting algorithm based on v2x communication for
traffic flow improvement. In 2020 International Con-
ference on Information and Communication Technol-
ogy Convergence (ICTC), pages 251–254. IEEE.
Lu, N., Cheng, N., Zhang, N., Shen, X., and Mark, J. W.
(2014). Connected vehicles: Solutions and chal-
lenges. IEEE Internet of Things Journal, 1(4):289–
299.
Pribyl, O., Blokpoel, R., and Matowicki, M. (2020). Ad-
dressing eu climate targets: Reducing co2 emissions
using cooperative and automated vehicles. Trans-
portation Research Part D: Transport and Environ-
ment, 86:102437.
Rodrigue, J.-P. (2020). The geography of transport systems.
Routledge/Taylor & Francis Group, Abingdon Oxon
and New York NY, fifth edition edition.
Soon, K. L., Lim, J. M.-Y., and Parthiban, R. (2019). Coor-
dinated traffic light control in cooperative green vehi-
cle routing for pheromone-based multi-agent systems.
Applied Soft Computing, 81:105486.
Statista (2023). Number of connected cars in european
countries in 2023 — statista.
Walch, M., Neubauer, M., Schildorfer, W., and Schirrer, A.
(2024). Modelling interrelations between c-its impact
categories: a system-dynamics approach using causal
loop diagrams. European Transport Research Review,
16(3):1–27.
Walch, M., Schirrer, A., and Neubauer, M. (2025). Im-
pact assessment of cooperative intelligent transport
systems (c-its) - a structured literature review. Euro-
pean Transport Research Review.
Wardrop, J. G. (1952). Some theoretical aspects of road
traffic research. Proceedings of the Institution of Civil
Engineers, 1(3):325–362.
Wedel, J. W., Sch
¨
unemann, B., and Radusch, I. (2009).
V2x-based traffic congestion recognition and avoid-
ance. In I-SPAN 2009, pages 637–641, Los Alamitos,
Calif. IEEE Computer Society.
Wu, X., Zhao, X., Xin, Q., Yang, Q., Yu, S., and Sun, K.
(2019). Dynamic cooperative speed optimization at
signalized arterials with various platoons. Transporta-
tion Research Record: Journal of the Transportation
Research Board, 2673(5):528–537.
VEHITS 2025 - 11th International Conference on Vehicle Technology and Intelligent Transport Systems
356
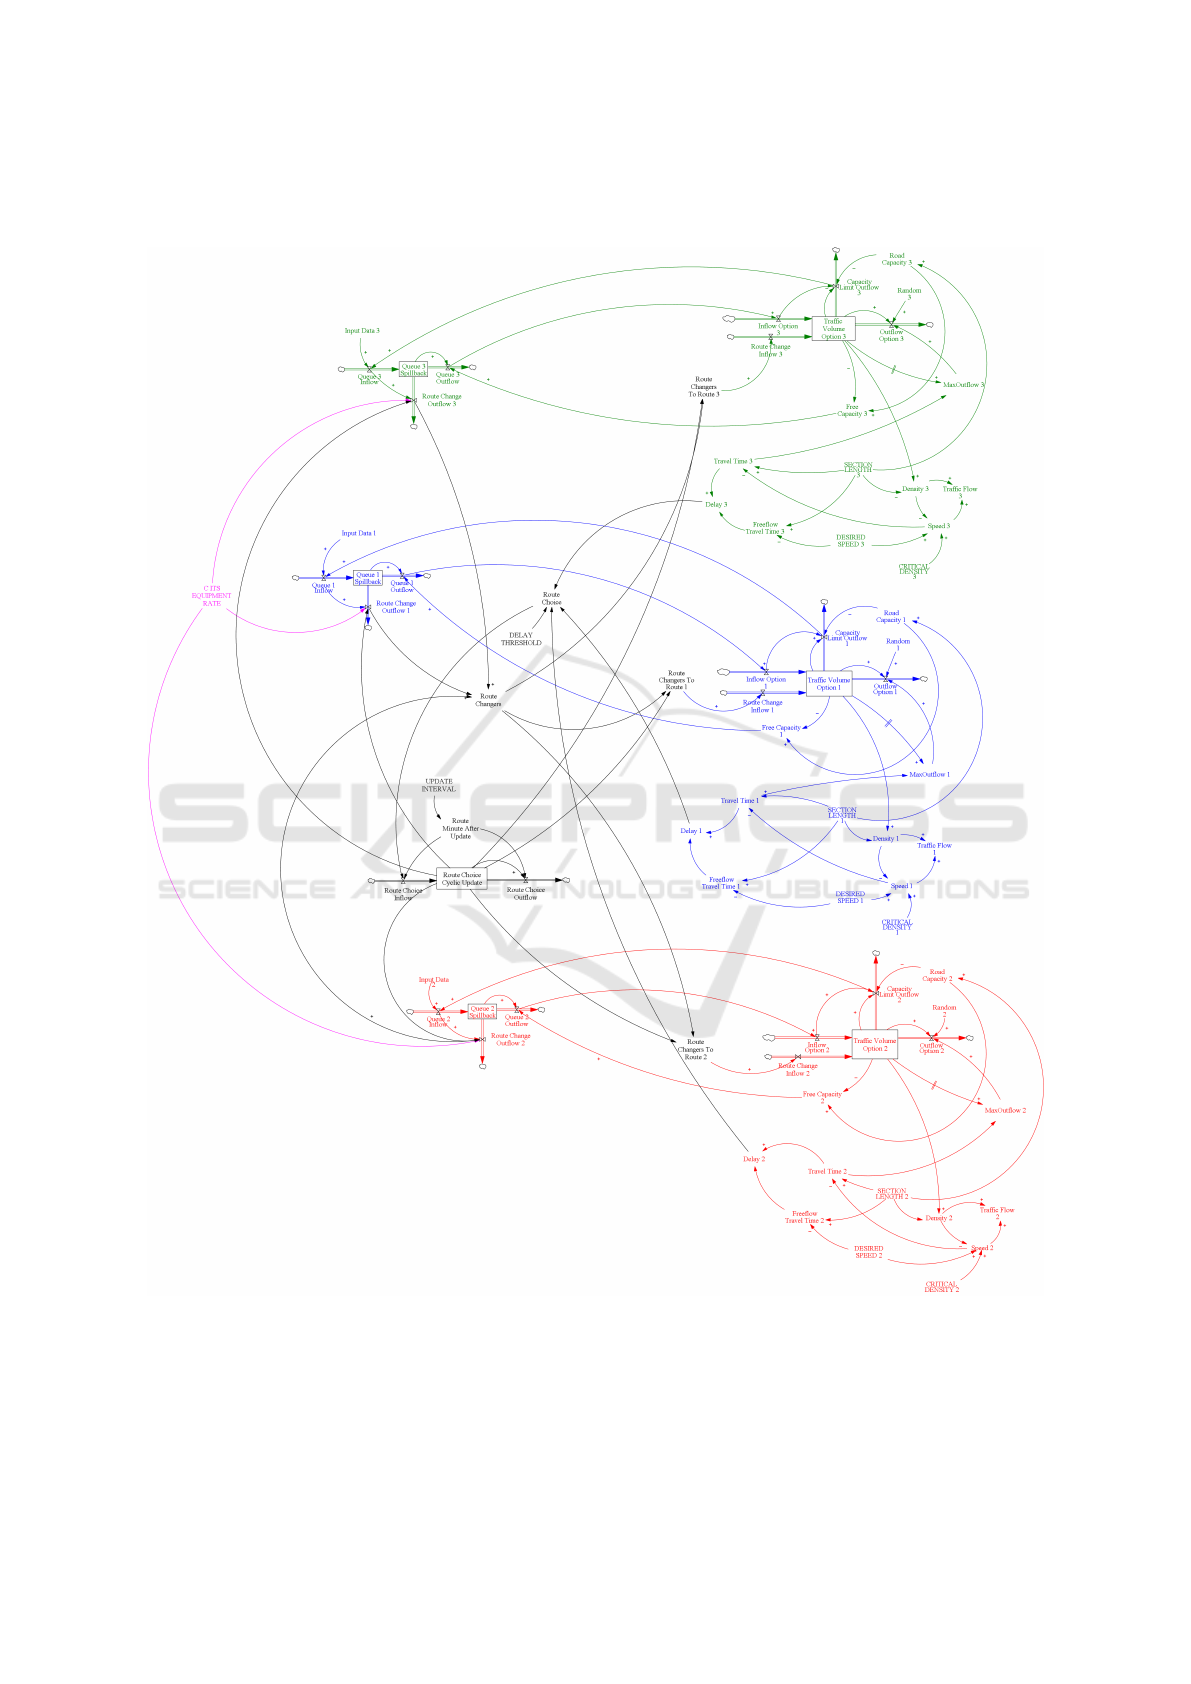
APPENDIX
Figure 8: Complete Stock-Flow Model.
Towards Impact Assessment of Cooperative Routing on Traffic Efficiency: A System Dynamics Approach
357
