
Development and Validation of a Vehicle Corner Test Rig Designed
for Hardware-in-the-Loop Testing
Paulius Kojis
1a
, Viktor Skrickij
2b
, Valentin Ivanov
3c
, Eldar Šabanovič
2d
,
Marijonas Bogdevičius
1e
and Tomas Grikenis
1f
1
Department of Mobile Machinery and Railway Transport, Faculty of Transport Engineering, Vilnius Gediminas Technical
University, 10105 Vilnius, Lithuania
2
Transport and Logistics Competence Centre, Faculty of Transport Engineering, Vilnius Gediminas Technical University,
10223 Vilnius, Lithuania
3
Smart Vehicle Systems—Working Group, Technische Universität Ilmenau, Ehrenbergstr, 29, 98693 Ilmenau, Germany
Keywords: Vehicle Corner, Test Rig, Hardware-in-the-Loop, Electric Vehicle, Tyre Forces.
Abstract: Many original equipment manufacturers and Tier 1 suppliers have recently proposed various vehicle corner
concepts. This technology offers numerous benefits for enhancing vehicle dynamics but presents several
challenges. Field testing of the corners installed on a vehicle demonstrator could be an ideal solution to address
these challenges. Nevertheless, the proof-of-concept development phase also requires studies on the
component and system levels. In this regard, a vehicle corner test rig designed for hardware-in-the-loop testing
provides a balanced alternative that combines the accuracy, complexity, and accessibility of experimental
works. Real suspension components, including a rotating wheel with tyre, provide realistic suspension
kinematics and compliance that are very similar to those experienced in real driving scenarios. However, this
approach has limitations because the tyre contact forces and loading conditions cannot be fully replicated in
a laboratory environment. This paper explores these aspects and describes a developed comprehensive
methodology for eliminating inaccuracies, with results validated accordingly.
1 INTRODUCTION
Modern electric vehicle (EV) architectures with
individual corner actuators enable new motion
control technologies (Armengaud et al., 2021; Cheng
et al., 2024). Coupled with an integrated chassis
control (ICC) approach, the full potential of multi-
actuated vehicles can be exploited, with the benefits
of vehicle safety, comfort, fail-safe operation, and
redundancy (Skrickij et al., 2024). However, this
complex integration requires advanced components
and thorough testing. For this reason, automotive
researchers and engineers apply various hardware-in-
a
https://orcid.org/0000-0003-0566-559X
b
https://orcid.org/0000-0002-8080-875X
c
https://orcid.org/0000-0001-7252-7184
d
https://orcid.org/0000-0002-4724-0787
e
https://orcid.org/0000-0003-4947-7638
f
https://orcid.org/0009-0002-5400-9150
the-loop (HIL) setups to facilitate testing in real-time
(Heydrich et al., 2022; Ivanov et al., 2019).
A corner-based chassis architecture is a potential
pathway for further development of EVs. Such
architecture typically incorporates in-wheel motors
(IWM), brake-by-wire, and steer-by-wire systems;
some corners may also feature toe and camber
actuators. While the first prototypes of this
technology emerged over two decades ago, research
and development in this area have gained significant
momentum in recent years. Notable contributions
come from several Horizon projects, including
OWHEEL, SmartCorners, and industrial companies
358
Kojis, P., Skrickij, V., Ivanov, V., Šabanovi
ˇ
c, E., Bogdevi
ˇ
cius, M. and Grikenis, T.
Development and Validation of a Vehicle Corner Test Rig Designed for Hardware-in-the-Loop Testing.
DOI: 10.5220/0013208900003941
In Proceedings of the 11th International Conference on Vehicle Technology and Intelligent Transport Systems (VEHITS 2025), pages 358-365
ISBN: 978-989-758-745-0; ISSN: 2184-495X
Copyright © 2025 by Paper published under CC license (CC BY-NC-ND 4.0)

such as Continental and Hyundai Mobis (Nguyen and
Trovão 2024; Kojis et al., 2022).
Novel corner architecture offers numerous
advantages. First, it enables torque control at each
vehicle corner and torque vectoring that enhances
manoeuvrability and stability (Guo et al. 2019; Hori
2004; Jneid and Harth 2024). Additionally, the
modular design of vehicle corners facilitates the
development of flexible vehicle platforms.
Eliminating components such as driveshafts and
differentials reduces energy losses and improves
vehicle packaging (Deepak et al., 2023). However,
there are drawbacks: increased unsprung mass (UM)
due to IWM and other components result in comfort
and handling issues if passive suspension components
are used; larger vehicle inertia around the vertical axis
impairs with vehicle stability; increased system
complexity, number of parts and price (Kojis et al.,
2022).
In order to fully exploit vehicle corners, advanced
components and thorough testing are inevitable.
Testing can typically be carried out in three main
ways: simulation environments, laboratories, and
proving grounds, each with its advantages and
disadvantages.
Simulations provide high repeatability and rapid
evaluation, making them the most cost-effective
method for investigating complex systems. However,
they can be limited by assumptions that may reduce
the accuracy and fidelity of system replication. In
addition, the high nonlinearity of certain system
elements can make mathematical modelling complex
and computationally intensive.
Vehicle field testing on a proving ground can be
considered the best option despite being subject to
various uncertainties and issues with repeatability. To
ensure consistent replicability of tests, vehicle control
inputs must remain stable and free from human error.
Laboratory testing serves as a primary alternative
to the field testing, offering high repeatability and
accelerating the execution of tests. Experiments in the
laboratory conditions can be conducted at the whole
vehicle level for tasks such as suspension testing,
kinematics and compliance (KnC), component
durability assessments, ride comfort evaluations, and
noise, vibration, and harshness (NVH) testing
(Chindamo et al., 2017; Gräbe et al., 2020).
The second group of testing equipment consists of
various quarter-car test rigs, categorised into three
types according to the literature (Maher and Young,
2010). The first category includes setups that consist
solely of a sprung mass (SM), UM, damper, and
spring. This configuration is primarily utilised for
developing and validating active and semi-active
suspension control systems (Omar et al., 2017; Gysen
et al., 2010). The second type incorporates complete
suspension components, a wheel and a tyre. Including
these elements ensures a more realistic suspension
response to vertical excitations induced by the shaker
system beneath the tyre (Yu et al., 2019; Lauwerys et
al., 2005). This setup can be employed for suspension
KnC testing, examining the influence of the tyre on
vertical vehicle dynamics, conducting frequency
analyses, and prototyping suspension components.
The final group features a rolling road, which can be
implemented using flat belts or drums. Such
construction enables the consideration of brake- and
acceleration-induced longitudinal forces, steering-
induced lateral forces and associated suspension
deflections. Vertical excitation is provided by cleats
attached to the rotating surface or by shaking the
entire rotating assembly using an eccentric and
various actuators (Li and Lee, 2019; Gießler et al.,
2022).
Each of the described quarter-car test rigs has
inherent flaws and simplifications that can affect the
accuracy of the measured quantities and their
correlation to field tests. These setups typically allow
the SM to move only vertically, meaning they do not
account for weight transfer due to braking or
acceleration nor capture roll or pitch angles. Flat belt
systems tend to produce lower rolling resistance
values than observed during field tests, as the belt
heats up more and generates higher temperatures on
the tyre surface. According to the SAE J 1106
standard, flat belts can induce lateral tyre forces up to
10% greater than those observed with drum-type
systems.
On the other hand, drum-type rolling roads can
distort the tyre/road contact patch, reducing tyre
lateral force and aligning torque while increasing tyre
rolling resistance. It is therefore necessary to properly
recalibrate the values recorded on corner test rigs to
allow comparison with field test results. To address
these challenges, automotive researchers and
engineers utilise HIL setups (Heydrich et al., 2022;
Ivanov et al., 2019; Stolte et al., 2023). In a HIL setup,
a mathematical model is connected to a physical
system, enabling the investigation of a subsystem
under development by incorporating its physical
components into a closed-loop mathematical
simulation of the overall system (Fathy et al., 2006).
In this context, recalculation of physical outputs from
the corner test rig is essential to ensure that they align
with the expected values from the real system.
The development of HIL systems for vehicle
corner testing offers several key benefits (Mihalič et
al., 2022): real-time feedback, cost-effectiveness,
Development and Validation of a Vehicle Corner Test Rig Designed for Hardware-in-the-Loop Testing
359
scalability and reproducibility. Traditional HIL
applications typically involve a single test rig
implementation (e.g., brakes, suspension, steering,
etc.). However, multiple test rigs in the same
laboratory can be interconnected to create a Test-rig-
in-the-Loop (TRIL) system (Augsburg et al., 2011).
When test setups are distributed between different
locations, shared and connected X-in-the-Loop (XIL)
testing procedures can be employed (Ivanov et al.,
2019).
The literature review indicates that the HIL
approach is effective for investigating vehicle corner
proof of concept when field testing is not feasible. A
new vehicle corner test rig concept has been
developed in this regard. The primary contribution of
this paper is a detailed methodology for validating
developed test rig, aiming to address the key
limitations associated with such equipment.
The paper is structured as follows: Section 2
outlines the HIL design for vehicle corner testing.
Section 3 identifies the main sources of inaccuracies
and discusses strategies for their mitigation, along
with the presentation of validation results. Section 4
includes a case study related to vehicle corner HIL
testing. Finally, Section 5 summarises the findings
and offers an outlook on potential next steps.
2 HIL FOR VEHICLE CORNER
TESTING
An experimentally validated, sport utility vehicle’s
(SUV) mathematical model which is running on the
real-time target machine and connected with the
corner test rig is used for the HIL application. Vehicle
model features 14 degrees of freedom (DoF) and is
implemented via the IPG CarMaker and Simulink
conjunction. More information regarding the
mathematical model can be found in an article by
Šabanovič et al., 2021. Physical nonlinear corner
components, which are hard to model, are used on the
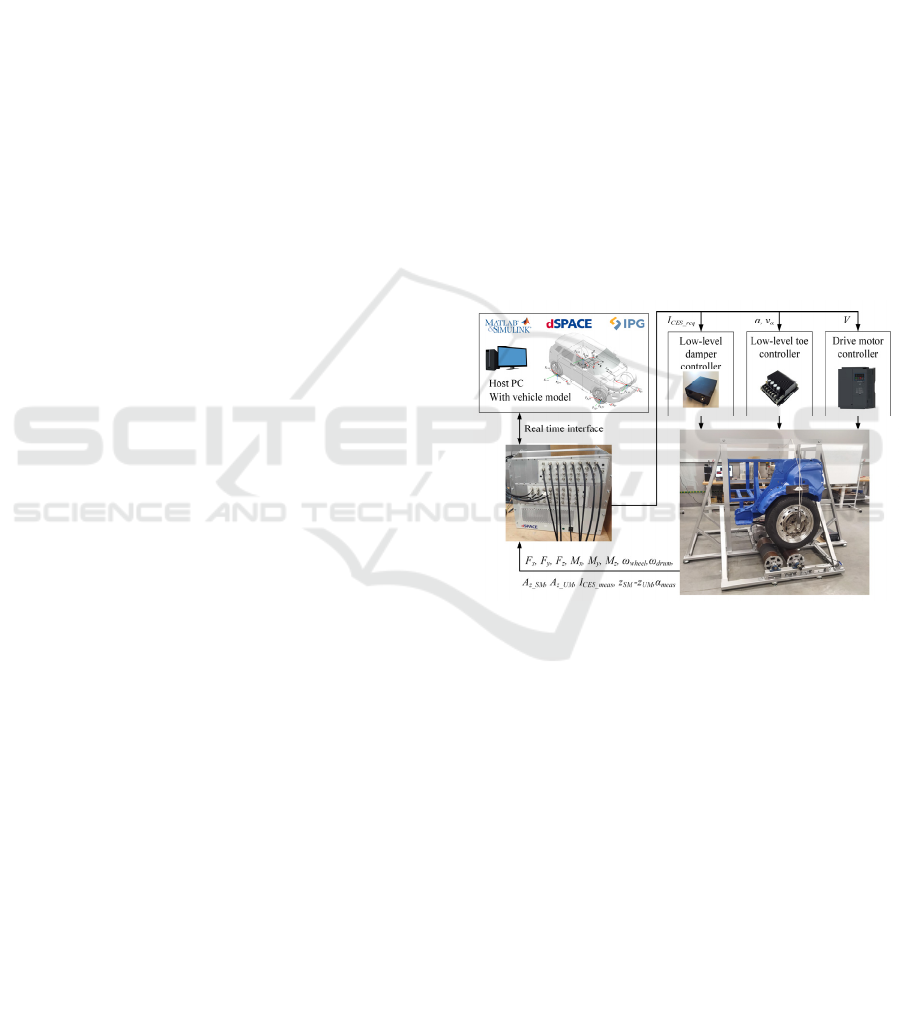
corner test rig. The whole system architecture is
presented in Figure 1, and the main technical data is
presented in Table 1.
Host PC containing the MATLAB and IPG
CarMaker HIL software packages is directly
connected to the dSPACE real-time target machine.
Once the real-time simulation is initialised, the
dSPACE ControlDesk is utilised to exchange data
between software and hardware components installed
on the test rig.
The dSPACE inputs are employed to measure the
characteristics and critical values induced by the
experiments on the quarter-car test rig. The wheel
transducer measures tyre forces ( 𝐹
, 𝐹
, 𝐹
) and
torques (𝑀
, 𝑀
, 𝑀
). It also provides the angular
velocity of the wheel (𝜔
). This velocity is then
compared to the reading of the encoder attached to the
steel drum ( 𝜔
) axis of rotation, and the
longitudinal slip is calculated. Displacement of the
actuators is measured by linear potentiometers and
supplied to the real-time target machine (𝛼
).
Additionally, to implement suspension control, SM
and UM vertical accelerations ( 𝐴
_
, 𝐴
_
),
suspension stroke (𝑧
− 𝑧
) and actual current at
the damper valve ( 𝐼
_
) are measured. The
dSPACE outputs are mainly used to send inputs to the
low-level controllers of electric toe actuators (𝛼, 𝑣
),
suspension damper (𝐼
_
) and electric motor (𝑉)
controllers. Since hardware components are installed
on the test rig, this HIL setup allows the test of control
algorithms, element activation delays, actuators
dynamics and overall system operation.
Figure 1: HIL set up.
Such a system has two main drawbacks. First,
these setups do not consider vehicle’s roll and pitch
angles. As a result, the vertical load does not fully
correspond to real-world system dynamics during
cornering and braking. For this reason, weight
transfer from the simulation environment is applied to
recalculate vertical loading in different driving
scenarios. Second, contact forces between the tyre
and the drum do not represent the actual ones
generated in the contact between the road and the tyre
in real conditions. Hence, tyre forces and moments
generated on the test rig are registered using a wheel
force transducer and further recalculated using
provided methodology.
VEHITS 2025 - 11th International Conference on Vehicle Technology and Intelligent Transport Systems
360

Table 1: Vehicle corner test rig specifications.
Parameter Value
Overall dimensions of
test rig (L x W x H)
2.7 x 1.7 x 1.8 m
Minimal sprung mass 200 kg
Maximal sprung mass 900 kg
Electric motor-rated
power on drum
11 kW (400 V)
Maximum wheel’s linear
velocity
170 km/h
Diameter of the drum 0.22 m
Single-toe actuator-rated
force
1000 N (12 V 4.6 A)
Rear toe actual range
±3°
Controller for the toe
actuators
Cytron MDDS30
Vertical actuator
Custom-made semi-active
damper with continuously
controlled valve
Controller for the vertical
actuator
Custom-made low-level
damper controller
Wheel force transducer
Michigan Scientific
Corporation LW12.8-50
Real-time target machine
dSPACE ds1006 total 64
input and output slots
Software
MATLAB, Simulink, IPG
CarMaker HIL, dSPACE
ControlDesk
Vertical excitation Sinusoidal – Amplitude
up to 16 mm
Other
Possibility to run drum
and belt setups, for IWM
consideration, an
additional 35 kg mass can
be added to UM
3 TYRE FORCES
RECALCULATION
In typical test rigs with a rolling drum, the maximal
longitudinal tyre force is achieved at slip values of
around 0.1. However, in such test rigs, the drum
diameter is much higher compared to the tyre
diameter. In the case under investigation, such
construction was not feasible; the drum diameter was
only 0.22 m. The registered values must be
recalculated since the rolling drum surface has
friction and geometrical properties different from the
actual road surface. Using such an approach, various
road conditions can be simulated (for example,
dry/wet asphalt, icy roads, etc.) (Arosio et al., 2005).
A series of braking tests using the vehicle corner
test rig have been performed for longitudinal contact
force estimation. The wheel was rolling on the steel
drum in all of the tests. Different vertical loading
scenarios need to be investigated. Mathematical
modelling showed that vertical load may change in a
wide range from 2000 N to 9000 N. The magnitude
of the vertical load during the experiments was solely
based on the additional SM. At the beginning of each
test run, static load, tyre surface temperature and
vehicle suspension settings were registered.
Afterwards, the wheel is excited to reach predefined
linear velocities of 50 km/h, 75 km/h and 100 km/h.
Once the speed has settled in, the braking is applied
till the full stop of the wheel. With each load and
velocity setting, five tests are performed. The average
of the results from 5 braking tests, captured on the
same F
z
and wheel linear velocities, are taken to form
longitudinal tyre force curves versus slip angle,
considering different road types and tyre wear. To
omit outliers, data from the force transducer was
filtered using median filters. Experimental data
showed that maximal longitudinal force is achieved
when the slip exceeds 0.2. As described above, the
resulting forces must be validated since the tyre
contact properties are distorted. For this reason, the
actual values of the tyre forces in the longitudinal
direction are used, which were generated with the
experimentally validated MF 6.1 tyre model at the
same slip angles and vertical loads.
These target curves are then divided by the curves
gathered in experiments on the test rig with a steel
drum. The result of curve division produces
longitudinal tyre force recalculation coefficients, and
the polynomial curve fit is done to capture the trend
of the recalculation coefficients (Figure 2).
In Figure 2, each curve is marked for the specific
vertical load and vehicle travel speed, which is 100
km/h. Due to repetition, this paper does not provide
results achieved at other loading conditions and
velocities.
During the investigation, it was found that
a polynomial curve of the fifth order can be used for
force recalculation. For all the cases, the value of
the determination coefficient was higher than 0.98.
Once the database containing polynomial curves is
completed for the most common loading scenarios on
the test rig, the longitudinal slip, vertical load, and
measured longitudinal force proceed to the algorithm,
which contains polynomials, and the recalculation is
performed. The force recalculation for dry/wet and
new/worn tyres using the algorithm proposed above
is shown in Figure 3.
Development and Validation of a Vehicle Corner Test Rig Designed for Hardware-in-the-Loop Testing
361
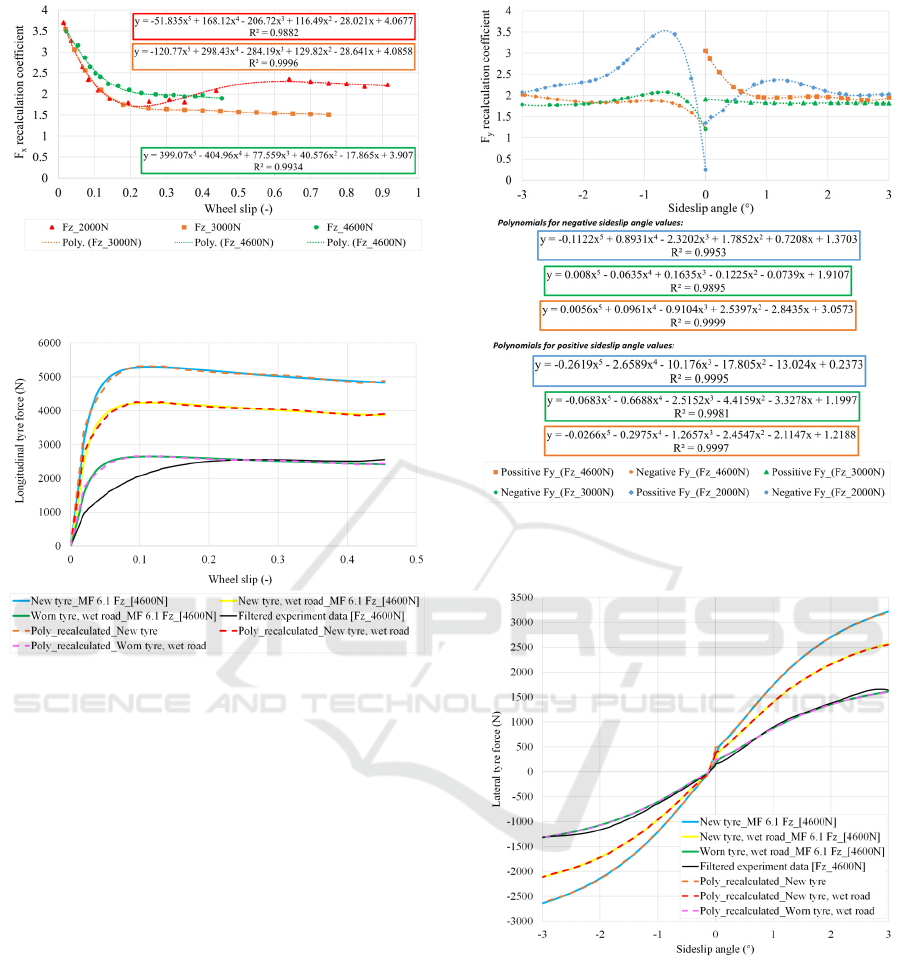
Figure 2: Examples of longitudinal tyre force recalculation
coefficients for a few loading cases and velocity 100 km/h.
Figure 3: Longitudinal tyre force recalculation for medium
vertical loading scenario (4600 N).
Similar conditions were maintained in dedicated
experiments for lateral tyre force measurements.
Sideslip angle input was generated in the form of an
active toe. Due to the used vehicle rear suspension
and overall corner construction application, toe
amplitude of 6° (±3°) was used. All the required
variables for validation were gathered in real-time
and saved in the database. The polynomial curves of
the fifth order were used for recalculation (Figure 4);
for all the cases, the value of the determination
coefficient was higher than 0.98.
Since the wheel was cambered due to high vertical
load, different polynomial curves were required to
capture the asymmetry of the lateral tyre force (Figure
4). Using the same methodology, actual lateral force
values were achieved and compared to measurement
ones on the test rig. An example of a few scenarios is
shown in Figure 5.
For all cases under investigation, the created
recalculation methodology matches both longitudinal
and lateral forces well.
Figure 4: Examples of lateral tyre force recalculation
coefficients for few loading cases.
Figure 5: Lateral tyre force recalculation for medium
vertical loading scenario (4600 N).
3.1 Process of Interpolation
Since vertical load on the test rig is not affected by
the roll and pitch dynamics, it may only be changed
manually in a range from 2000 N to 9000 N.
Therefore, during the measurements, applying the
tyre force recalculation algorithm described above,
longitudinal and lateral forces at discrete values of
VEHITS 2025 - 11th International Conference on Vehicle Technology and Intelligent Transport Systems
362
vertical load, 𝐹
can be performed and stored as a
lookup table (LUT) (Table 2). An algorithm to
recalculate longitudinal and lateral forces for every F
z
is needed. This is where interpolation becomes
necessary.
Table 2: LUT for 𝐹
and 𝐹
estimation.
F
z
F
zmin
... F
zmax
Slip, λ F
x
(λ
,
F
zmin
) ... F
x
(λ
,
F
zmax
)
Toe
an
g
le, α
F
y
(α
,
F
zmin
) ... F
y
(α
,
F
zmax
)
Interpolation operates on two surrounding points
from the LUT. For example, consider the following
two points in Table 2 (for 𝐹
estimation): 𝐹
𝜆, 𝐹
,
𝐹
𝜆, 𝐹
. Here: 𝜆 is the current slip value, 𝐹
and
𝐹
are the lower and upper values of the vertical
load. The goal is to interpolate the value of F
x
at a
desired slip λ and vertical load 𝐹
. To calculate the
interpolated value 𝐹
𝜆, 𝐹
, we linearly interpolate
along the 𝐹
-axis as follows:
𝐹
𝜆, 𝐹
F
𝜆, 𝐹
,
,
𝐹
−𝐹
(1
)
A similar approach is used to calculate F
y
based
on toe angle and vertical load:
𝐹
𝛼, 𝐹
𝐹
𝛼, 𝐹
,
,
𝐹
−𝐹
(2
)
This method ensures smooth transitions between the
points in the LUT. To end with, overall recalculation
sequence can be summarised by these steps: 1)
generation of the target curves using MF 6.1; 2)
extraction of the actual tyre force curves from the
experiments; 3) curve division to obtain recalculation
coefficients; 4) polynomial curve fit over the
coefficients; 5) force recalculation using the
appropriate polynomial; 6) estimation of 𝐹
and 𝐹
for any given slip, toe and vertical load combination.
4 CASE STUDY
After developing a methodology for longitudinal and
lateral force recalculation and considering the vertical
load changes, the HIL setup was launched, and initial
tests were performed.
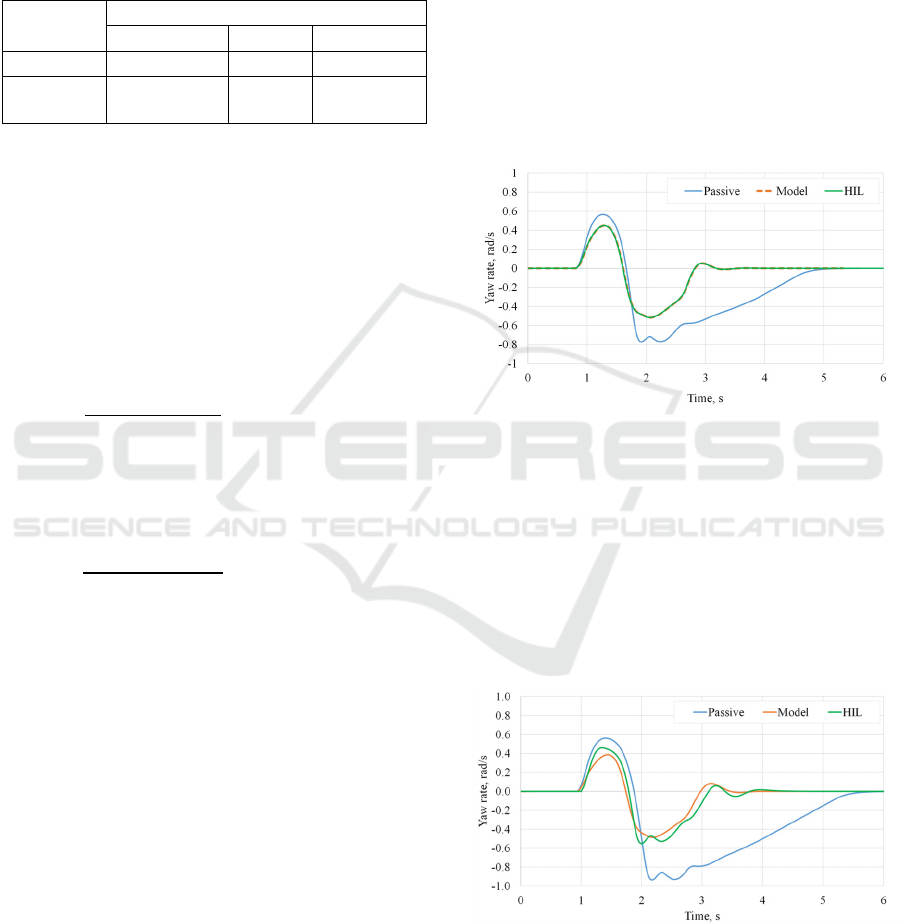
The Sin with Dwell manoeuvre was selected for
the case study to test rear-wheel toe control. Vehicle
velocities of 80 and 100 km/h were used. Three cases
were analysed: 1) Passive – a vehicle with corners,
without toe actuators; 2) Model – a vehicle with
corners and toe actuators. Notation "Model" refers to
the fact that the request of the mathematical model is
fed into the HIL test rig, but the actual position and
the response of the HIL is not fed-back into the
mathematical model. This means that "Model" is an
idealised system running in open loop; 3) HIL – a
vehicle with corners and toe actuators realised in
closed loop HIL application. Results are presented in
Figures 6 and 7.
Figure 6: Sin with Dwell at 80 km/h.
The toe actuators installed on HIL at lower vehicle
velocities could follow the target angle perfectly.
Feeding the actuator's position to the vehicle model in
real-time produced no distortions to the yaw rate and
overall vehicle response. Figure 6 shows no
difference between the Model and HIL results; the
RMSE value for this case under investigation is only
0.00438 rad/s. It needs to be mentioned that the
passive system could not perform manoeuvres.
Figure 7: Sin with Dwell at 100 km/h.
However, the difference between the Model and
HIL results appears at the higher vehicle speed (100
km/h, Figure 7). After analysing the results, it was
found that the toe actuator does not repeat the
Development and Validation of a Vehicle Corner Test Rig Designed for Hardware-in-the-Loop Testing
363
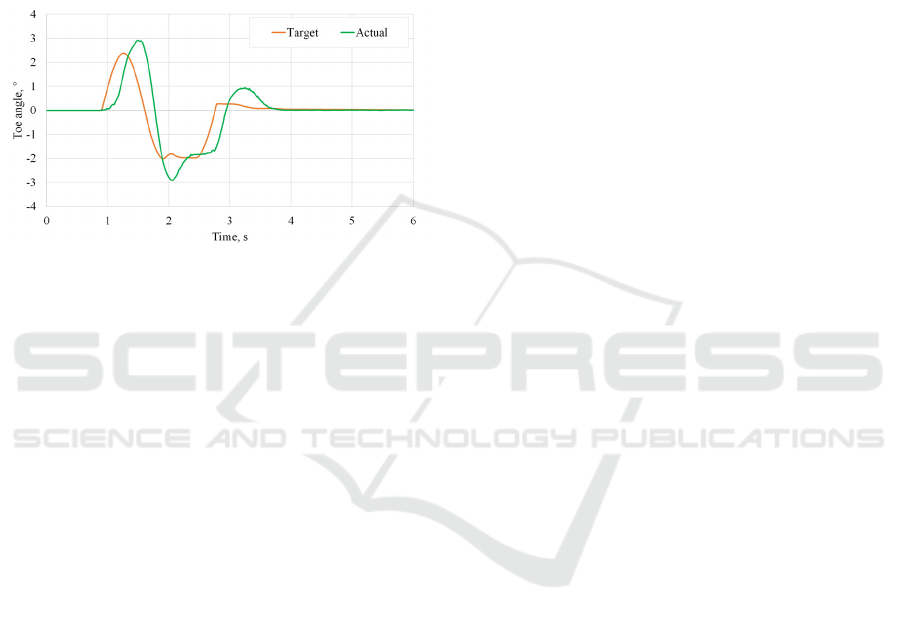
reference value so well as in a previous case (Figure
8); RMSE is 0.55° even though the manoeuvre was
performed successfully.
Due to the rule-based control strategy used for
active toe system, actuator nonlinearity, delay, and
fluctuations, the differences are more pronounced.
Since the mathematical model does not include any
actuator dynamics, it presents an idealised system.
Using the HIL simulation with real actuators allows
us to fully evaluate the effectiveness of the control
system and its influence on the vehicle dynamics.
Figure 8: Reference toe and actual toe value at velocity 100
km/h.
HIL experiments show that the actual yaw rate
differs from the one in the idealised system. Hence,
these outcomes from the HIL application can help
further develop the control system, mitigate control
errors, and ensure proper vehicle response. However,
it will be presented in future works.
5 CONCLUSIONS
With the completed investigation, there are several
conclusions:
1. A test rig for vehicle corner testing has been
manufactured, and a HIL system has been
developed. A real-time, high-fidelity
mathematical model of the vehicle is utilised
within the HIL, with the rear axle corner swapped
for physical components.
2. Since the test rig incorporates a vehicle quarter, it
cannot accurately account for roll and pitch
angles; consequently, the vertical loading does not
reflect reality. Additionally, the contact between
the tyre and the drum does not adequately
represent the actual contact between the tyre and
the road surface. Various road types, such as dry
and wet asphalt, ice, and other surfaces, cannot be
represented effectively. Therefore, a methodology
for recalculating longitudinal and lateral forces
has been developed to consider different loading
conditions, and the obtained results have been
compared with ground truth.
3. A case study demonstrating toe actuator testing is
presented. At up to 80 km/h velocities for the
selected manoeuvre, the results achieved with
HIL and the mathematical model are very similar
(with a RMSE of 0.0048 rad/s). However, as the
velocity increases, discrepancies arise due to the
nonlinearity of actuator and noise from the
sensors, which is not addressed within the
mathematical model.
4. Using the HIL approach, it was found that active
toe control of a vehicle equipped with corners
improves its dynamics. A vehicle with passive
corners, which includes IWM but does not contain
an active toe control system, is not able to perform
Sin with Dwell manoeuvre even at 80 km/h.
5. Finally, further modifications to the control
algorithm are necessary. The case study
demonstrated the advantages of employing HIL
for investigations. However, control algorithms
are not the primary focus of this paper and will be
explored in future work.
ACKNOWLEDGEMENTS
This work was supported by the Research Council of
Lithuania project no. S-MIP-23-120.
REFERENCES
Armengaud, E., Eitzinger, S., Pirker, H., Buh, J., Gramstat,
S., Heimann, S., Chen, C., Ivanov, V., Heydrich, M.,
Sorniotti, A., Gruber, P., and Tavernini, D. (2021). E-
Mobility-Opportunities and Challenges of Integrated
corner Solutions. SAE International Journal of
Advances and Current Practices in Mobility, 3(5),
2462–2472. https://doi.org/10.4271/2021-01-0984
Arosio, D., Braghin, F., Cheli, F., and Sabbioni, E. (2005).
Identification of Pacejka's scaling factors from full-
scale experimental tests. Vehicle System Dynamics,
43(sup1), 457–474. https://doi.org/10.1080/00423110
500229683
Augsburg, K., Gramstat, S., Horn, R., Ivanov, V., Sachse,
H., and Shyrokau, B. (2011). Investigation of brake
control using Test Rig-in-the-Loop technique. SAE
Technical Papers on CD-ROM/SAE Technical Paper
Series. https://doi.org/10.4271/2011-01-2372
Cheng, S., Peng, H.-N., Yang, C., Wang, W.-D., and Li, L.
(2024). Chassis Global Dynamics Optimization for
Automated Vehicles: A Multiactuator Integrated
Control Method. In IEEE Transactions on Systems,
VEHITS 2025 - 11th International Conference on Vehicle Technology and Intelligent Transport Systems
364

Man, and Cybernetics: Systems, 54(1), pp. 578–587.
https://doi.org/10.1109/tsmc.2023.3311446
Chindamo, D., Gadola, M., and Marchesin, F. P. (2017).
Reproduction of real-world road profiles on a four-
poster rig for indoor vehicle chassis and suspension
durability testing. Advances in Mechanical
Engineering/Advances in Mechanical Engineering,
9(8), 168781401772600. https://doi.org/10.1177/16878
14017726004
Deepak, K., Frikha, M. A., Benômar, Y., Baghdadi, M. E.,
and Hegazy, O. (2023). In-Wheel motor drive systems
for electric vehicles: state of the art, challenges, and
future trends. Energies, 16(7), 3121.
https://doi.org/10.3390/en16073121
Fathy, H. K., Filipi, Z. S., Hagena, J., and Stein, J. L.
(2006). Review of hardware-in-the-loop simulation and
its prospects in the automotive area. SPIE Proceedings.
https://doi.org/10.1117/12.667794
Gießler, Martin, Gauterin, F., & and Unrau, H. J. (2022).
New inner drum test bench for dynamic tests of
PLT and truck tires. KITopen-ID:1000156885.
https://doi.org/10.5445/IR/1000156885
Gräbe, R. P., Kat, C., Van Staden, P. J., and& Els, P. S.
(2020). Difference thresholds for a vehicle on a 4-poster
test rig. Applied Ergonomics/Applied Ergonomics, 87,
103115. https://doi.org/10.1016/j.apergo.2020.103115
Guo, L., Ge, P., and& Sun, D. (2019). Torque Distribution
Algorithm for stability control of electric vehicle driven
by four In-Wheel motors under emergency conditions.
IEEE Access, 7, 104737–104748. https://doi.org/10.11
09/access.2019.2931505
Gysen, B., Paulides, J., Janssen, J., and& Lomonova, E.
(2010). Active electromagnetic suspension system for
improved vehicle dynamics. IEEE Transactions on
Vehicular Technology, 59(3), 1156–1163.
https://doi.org/10.1109/tvt.2009.2038706
Heydrich, M., Ivanov, V., Bertagna, A., Rossi, A.,
Mazzoni, M., and& Bücner, F. (2022). Hardware-in-
the-Loop testing of a hybrid Brake-by-Wire system for
electric vehicles. SAE International Journal of Vehicle
Dynamics, Stability, and NVH, 6(4).
https://doi.org/10.4271/10-06-04-0031
Hori, Y. (2004). Future Vehicle Driven by Electricity and
Control—Research on Four-Wheel-Motored ""UOT
Electric March II."." IEEE Transactions on Industrial
Electronics, 51(5), 954–962.
https://doi.org/10.1109/tie.2004.834944
Ivanov, V., Augsburg, K., Bernad, C., Dhaens, M., Dutré,
M., Gramstat, S., Magnin, P., Schreiber, V., Skrt, U.,
and& Van Kelecom, N. (2019). Connected and shared
X-in-the-Loop technologies for electric vehicle design.
World Electric Vehicle Journal, 10(4), 83.
https://doi.org/10.3390/wevj10040083
Jneid, M. S., and& Harth, P. (2024). Radial Flux In-Wheel-
Motors for vehicle electrification. Cognitive Sustaina-
bility, 3(3). https://doi.org/10.55343/cogsust.105
Kojis, P., Danilevičius, A., Šabanovič, E., and& Skrickij,
V. (2022). The second generation of electric vehicles:
Integrated Corner Solutions. In Lecture notes in
intelligent transportation and infrastructure (pp. 87–
100). https://doi.org/10.1007/978-3-030-94774-3_9
Lauwerys, C., Swevers, J., and& Sas, P. (2005). Robust
linear control of an active suspension on a quarter car
test-rig. Control Engineering Practice, 13(5), 577–586.
https://doi.org/10.1016/j.conengprac.2004.04.018
Li, I., and& Lee, L. (2019). Design and development of an
active suspension system using Pneumatic-Muscle
actuator and intelligent control. Applied Sciences,
9(20), 4453. https://doi.org/10.3390/app9204453
Maher, D., and& Young, P. (2010). An insight into linear
quarter car model accuracy. Vehicle System
Dynamics/Vehicle System Dynamics, 49(3), 463–480.
https://doi.org/10.1080/00423111003631946
Mihalič, F., Truntič, M., and& Hren, A. (2022). Hardware-
in-the-Loop Simulations: A Historical Overview of
Engineering Challenges. Electronics, 11(15), 2462.
https://doi.org/10.3390/electronics11152462
Nguyen, B.-M., and& Trovão, J. P. (2024). Advancing
Automotive Electronics: The Role of Collaborative
Education and Project Development [Automotive
Electronics]. IEEE Vehicular Technology Magazine,
19(3), pp. 116–127. https://doi.org/10.1109/mvt.2024.3
414068
Omar, M., El-Kassaby, M., and& Abdelghaffar, W. (2017).
A universal suspension test rig for electrohydraulic
active and passive automotive suspension system.
Alexandria Engineering Journal /Alexandria
Engineering Journal, 56(4), 359–370. https://doi.org/
10.1016/j.aej.2017.01.024
Šabanovič, E., Kojis, P., Šukevičius, Š., Shyrokau, B.,
Ivanov, V., Dhaens, M., and& Skrickij, V. (2021).
Feasibility of a neural Network-Based virtual sensor for
vehicle unsprung mass relative velocity estimation.
Sensors, 21(21), 7139. https://doi.org/10.3390/s2121
7139
Skrickij, V., Kojis, P., Šabanovič, E., Shyrokau, B., and&
Ivanov, V. (2024). Review of Integrated chassis control
techniques for Automated ground vehicles. Sensors,
24(2), 600. https://doi.org/10.3390/s24020600
Society of Automotive Engineers International. (2012).
Laboratory Testing Machines for Measuring the Steady
State Force And Moment Properties of Passenger Car
Tires (SAE J 1106). https://doi.org/10.4271/J1106_201
208
Stolte, T., Loba, M., Nee, M., Wu, L., and& Maurer, M.
(2023). Toward Fault-Tolerant Vehicle Motion Control
for Over-Actuated Automated Vehicles: A Non-Llinear
Model Predictive Approach. IEEE Access, 11, 10499–
10519. https://doi.org/10.1109/access.2023.3239518
Yu, M., Arana, C., Evangelou, S. A., and& Dini, D. (2019).
Quarter-Car Experimental Study for Series Active
Variable Geometry Suspension. IEEE Transactions on
Control Systems Technology
, 27(2), 743–759.
https://doi.org/10.1109/tcst.2017.2772912
Development and Validation of a Vehicle Corner Test Rig Designed for Hardware-in-the-Loop Testing
365
