
A Clustering Approach for S&P 500 Index Based on Environmental,
Social and Governance Ratings of Multiple Agencies
Celma de Oliveira Ribeiro and Gabriela Curti Geraldo
Departamento de Engenharia de Produção, Escola Politécnica, Universidade de São Paulo, Brazil
Keywords: ESG, Cluster Analysis, Responsible Investing, Ratings.
Abstract: This article addresses the lack of standardization in the assessment of companies' environmental, social and
governance (ESG) practices. To avoid implicit bias in selecting a specific rating, this study suggests using
multiple assessment sources simultaneously to categorize companies as good or bad from an ESG perspective.
Even with the differences in scope, measurement, and weighting between the agencies' methodologies, when
applying the clustering algorithm to the ratings of companies within the S&P 500 index, it was possible to
observe that the groups formed exhibited significantly different average scores for ESG practices. In this way,
this article offers an alternative to mitigate the impact of rating plurality on the results of empirical studies
and on the analysis process conducted by investors.
1 INTRODUCTION
Socially Responsible Investing stands out from other
investment approaches because its investors consider
environmental, ethical, and social impacts, as well as
the corporate governance of the companies they
invest in during the process of analyzing and
evaluating capital applications. Pax World Fund, for
example, was one of the first funds established with
this focus: its investors, opposed to the Vietnam War,
avoided investing in arms and ammunition companies
(Renneboog et al., 2008).
From the 1970s to the present, the industry of so-
called sustainable investments has evolved
significantly, driven not only by legislation but also
by “ethical consumption,” where consumers are
willing to pay a higher price for products that align
with their personal values. The growth of total capital
managed with a socially responsible perspective has
given investors greater influence over the financial
market, while requiring companies to take a clearer
stance on their social, environmental, and governance
practices (Sparkes & Cowton, 2004). The report
“Who Cares Wins” (2004), published by the United
Nations Global Compact, not only officially
introduced the term ESG (Environmental, Social, and
Governance) but also provided guidelines on how to
integrate each of these pillars into portfolio
management processes.
The integration of these aspects into the analyses
conducted by investors was also promoted through
the Principles for Responsible Investment (PRI). The
institution assigned investors the role of main
promoters of the culture of responsible investments
within the financial market and investee companies;
the network of associates is committed to
incorporating practices that consider socio-
environmental and governance aspects into their
investment processes (Hoepner et al., 2021;
Principles For Responsible Investment, 2021).
The incorporation of ESG aspects into the
investment decision-making process occurs in several
ways: ESG Integration, which involves the explicit
inclusion of environmental, social, and governance
aspects in the financial analysis of companies, is the
most widely used method globally, followed by
negative screening, which consists of excluding
certain countries or sectors from the universe of
investable stocks (Ciciretti et al., 2023; Global
Sustainable Investment Alliance, 2020; van Duuren
et al., 2016; Kotsantonis et al., 2016). Another form
of integration, derived from the latter, is positive
screening. Also called “best in class,” this strategy
involves investing only in companies with exemplary
ESG practices compared to others (Bertelli &
Torricelli, 2024). Corporate engagement is the third
most widely used strategy. It involves engaging with
the top management of companies to address
environmental, social, and governance issues
(Dimson et al., 2015; Barko et al., 2022).
Ribeiro, C. O. and Geraldo, G. C.
A Clustering Approach for S&P 500 Index Based on Environmental, Social and Governance Ratings of Multiple Agencies.
DOI: 10.5220/0013211200003956
In Proceedings of the 7th International Conference on Finance, Economics, Management and IT Business (FEMIB 2025), pages 29-37
ISBN: 978-989-758-748-1; ISSN: 2184-5891
Copyright © 2025 by Paper published under CC license (CC BY-NC-ND 4.0)
29

The effectiveness, from the perspective of
investor returns, of these ways of incorporating
environmental and social aspects of governance into
portfolio management is widely debated. Bertelli &
Torricelli (2024), when analyzing screening
strategies (both positive and negative) in the
European stock market from 2007 to 2021, conclude
that to achieve significant returns using this strategy,
investors need to focus on a longer investment time
horizon and be willing to relax the rigor of their
exclusions.
Still on the application of the screening strategy,
Wang et al. (2022) observe that, in the Chinese stock
market, portfolios constructed using this method have
a worse Sharpe ratio and return compared to others.
The authors also conclude that screening translates
into a more conservative approach to investing, which
ends up accommodating the preferences of investors
who are averse to high levels of risk.
In contrast to incorporating ESG aspects into the
investment process through screening which, by
limiting the universe of potential investments, ends
up compromising the portfolio diversification process
(Bertelli & Torricelli, 2024), the engagement strategy
with companies tends not to cause this “damage” to
the investor, since in this approach, the investor
generally uses his influence as a shareholder to
encourage senior management to implement changes
within the company (Adebowale & Onipe Adabenege
Yahaya, 2024; Schanzenbach & Sitkoff, 2020).
Regardless of the approach used, incorporating
socio-environmental and governance factors into the
investment analysis process involves evaluating non-
financial elements of companies, such as the impact
of their activities and the efficiency of their practices
in ESG dimensions (van Duuren et al., 2016). The
difficulty in obtaining standardized information about
companies’ socio-environmental conduct, coupled
with the discrepancies between the methodologies
and attributes considered by each financial market
agent, can make assessment from this perspective
controversial. The lack of consensus on the best way
to qualify (or disqualify) a company’s environmental,
social, and governance practices diminishes the effect
of allocations made by socially responsible investors
and, consequently, reduces the impact on the financial
performance of investments (Billio et al., 2021).
When analyzing the relationship between investor
behavior and uncertainty regarding the quality of
socio-environmental and governance practices of
potential investees, Avramov et al. (2020)
corroborate the idea that the variability of valuations
can distort the relationship between risk and return on
assets. They conclude that uncertainty is related to a
reduction in demand for risky assets and an increase
in the market premium required by investors.
The development of the sustainable investment
market has made agents in this universe prepare to
meet demands related to this topic. Rating agencies
began to include ESG aspects in their analyses and
subsequently started publishing specific scores for
each of the dimensions considered (environmental,
social and governance). However, each rating agency
developed its own methodology for evaluating ESG
practices, using the data and information they deemed
appropriate for this purpose. Furthermore, the scale
used to rank companies also differs depending on the
rating provider, making it even more difficult for
investors to compare assessments (Billio et al., 2021).
When investigating the reasons for the
discrepancy between assessments, Berg et al. (2022)
identified three sources of dissonance: Scope,
Measurement, and Weighting. The first refers to the
fact that ratings can be generated from different sets
of attributes; for example, to evaluate the
Environmental sphere, one agency may consider the
amount of energy used per unit of product produced,
while another may use the amount of carbon emitted
per unit of revenue generated. The second source of
divergence (Measurement) concerns how agencies
use different indicators to evaluate the same attribute;
the quality of the Company’s internal policies can be
assessed based on the number of labor actions it has
open or based on employee turnover, for example.
The third source (Weighting) consists of differences
in perception about the relevance of attributes to a
company’s score — in one assessment, the weight
attributed to waste management may be greater than
that attributed to water consumption, for example,
and vice versa for another agency.
By comparing the ratings assigned by six
agencies, Avramov et al. (2020) confirmed the
variation in scores from different providers, finding
an average correlation between them of just 0.48.
Considering some other agencies, Berg et al. (2022)
observed that the average correlation between the
grades awarded was 0.54, also finding that
measurement was the main source of divergence
between grades, followed by scope and weighting.
Regardless of their origins, the discrepancies
observed make it difficult to analyze the performance
(from an ESG perspective) of companies and harm
the market reading carried out by companies
regarding how their initiatives on the topic are being
perceived by the investment industry. Furthermore,
the dissonance between ratings is an obstacle to
empirical studies, as the choice of which assessment
will be used can significantly impact the results and
FEMIB 2025 - 7th International Conference on Finance, Economics, Management and IT Business
30

conclusions obtained (Berg et al., 2022). From De
Spiegeleer et al. (2023), for example, when
comparing the results obtained using the ratings of
two different agencies (MSCI and Sustainalytics) in
the mean-variance model with restrictions, concluded
that the impact of including ESG aspects on portfolio
performance depends on the source of the rating used
to measure the restrictions.
In the literature, there are records of different
ways to address the lack of standardization in the
assessments of companies’ environmental, social,
and governance aspects. Some researchers choose to
select ESG ratings from a specific agency ((López
Prol & Kim, 2022), (Shanaev & Ghimire, 2022),
(Broadstock et al., 2021)); others, in addition to using
rating providers, create their own assessments of
socio-environmental and governance practices: Chen
et al. (2021), for example, used a data envelope
analysis model (Data Envelopment Analysis – DEA)
to recalculate companies’ ESG scores. Pedersen et al.
(2021) chose to use, in addition to the ratings
provided by a specialized agency (MSCI), specific
assumptions for each of the dimensions considered
(environmental, social and governance).
In the context of the impact of the lack of
standardization of ratings, this work aims to
contribute to the debate by offering a solution through
clustering companies based on the ESG ratings
assigned to them by multiple agencies. By using the
clustering method presented, it is possible to
categorize companies as good or bad from an ESG
perspective, while simultaneously avoiding implicit
bias in selecting ratings from a specific agency. In this
way, this article suggests an alternative approach to
mitigate the impact of rating plurality both on the
results of empirical studies and on the decision-
making process of investors.
2 METHODOLOGY
Based on the ESG scores of listed companies, the K-
means algorithm was used to classify stocks as good
or bad — an approach similar to that seen in Sariyer
& Taşkın (2022) and Pranata (2023).
2.1 K-Means Clustering
Clustering techniques allow data to be separated so
that it is possible to observe similarities among
members of the same set and differences between
those belonging to different groups. Grouping
elements based on a similar characteristic can help
identify other common characteristics among
members of the same group (James et al., 2013).
Among the methodologies employed in
combinatorial clustering algorithms, there are two
widely applied methods: the partition-based method
and the hierarchy-based method. According to Jain
(2010) and Reddy & Vinzamuri (2018), the first one
iteratively searches for groups aiming to optimize an
objective function, in order to improve the quality of
the grouping performed. The hierarchical method, in
turn, has two major approaches: the top-down
approach, where all data starts in a large group and is
recursively partitioned into smaller groups until each
analyzed data is assigned to a cluster; and the
agglomeration method, in which each data is a group;
iteratively, pairs of groups are merged, until a
hierarchy of groups is formed.
The variables used in the grouping process are
distributed into two large groups: quantitative and
qualitative. The distinction between these two types
is crucial in choosing the methodology to be applied,
as methods efficient for one category of data may be
less effective for the other (McCullagh, 1980); the
ratings used in this study are examples of ordinal
qualitative data.
One way to resolve the issue of the absence of a
distance metric between ordinal data is to treat them
as numerical data, that is, as consecutive integers, to
preserve the information that certain values are better
than others (Gentle et al., 1991; Zhang & Cheung,
2020). In this study, qualitative ratings were
converted to a numerical scale, so that the lowest
score of each rating provider was assigned the value
1, and to this value, one unit per notch was added up
to the highest existing score on each agency’s scale.
Once a way of measuring the distance between the
data was established, it was possible to use the K-
means algorithm to perform the partition.
The K-means method aims to separate the data
into a predetermined number of groups, with the
objective of obtaining the minimum desirable
distance between the data and the centroid of each
group. Given the number of desired clusters (𝐾) and
an initial set of centroids, the algorithm calculates, at
each iteration, the distance between each data and
each of the centers. In K-means clustering, the
objective function (𝑭) to be minimized is generally
the sum of the squared errors; that is, for each point
belonging to each group (𝐺
):
𝑭(𝑮) =
(
𝑔
−𝑥
)
∈
(1)
A Clustering Approach for S&P 500 Index Based on Environmental, Social and Governance Ratings of Multiple Agencies
31

Where the midpoint of cluster K is 𝑔
. Once the
defined convergence condition is not met, the
algorithm updates the position of each group's
centroid to the average of the points belonging to it
and performs the distance calculation again until
minimizing its objective function (Hastie et al., 2001;
Reddy & Vinzamuri, 2018; Jain, 2010). The
algorithm is summarized below:
Algorithm 1: K-means method algorithm.
Defining the number of clusters (K) used in the
classification algorithm is one of the main challenges
in the data separation process. One of the metrics used
to assess clustering quality is the Silhouette Score,
which measures how close each element in a cluster
is to an element in another cluster. The score in
question varies from [-1,1], with results closer to 1
indicating a better classification of the data
(Shahapure & Nicholas, 2020; Sariyer & Taşkın,
2022; Dudek, 2020). The Silhouette Score was used
in this work to assess whether the classification of
data into two large groups was indeed the best
possible for the sample used.
Thus, using the ratings provided by various
agencies for the environmental, social, and
governance aspects of companies, it was possible to
divide the analyzed shares into two groups: 𝐾
,
formed by 𝑁
shares of companies considered good
from an ESG perspective, and 𝐾
, formed by 𝑁
companies considered bad from the same angle;
companies that did not have an ESG rating from at
least one of the agencies considered were removed
from the universe of shares analyzed in this study.
2.2 ESG Ratings
To classify the companies, ratings from three
agencies were used: MSCI, S&P Global, and
Bloomberg. Each rating provider has its own set of
scope, measurement, and weighting for granting the
ESG score.
The MSCI agency uses public data to feed its
methodology, which assesses not only each
company’s exposure to socio-environmental and
governance risks that are material to its sector of
activity, but also the way in which the company
manages these risks. The topics evaluated are
weighted according to their impact and urgency
within each sector. The final score reflects how the
company is positioned (either as a leader or a laggard)
relative to others in its sector. Thus, even companies
operating in sectors that generate greater negative
externalities can obtain a good score if their practices
and their socio-environmental and governance risks
are considered better than others in the sector (MSCI
Inc, 2020).
The ratings provided by Bloomberg are also
derived from public data. However, the agency’s
methodology seeks to assess how each company
manages socio-environmental and governance issues
that are financially material to the continuity of its
activities. In addition, the agency analyzes the
magnitude, probability, and timing of the impact of
these issues on the company being evaluated. The
final ESG score is a combination of the scores for
each of the dimensions (Environmental, Social, and
Governance). The weight assigned to the
Environmental and Social pillars varies according to
the relevance of each of them for each industry
evaluated. The weight of the Governance score, in
turn, is the same for all sectors, as the agency
considers that country-specific factors in which each
company operates are more relevant to the evaluated
dimension than the sector in which the company
operates (Bloomberg, 2023).
Finally, S&P Global uses, when available, its own
questionnaire, (The S&P Global Corporate
Sustainability Assessment (CSA)), together with
public data when assigning its ratings. The agency’s
methodology also considers the materiality (impact,
probability, and timing) of each issue for the company
being evaluated, the ecosystem it comprises, and its
stakeholders. The indicators analyzed are
standardized across sectors and aggregated in a
weighted manner to form the final rating, which then
undergoes new standardization (S&P Dow Jones
Indices, 2023; S&P Global, 2022).
3 RESULTS AND DISCUSSION
The initial steps in applying the proposed
methodology involve data collection and processing.
The ESG scores from the S&P, MSCI, and
Bloomberg agencies were extracted from the
Bloomberg terminal, along with the market data of
the analyzed companies (price, total return, volatility,
and market capitalization). Stocks that had ratings
from only one or two of the agencies were excluded
from the analysis.
1. Define the number K of groups.
2. Make an initial guess about the position of the K- centroids.
3. Calculate the distance of each point to the corresponding centroid of its group.
4.
As long as the distance between each point and its centroid exceeds the
convergence criterion:
Calculate the average of the points in each group and update the value of
the K-centroids;
Determine K groups, allocating each data point to its closest centroid;
FEMIB 2025 - 7th International Conference on Finance, Economics, Management and IT Business
32
In order to separate the impact of the COVID-19
pandemic, two-time intervals were analyzed, namely:
January 2016 to December 2019 and January 2020 to
December 2023. In both periods, the initial universe
of shares considered in the analysis comprised all
companies that were part of the S&P 500 during the
analyzed interval; those companies that became part
of (or ceased to be part of) the index at any point
during these time windows were also excluded from
the analysis.
3.1 Obtained Clusters
The groups were obtained using the Scikit-learn
library in Python. After preparing the database, the
ESG ratings from three agencies were used as input
for 360 companies in the first period (January 2016 to
December 2019) and 420 companies in the second
period (January 2020 to December 2023).
The grouping was carried out in order to classify
the shares into two groups: one group with the shares
of companies considered good from an
environmental, social, and governance perspective,
and another with those considered bad in this regard.
The Silhouette Score, used to indicate the optimal
number of clusters, confirmed that partitioning into
two groups would be ideal (Figure 01).
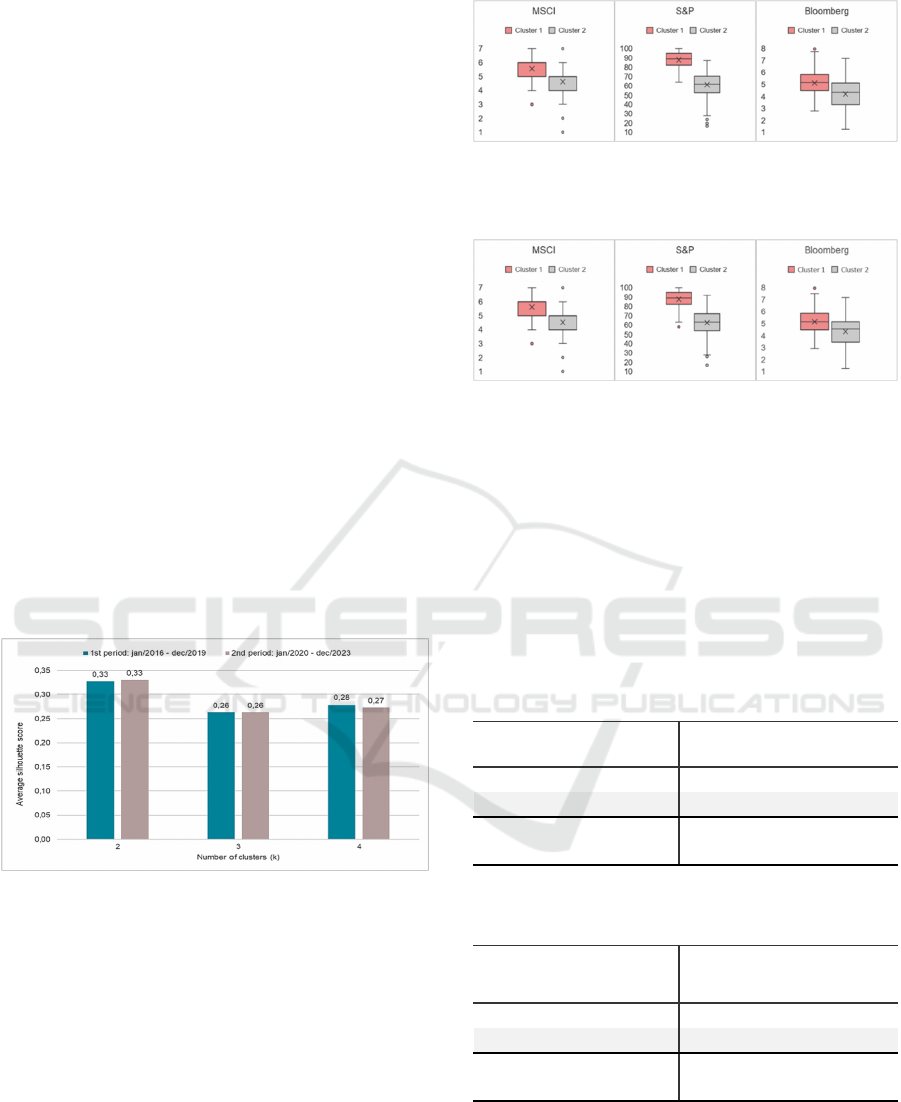
Figure 1: Silhouette score for different numbers of clusters.
Thus, two clusters were constructed for each
evaluated period. Although it is possible to note an
overlap between the ratings of the groups — a
consequence of the difficulty in grouping companies
based on the evaluations of the different agencies —
a distinction between the clusters can also be
observed based on their average scores (Figures 2 and
3); the grouping carried out based on the ESG scores
of the shares resulted in statistically different groups
(Tables 1 and 2).
Figure 2: Distribution, by agency, of the scores of each
cluster of the shares considered in the period from
January/2016 to December/2019.
Figure 3: Distribution, by agency, of the scores of each
cluster of the shares considered in the period from
January/2020 to December/2023.
In both periods analyzed, cluster 1 (defined as
𝐾
) presents, for the three agencies considered, an
average score than cluster 2 (defined as 𝐾
), in
addition, in both intervals, the number of shares
classified as better from an ESG perspective was
greater than those classified as worse (Tables 1 and
2).
Table 1: Average agency scores by cluster from
January/2016 to December/2019.
Table 2: Average agency scores by cluster from
January/2020 to December/2023.
Regarding the sectors in which the companies
operate, those belonging to the sectors (based on the
classification established by The Global Industry
Classification Standard (MSCI and S&P Dow Jones
Indices LLC, 2023)) of healthcare, industry (capital
goods), technology, basic consumption, materials,
MS CI S &P Bloomberg
1 (Kgood)
254 5,6 87,8 5,1
2 (Kbad)
174 4,6 61,3 4,2
Significance of the
difference
p-val ue
0,00 0,00 0,00
Agencies
Number of
shares
Cluster
MS CI S &P Bloomberg
1 (Kgood)
221 5,6 87,4 5,2
2 (Kbad)
139 4,5 62,6 4,3
Significance of the
difference
p-val ue
0,00 0,00 0,00
Cluster
Number of
shares
Agencies
A Clustering Approach for S&P 500 Index Based on Environmental, Social and Governance Ratings of Multiple Agencies
33

communication services and real estate were
predominantly allocated to the cluster with the best
average socio-environmental and governance scores,
while most of the companies analyzed from the
utilities, discretionary consumption, and energy (oil
and gas) sectors were assigned to the cluster with the
worst ESG performance (Tables 3 and 4).
Table 3: Number of companies belonging to each cluster by
sector of activity for the first period (January/2016 to
December/2019).
Table 4: Number of companies belonging to each cluster by
sector of activity for the second period (January/2020 to
December/2023).
The group formed by shares with the best ESG
ratings (𝐾
) showed, in relation to the group
composed of shares with the worst ESG ratings
(𝐾
), a higher average return between the years
2016 and 2020 (Table 4); however, from 2021
onwards, this behavior changed, and the so-called bad
cluster began to show greater profitability. A similar
dynamic occurred with the risk indicator (volatility)
of the groups (Table 5), indicating a shift in behavior
during the second period analyzed: the group with
companies holding the worst ESG scores exhibited
the highest average volatility in the period. Despite
these observations, the groups do not show
statistically significant differences when compared in
terms of average volatility and average return.
Table 5: Total Return at the end of the year.
Table 6: Volatility.
The average correlation within each group also
increased from the first to the second period analyzed
(Table 6), even though 80% of the shares considered
were present in both periods’ samples. This change in
the metric level hinders the diversification process
and results in more risk for efficient portfolios.
Table 7: Average correlation of each group by period.
4 CONCLUSION
The sustainable investment industry has evolved
significantly, driven by legislation, consumer
demand, and the investors themselves. Including
socio-environmental and governance factors in the
investment analysis process often implies assessing
non-financial elements of companies, which, in turn,
makes it challenging to reach a consensus on the best
way to qualify (or disqualify) a company’s ESG
practices.
The lack of standardization of metrics for
evaluating companies’ environmental, social and
governance practices, and the challenges in
comparing the scores given by evaluators, were
addressed in this work by grouping stocks based on
the ratings provided by multiple agencies.
Cluster 01 (K
good
) Cluster 02 (K
bad
)
Communication Services 9
7
Consumer Discretionary 18
19
Consumer Staples 18 15
Ene rgy 9
10
Financials 28
28
Health Care 40
5
Industrials 31
22
Information Technology 30
9
Materials 12
7
Real Estate 16
5
Utilities 10 12
1
st
period: jan/2016 - dec/2019
Sector
Cluster 01 (Kgood) Cluster 02 (Kbad)
Communication Services 11
9
Consumer Discretionary 23
21
Consumer Staples 20 15
Ene rgy 9
11
Financials 30
33
Health Care 45
10
Industrials 34
30
Information Technology 39
13
Materials 14 11
Real Estate 19
5
Utilities 10 16
Sector
2
nd
period: jan/2020 - dec/2023
2016 2017 2018 2019 2020 2021 2022 2023
Me an
17% 24% -5% 33% 19% 30% -10% 15%
Mi n
-41% -24% -53% -21% -44% -37% -65% -48%
Ma x
227% 100% 47% 119% 302% 142% 94% 246%
Std. Dev.
26% 23% 20% 21% 35% 26% 26% 32%
Me an
16% 22% -7% 29% 14% 32% -6% 18%
Mi n
-27% -43% -57% -28% -57% -37% -68% -44%
Ma x
72% 133% 41% 91% 743% 196% 119% 184%
Std. Dev.
17% 24% 19% 22% 63% 34% 29% 32%
Significance of the
difference
(for mean)
p-value 0,79 0,47 0,30 0,07 0,30 0,62 0,22 0,35
Clus ter 1 (K
good
)
Cluster 2 (K
bad
)
2016 2017 2018 2019 2020 2021 2022 2023
Me an
27% 21% 25% 26% 45% 29% 32% 29%
Mi n
15% 12% 16% 15% 27% 15% 17% 15%
Ma x
66% 42% 46% 49% 99% 61% 72% 69%
Std. Dev.
9% 6% 6% 7% 12% 8% 9% 8%
Me an
27% 21% 25% 25% 48% 30% 33% 30%
Mi n
15% 11% 14% 14% 22% 14% 20% 17%
Ma x
83% 45% 47% 50% 107% 66% 72% 61%
Std. Dev.
9% 6% 6% 7% 14% 10% 10% 8%
Significance of the
difference (for
mean)
p-value 0,64 0,66 0,94 0,66 0,02 0,03 0,38 0,64
Clus ter 1 (K
good
)
Cluster 2 (K
bad
)
Clus ter
1st Period
(2016 - 2019)
2ºnd Period
(2020 - 2023)
1 (Kgood)
0,281 0,428
2 (Kbad)
0,276 0,438
FEMIB 2025 - 7th International Conference on Finance, Economics, Management and IT Business
34

The groups formed exhibited significantly
different average scores for ESG practices. Thus,
despite the differences in methodologies, metrics, and
scales used by the rating agencies, it was possible to
differentiate between the good companies and the bad
ones (from an ESG perspective). While there is some
overlap between the ratings of the groups — due to
the challenge of grouping companies based on
evaluations from different agencies, a clear
distinction between the clusters could still be
observed. Therefore, this study contributes to the
literature and the investment process by offering an
alternative that reduces the impact caused by
choosing to use assessments from a single ratings
provider.
Regarding the sectors in which the companies
operate, those in healthcare, industry, technology,
consumer staples, materials, communication services,
and real estate were mainly allocated to the cluster
with the highest average socio-environmental and
governance scores. In contrast, most of the companies
from the utilities, consumer discretionary, and energy
(oil and gas) sectors were assigned to the cluster with
the poorest ESG performance.
Future research could investigate other attributes,
such as market capitalization, cost of capital, or
metrics related to companies' operational
performance, to identify the characteristics common
to the members of each cluster. Additionally, it could
explore how these characteristics compare between
companies operating in the same sector but belonging
to different clusters. Upcoming work could also
investigate the particularities of each sector
(especially those dominated by stocks from a specific
group) to understand what makes a sector and a
company good from environmental, social and
governance point of view.
Another dilemma concerning socially responsible
investments is whether a portfolio built around
sustainable guidelines can still deliver a good risk and
return relationship to the investors. When considering
the average volatility and return of the shares in each
cluster, the groups were not statistically significantly
different. However, the results pointed to a change in
the behavior of assets during and after the coronavirus
pandemic.
The group of stocks with the highest ESG ratings
showed a higher average return between 2016 and
2020 compared to the group with the lowest ESG
ratings. From 2021 onward, this pattern shifted, and
the 'worst' cluster started to slightly outperform in
terms of the group's average profitability. A similar
pattern was observed with the risk indicator (average
volatility) across the groups, reflecting a shift in
behavior during the second period analyzed: the
group of companies with the lowest ESG scores
showed the highest average volatility. In addition to
that, the results of this study revealed that the average
correlation within each group also increased from the
first to the second period analyzed – this shift could
have negatively impacted the portfolio diversification
dynamics at the time.
In this context, future research could investigate
how portfolios made up of these assets would behave,
over a range of time periods or in specific moments
of high market stress, in order to try to verify whether
assets considered good from an ESG perspective
could offer better returns or lower risks to the
investor. In addition to that, upcoming work could
explore the shift in dynamics during and after the
COVID-19 pandemic and how it impacted the risk
and return relationship of portfolios.
REFERENCES
Adebowale, M., & Onipe Adabenege Yahaya. (2024). The
Impact of Shareholder Activism on Firm Value.
Organizations and Markets in Emerging Economies, 15,
209–250.
Avramov, D., Cheng, S., Lioui, A., & Tarelli, A. (2020).
Investment and Asset Pricing with ESG Disagreement.
SSRN Electronic Journal. https://doi.org/10.2139/ssrn.3
711218.
Barko, T., Cremers, M., & Renneboog, L. (2022).
Shareholder Engagement on Environmental, Social, and
Governance Performance. Journal of Business Ethics,
180(2), 777–812. https://doi.org/10.1007/s10551-021-
04850-z.
Berg, F., Kölbel, J. F., & Rigobon, R. (2022). Aggregate
Confusion: The Divergence of ESG Ratings. Review of
Finance, 26(6), 1315–1344. https://doi.org/10.1093/
rof/rfac033.
Bertelli, B., & Torricelli, C. (2024). The trade-off between
ESG screening and portfolio diversification in the short
and in the long run. Journal of Economics and Finance.
https://doi.org/10.1007/s12197-023-09652-9.
Billio, M., Costola, M., Hristova, I., Latino, C., & Pelizzon,
L. (2021). Inside the ESG ratings: (Dis)agreement and
performance. Corporate Social Responsibility and
Environmental Management, 28(5), 1426–1445.
https://doi.org/10.1002/csr.2177.
Bloomberg. (2023). Bloomberg ESG Scores - Overview &
FAQ. https://hr.bloombergadria.com/data/files/Pitanja%
20i%20odgovori%20o%20Bloomberg%20ESG%20Sco
reu.pdf.
Broadstock, D. C., Chan, K., Cheng, L. T. W., & Wang, X.
(2021). The role of ESG performance during times of
financial crisis: Evidence from COVID-19 in China.
Finance Research Letters, 38, 101716. https://doi.org/
10.1016/j.frl.2020.101716.
A Clustering Approach for S&P 500 Index Based on Environmental, Social and Governance Ratings of Multiple Agencies
35

Chen, L., Zhang, L., Huang, J., Xiao, H., & Zhou, Z. (2021).
Social responsibility portfolio optimization incorporating
ESG criteria. Journal of Management Science and
Engineering, 6(1), 75–85. https://doi.org/10.1016/j.jm
se.2021.02.005.
Ciciretti, R., Dalò, A., & Dam, L. (2023). The contributions
of betas versus characteristics to the ESG premium.
Journal of Empirical Finance, 71, 104–124.
https://doi.org/10.1016/j.jempfin.2023.01.004.
De Spiegeleer, J., Höcht, S., Jakubowski, D., Reyners, S., &
Schoutens, W. (2023). ESG: a new dimension in
portfolio allocation. Journal of Sustainable Finance &
Investment, 13(2), 827–867. https://doi.org/10.1080/2
0430795.2021.1923336.
Dimson, E., Karakaş, O., & Li, X. (2015). Active Ownership.
Review of Financial Studies, 28(12), 3225–3268.
https://doi.org/10.1093/rfs/hhv044.
Dudek, A. (2020). Silhouette Index as Clustering Evaluation
Tool (pp. 19–33). https://doi.org/10.1007/978-3-030-
52348-0_2.
Gentle, J. E., Kaufman, L., & Rousseuw, P. J. (1991). Finding
Groups in Data: An Introduction to Cluster Analysis.
Biometrics, 47(2), 788. https://doi.org/10.2307/2532178.
Global Sustainable Investment Alliance. (2020). Global
Sustainable Investment Review 2020.
Hastie, T., Friedman, J., & Tibshirani, R. (2001). The
Elements of Statistical Learning. Springer New York.
https://doi.org/10.1007/978-0 387-21606-5.
Hoepner, A. G. F., Majoch, A. A. A., & Zhou, X. Y. (2021).
Does an Asset Owner’s Institutional Setting Influence Its
Decision to Sign the Principles for Responsible
Investment? Journal of Business Ethics, 168(2), 389–
414. https://doi.org/10.1007/s10551-019-04191-y.
Jain, A. K. (2010). Data clustering: 50 years beyond K-
means. Pattern Recognition Letters, 31(8), 651–666.
https://doi.org/10.1016/j.patrec.2009.09.011.
James, G., Witten, D., Hastie, T., & Tibshirani, R. (2013). An
Introduction to Statistical Learning (Vol. 103). Springer
New York. https://doi.org/10.1007/978- 1-4614-7138-7.
Kotsantonis, S., Pinney, C., & Serafeim, G. (2016). ESG
Integration in Investment Management: Myths and
Realities. Journal of Applied Corporate Finance 28.2
(2016), 28(2), 10–16.
López Prol, J., & Kim, K. (2022). Risk-return performance
of optimized ESG equity portfolios in the NYSE.
Finance Research Letters, 50, 103312.
https://doi.org/10.1016/j.frl.2022.103312.
McCullagh, P. (1980). Regression Models for Ordinal Data.
Journal of the Royal Statistical Society: Series B
(Methodological), 42(2), 109–127.
https://doi.org/10.1111/j.2517-6161.1980.tb01109.x.
MSCI and S&P Dow Jones Indices LLC. (2023, March 17).
Global Industry Classification Sector (GICS®).
https://www.msci.com/documents/1296102/11185224/
GICS+Sector Definition s+2023.Pdf/822305c6-F821-
3d65-1984-6615ded81473 T=1679088764288.
MSCI Inc. (2020). MSCI ESG Ratings. https://www.msci.
com/documents/1296102/21901542/MSCI+ESG+Ratin
gs+Brochur e-cbr-en.pdf.
Pedersen, L. H., Fitzgibbons, S., & Pomorski, L. (2021).
Responsible investing: The ESG-efficient frontier.
Journal of Financial Economics, 142(2), 572–597.
https://doi.org/10.1016/j.jfineco.2020.11.001.
Pranata, K. S., Gunawan, A. A. S., & Gaol, F. L. (2023).
Development clustering system IDX company with k-
means algorithm and DBSCAN based on fundamental
indicator and ESG. Procedia Computer Science, 216,
319–327. https://doi.org/10.1016/j.procs.2022.12.142.
Principles For Responsible Investment. (2021). Principles
For Responsible Investment.
Reddy, C., & Vinzamuri, B. (2018). Data Clustering (C. C.
Aggarwal & C. K. Reddy, Eds.). Chapman and
Hall/CRC. https://doi.org/10.1201/9781315373515.
Renneboog, L., Ter Horst, J., & Zhang, C. (2008). Socially
responsible investments: Institutional aspects,
performance, and investor behavior. Journal of Banking
& Finance, 32(9), 1723–1742. https://doi.org/10.1016/
j.jbankfin.2007.12.039.
Sariyer, G., & Taşkın, D. (2022). Clustering of firms based
on environmental, social, and governance ratings:
Evidence from BIST sustainability index. Borsa Istanbul
Review, 22, S180–S188. https://doi.org/10.1016/j.bir.20
22.10.009.
Schanzenbach, M. M., & Sitkoff, R. H. (2020). ESG
Investing: Theory, Evidence, and Fiduciary Principles.
Journal of Financial Planning.
Shahapure, K. R., & Nicholas, C. (2020). Cluster Quality
Analysis Using Silhouette Score. 2020 IEEE 7th
International Conference on Data Science and Advanced
Analytics (DSAA), 747–748. https://doi.org/10.1109/
DSAA49011.2020.00096.
Shanaev, S., & Ghimire, B. (2022). When ESG meets AAA:
The effect of ESG rating changes on stock returns.
Finance Research Letters, 46, 102302.
https://doi.org/10.1016/j.frl.2021.102302.
S&P Dow Jones Indices. (2023). S&P DJI ESG Score
Methodology. https://www.spglobal.com/spdji/en/docu
ments/methodologies/methodology-sp-esg-index-series.
pdf.
S&P Global. (2022). S&P Global ESG Scores. Ahead of
disclosures, in front of standards. https://www.spglobal.
com/esg/documents/sp-global-esg-scores-brochure-202
2.pdfutm_medium=cpc&utm_source=google&utm_ca
mpaign=Brand_ESG_Search&utm_term=s&p&global
&esg&ratings&methodology&utm_conent=534418150
272&gclid=CjwKCAjw5v2wBhBrEiwAXDDoJdEJ7O
MAjETcU0VF1xaukkJ9RJTPFqLoaB7ENO2ZmMCqz
2z0t2OUBoC36kQAvD_BwE.
Sparkes, R., & Cowton, C. J. (2004). The Maturing of
Socially Responsible Investment: A Review of the
Developing Link with Corporate Social Responsibility.
Journal of Business Ethics, 52(1), 45–57.
https://doi.org/10.1023/B:BUSI.0000033106.43260.99.
UN Global Compact Initiative. (2004). Who Cares Wins —
Connecting Financial Markets to a Changing World.
van Duuren, E., Plantinga, A., & Scholtens, B. (2016). ESG
Integration and the Investment Management Process:
Fundamental Investing Reinvented. Journal of Business
FEMIB 2025 - 7th International Conference on Finance, Economics, Management and IT Business
36

Ethics, 138(3), 525–533. https://doi.org/10.1007/s10551-
015-2610-8.
Wang, Z., Liao, K., & Zhang, Y. (2022). Does ESG
Screening Enhance or Destroy Stock Portfolio Value?
Evidence from China. Emerging Markets Finance and
Trade, 58(10), 2927–2941. https://doi.org/10.1080/
1540496X.2021.2014317.
Zhang, Y., & Cheung, Y. (2020). An Ordinal Data Clustering
Algorithm with Automated Distance Learning.
Proceedings of the AAAI Conference on Artificial
Intelligence, 34(04), 6869–6876. https://doi.org/10.1609/
aaai.v34i04.6168.
A Clustering Approach for S&P 500 Index Based on Environmental, Social and Governance Ratings of Multiple Agencies
37
