
Recommender Systems Approaches for Software Defect Prediction:
A Comparative Study
Ahmed-Reda Rhazi
1
, Oumayma Banouar
1
, Fadel Toure
2
and Said Raghay
1
1
Laboratory of Applied Mathematics and Computer Science, Faculty of Sciences and Techniques,
Cadi Ayyad University, Marrakesh, Morocco
2
Laboratory IT, Statistics, and Transdisciplinary Smart Technologies, University of Quebec,
Trois-Rivi
`
eres, Quebec, Canada
Keywords:
Software Defect Prediction, Recommender Systems, Software Metrics, Classes Similarities, Classes
Recommendation for Unit Tests.
Abstract:
Defects prediction is an important step in the software development life cycle. Projects involving thousands
of classes require the writing of unit tests for a significant number of classes, which is a costly and time-
consuming process. Some research projects in this area have tried to predict defect-prone classes in order to
better allocate testing effort in the relevant components. Algorithms such as neural networks and ensemble
learning have been used to classify the project classes. Based on similarities, Recommender systems (RS)
allow users to have customized recommendations in different domains, such as social media and e-commerce.
This paper explores the usage of recommender systems in the prediction of software defects. Using a dataset
of 14 open source systems containing 5883 Java classes, we compared the performance of content-based RS
approaches applied to software defect prediction using software metrics as features, with classic classification
algorithms such as SVM, KNN, and ensemble learning algorithms. For the Content-based approach, the
similarities are computed between software classes first with the standard software metrics and then with PCA
(principal component analysis) extracted components. Finally, by aggregating the top-N most similar classes,
the approach is capable of predicting whether the current class is defect-prone or not. The comparison is made
using the Accuracy, Precision, and F-1 Score. The results show that the recommender systems approach can
be a viable alternative to traditional machine learning methods in the classification and prediction of software
defect classes.
1 INTRODUCTION
Defect prediction is an important aspect of the soft-
ware development life cycle, especially for large
projects that encompass thousands of classes, where
writing unit tests for each class can be both a time-
and resource-consuming process. To address this is-
sue, various research efforts have focused on pre-
dicting which classes are likely to be defect-prone.
These studies frequently utilize algorithms like neu-
ral networks (Tahir et al., 2021) and ensemble learn-
ing techniques ((Zamani et al., 2014), (Kumar and
Chaturvedi, 2024)) to classify project classes based
on their features. By effectively locating potentially
problematic classes, these approaches can improve
testing efficiency, lower costs, and ultimately improve
software quality.
Although recommender systems have shown
promise in various domains, their application in soft-
ware defect-prone prediction remains relatively lim-
ited. Most of the research in this area has focused
mainly on traditional machine learning and classifica-
tion techniques (Toure et al., 2017) to identify defect-
prone classes based on software metrics and historical
defect data.
Recommender systems in this context aim to sug-
gest potentially defect-prone classes based on his-
torical data and patterns, leveraging collaborative or
content-based filtering methods to identify similari-
ties across projects or classes. They excel in scenar-
ios with rich historical data, helping prioritize test-
ing efforts. Recommender systems have become es-
sential to deliver personalized content experiences to
users who constantly navigate overwhelming volumes
of information across numerous platforms (Zegzouti
et al., 2023). Based on similarities, these systems rev-
olutionize how users find relevant content. Efficient
recommender systems remain on an efficient person-
414
Rhazi, A.-R., Banouar, O., Toure, F. and Raghay, S.
Recommender Systems Approaches for Software Defect Prediction: A Comparative Study.
DOI: 10.5220/0013211700003928
In Proceedings of the 20th International Conference on Evaluation of Novel Approaches to Software Engineering (ENASE 2025), pages 414-424
ISBN: 978-989-758-742-9; ISSN: 2184-4895
Copyright © 2025 by Paper published under CC license (CC BY-NC-ND 4.0)

alization process. These systems do not satisfy an in-
formation request, but should include users’ prefer-
ences and items’ similarities to personalize their re-
sults. Recommender systems employ several core ap-
proaches to effectively tailor suggestions. These ap-
proaches are classified into three classes. Content-
based filtering ((Kolahkaj et al., 2020), (Pushpendu
et al., 2024)) recommends items based on similarity
in item characteristics, while collaborative filtering
((Najmani et al., 2022), (Wu, 2024)) relies on patterns
in user interactions, either by matching users with
similar preferences or by suggesting items that are of-
ten enjoyed together. Hybrid approaches ((Banouar
and Raghay, 2018), (Ouedrhiri et al., 2022), (Banouar
and Raghay, 2024)) combine these methods to bal-
ance their respective strengths, reducing limitations
like the ”cold start” problem for new users or items.
In the context of classifying software classes as de-
fective or not, recommender systems can play a role
by identifying classes with characteristics or histori-
cal patterns that suggest a higher likelihood of con-
taining defects. Collaborative filtering (Zhongbin
et al., 2021) can look for correlations between de-
fects occurrences in classes between different projects
or users. If certain developers or teams typically en-
counter similar defects in certain code structures, the
system might recommend a defect label to similar
classes. However, in software engineering, source
code metrics are widely used to assess code qual-
ity and identify classes that are likely to be defect-
prone, helping developers proactively target compo-
nents that may require additional testing or refactor-
ing. Content-based approaches for recommender sys-
tems could be more adequate when only the software
metrics are available, where they could focus on the
content features of the software classes, such as code
metrics (e.g., cyclomatic complexity, code length, or
number of dependencies) and documentation quality.
Based on known defect-prone patterns, the system
could recommend classes that are likely to contain de-
fects.
Our main objective in this work is to explore how
content-based recommender systems can be used to
recommend defect-prone classes. Our contributions
are as follows.
• Based on software metrics, we explain how
content-based approaches using similarities can
be used to recommend software classes likely to
contain defects and therefore, to be candidate for
unit test.
• Using the PROMISE dataset, these approaches
were validated and compared with the latest ma-
chine learning-based approaches for software de-
fect prediction.
The PROMISE dataset is a widely used collection
of software engineering data that consolidates infor-
mation from multiple software projects. It features
various software metrics, including line-of-code and
complexity measures, along with the critical output of
defect counts for each class or module. This dataset
allowed us to analyze the relationship between spe-
cific metrics and defect occurrences using similarities
for defect prediction in software classes. Where most
software prediction researches like (Alighardashi and
Chahooki, 2016) used project-by-project datasets in
their training models, we combined all projects into a
single dataset to end with a more diverse and larger
one.
The remainder of this paper is organized as fol-
lows. Section 2 discusses related research with
recommender systems in software defect prediction,
while Section 3 presents how they can be used in
defect-prone classes prediction for testing prioritiza-
tion. In Section 4, we address and analyze the exper-
imental results obtained over the PROMISE dataset.
The conclusion closes the paper by exposing the up-
coming work.
2 RECOMMENDER SYSTEMS
FOR SOFTWARE DEFECT
PREDICTION :
STATE-OF-THE-ART
A recommendation system is a type of information fil-
tering system that employs data mining and analytics
of user behaviors, including preferences and activi-
ties, to filter required information from a large infor-
mation source. Its approaches are classified into the
following :
• Collaborative filtering approaches
– Memory-based like the User-User approach
that considers similarities between the users.
And the item-item approach measures similar
attributes of the items (Zhongbin et al., 2021).
– Model-based that uses matrix factorization that
extracts hidden information in the data, such as
latent factors through SVD (Singular Value De-
composition) (Banouar and Raghay, 2018).
• Content-based filtering approaches
– The metadata extraction approach favors rec-
ommending items that contain the same meta-
data (Mittal et al., 2014).
– The clustering approach sorts items into groups
based on certain characteristics, making it suit-
Recommender Systems Approaches for Software Defect Prediction: A Comparative Study
415

able for unsupervised learning in large datasets
(Iqbal et al., 2020).
– Similarities estimate how similar or how far
two items are from one another to make a sug-
gestion (Kolahkaj et al., 2020).
• Hybrid approaches
– Weighted Hybrid approach appends weights to
each model where the scores rendered by the
models used are combined, so each model has
its contribution to the final recommendation
– Switching Hybrid approach alternates the use
of various algorithms, depending on the need,
as in using content-based filtering for new users
and switching to collaborative filtering for old
users
2.1 Use of Recommender Systems in
Software Defect Prediction
As mentioned, few research works used recommender
systems approaches for software defect prediction.
In a related work, the authors in (Jiang et al., 2013)
proposed a concept of personalized defect prediction
(PDP). The approach creates individual models
adapted to specific developers, PDP takes into ac-
count unique coding styles, commit frequencies, and
experience levels. This approach, validated on six
large-scale projects, showed superior performance
compared to traditional methods, discovering up to
155 additional errors. This work highlights the poten-
tial of personalized models to improve the accuracy
and effectiveness of defect prediction systems, which
are more developer-focused prediction techniques.
In (Rathore and Kumar, 2017) the authors pro-
posed an approach that is based on systematically cor-
relating the properties of the dataset with appropriate
fault prediction techniques and formalizing these cor-
relations into a decision tree model. This approach is
user-friendly and offers a structured decision-making
process for people dealing with software defect pre-
diction problems. They assess the effectiveness of
the system based on the performance of the recom-
mended techniques on these datasets.
On the other hand, (Zhongbin et al., 2021) pro-
posed a collaborative filtering approach to cross-
project defect prediction based on source project se-
lection. When a new project p is started, CFPS (Col-
laborative Filtering-Based Prediction System) evalu-
ates its similarity to past projects. Using these sim-
ilarity data, the CFPS then selects relevant historical
projects to create a specialized ”applicability reposi-
tory” for the new project p. Using similarity and ap-
plicability repositories, CFPS employs a user-based
collaborative filtering approach to suggest the most
relevant source projects. This helps improve cross-
project defect prediction by identifying projects that
are likely to provide useful information to detect po-
tential defects in the new project p.
(Nassif et al., 2023) introduced approach that
incorporates the Learning-to-Rank algorithm as
applicable to predict software defects. The au-
thors conducted a review of eight LTR models,
taking into account ranking by the number and
density of errors. They examined the fault per-
centile average (FPA) metric, demonstrating the
effectiveness of using the bug count for a more
reliable and stable result. The LTR algorithm ranks
software modules by their likelihood of containing
defects, effectively prioritizing them for testing.
This paper focuses mainly on a content-based
recommender system to suggest defect-prone
software classes using similarities. This ap-
proach focuses more on the software metrics
of a given Java class, with the aim of find-
ing other classes with similar properties.
3 CONTENT-BASED FILTERING
IN SOFTWARE DEFECT
PREDICTION : PROPOSED
FRAMEWORK
Most research on predicting software classes defect-
prone classes is based on traditional classification and
ML algorithms. These methods use historical data
and software metrics to make predictions. However,
RS are still rarely applied in this area. Collaborative
filtering, a common recommendation approach, usu-
ally requires user data, such as developer interactions
with software classes and developer profiles. Since
this information is often hard to gather, a content-
based recommendation approach is more suitable for
predicting defect-prone classes, as it relies on soft-
ware metrics that are easily computed from projects.
3.1 Methods
We aim to study how the recommender content-based
approach works and compare their effectiveness with
the methods traditionally used for classifying soft-
ware defects. By doing this, we can see whether rec-
ommender systems offer better or alternative ways
to identify potential faulty classes in software.
ENASE 2025 - 20th International Conference on Evaluation of Novel Approaches to Software Engineering
416

As shown in Figure 1, for both approaches compared,
we start by normalizing the dataset using the normal-
ization of the z score, where the mean of the data
will be brought to 0 and the standard deviation to 1
(Dalwinder and Birmohan, 2020). After that step, we
used either the ANOVA F-Test for feature selection
or the PCA for dimension reduction. Finally, we ap-
ply the different approaches, including the content-
based approach, to recommend the software classes.
The content-based approaches rely on two steps:
1) Calculate similarities between the software classes
characterized by their metrics, since the dataset
consists of rows representing the software classes,
each column corresponding to a software metric,
such as LOC, CBO, and others listed in Table 2.
2) Predict the state of the class using an aggregation
function that takes advantage of the most similar soft-
ware classes in the top N.
3.2 The Content-Based Approaches
Using Similarities
Similarities between objects refer to the measure that
calculates how similar or far two items are from each
other to make suggestions. It is a general approach
that can work with diverse kinds of input data, in-
cluding text and numerical data, and performs well in
vectorized spaces, where items are represented as fea-
ture vectors. However, the recommendations in such
methods can be very poor because of the wrong cho-
sen features, and the method does not always work
well, as it does not take into account elementary,
contextual, or buried relationships between objects,
which makes it ineffective in some situations. Sim-
ilarity, correlation, and Euclidean distance are some
of the measures used to explore the relationships be-
tween the different elements in the given dataset. Us-
ing the attributes of those elements, the measures help
the algorithms find clusters and patterns that aid in
classification, recommendation, and prediction (Amer
et al., 2021).
• Cosine similarity: this is a way to figure out how
similar two software classes are by checking the
angle between the vectors that present their col-
lected metrics. It looks at whether two classes are
heading in the same direction. They are quite sim-
ilar if the angle between the two vectors is small
(Singh et al., 2020); in this case, the similarity
score will be close to 1. On the other hand, if
the angle is close to 90 degrees, they are not very
similar, and the score will be closer to 0. This
means that there is little or no correlation between
the two classes, as they are nearly independent or
unrelated. When the angle is large and the score
is close to 1, it indicates that the two classes are
similar.
Cosine Similarity = cos(θ) =
⃗
A ·
⃗
B
||
⃗
A|| ×||
⃗
B||
Where:
–
⃗
A and
⃗
B are the vectors of the software classes,
–
⃗
A ·
⃗
B is the dot product of the two vectors,
– ||
⃗
A|| and ||
⃗
B|| are the magnitudes (or norms) of
the vectors.
• Pearson correlation: The Pearson correlation co-
efficient provides a measure of the strength of
linear association between two software classes
(Sheugh and Alizadeh, 2015). A positive score
close to 1 means that both software classes are
strongly associated, while a high negative score
means that when one goes up, the other goes
down. Although a score near 0 means they don’t
influence each other much. A negative score close
to -1 means that the two classes are correlated but
negatively (Zaid, 2015).
r =
∑
(x
i
− ¯x)(y
i
− ¯y)
p
∑
(x
i
− ¯x)
2
p
∑
(y
i
− ¯y)
2
Where:
– x
i
and y
i
are the Software metrics of software
classes,
– ¯x and ¯y are the mean of the metrics,
• Spearman correlation: For each class metric, a
rank is assigned to each one, generally after sort-
ing the values. A positive correlation between
software classes means that both classes change
in the same direction, while a negative correlation
means that the classes change in different direc-
tions. When the correlation is close to 0, it re-
flects that there is no linear relationship between
the classes ((Zaid, 2015), (Tapucu et al., 2012)).
ρ = 1 −
6
∑
d
2
i
n(n
2
− 1)
Where:
– d
i
is the difference between the ranks assigned
to software metrics,
– n is the number of software classes,
• L2-Distance (Euclidean distance): A measure
used to calculate the similarity between two class
vectors by calculating the distance between their
metrics in a multidimensional plan. A small score
indicates that the distance between the two classes
is small, indicating that they are similar. A high
Recommender Systems Approaches for Software Defect Prediction: A Comparative Study
417
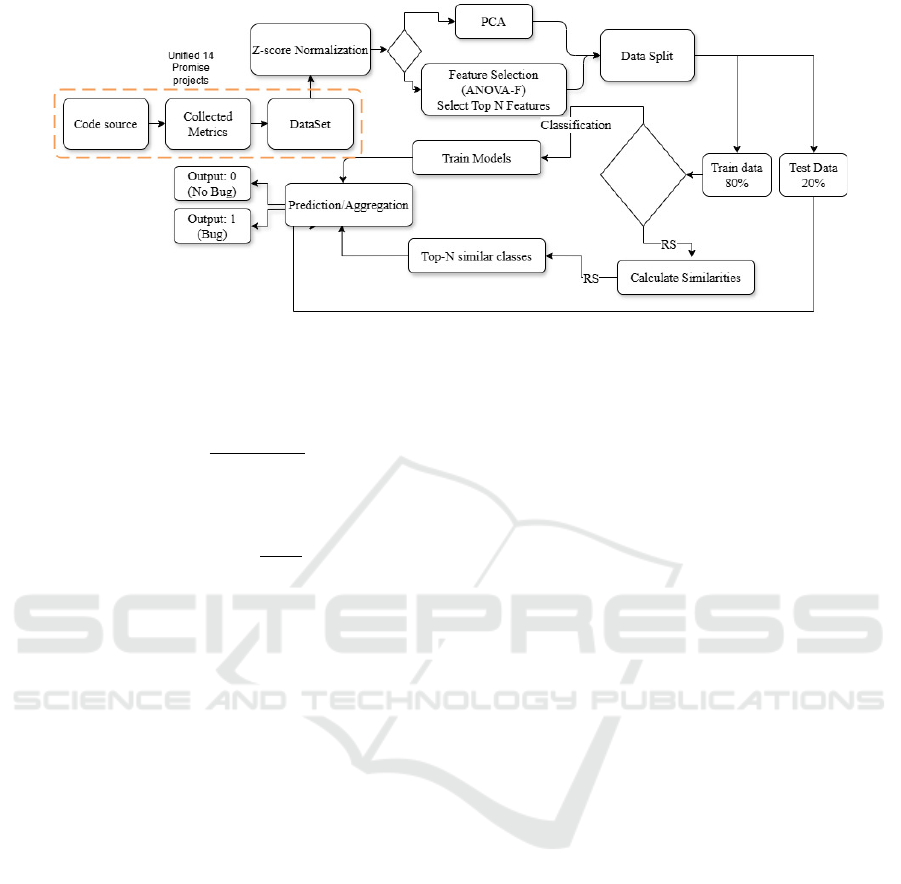
Figure 1: Workflow of RS approaches and Classic ML.
score indicates that the two classes are less simi-
lar, as the distance between their metrics is large
(Wu et al., 2022).
d =
s
n
∑
i=1
(x
i
− y
i
)
2
similarity =
1
1 + d
Where:
– x
i
and y
i
are the individual metrics of software
classes x and y,
– d is the L2-distance (Euclidean distance) be-
tween the two classes.
3.3 The Content-Based Approach Using
Feature Selection
The ANOVA method is a type of F statistics called the
ANOVA f test. This is a single-variable statistical test
that compares each feature with the target feature to
determine whether there is a statistically significant
relationship between them (Salman et al., 2022). In
general, ANOVA is used in classification tasks where
the type of input feature is numerical and the target
feature is categorical (Mishra et al., 2019). Then we
proceed with calculating similarities between the se-
lected features of the actual software class, using Co-
sine similarity, Spearman’s correlation, Pearson’s cor-
relation, and Euclidean distance L2. These similarity
measures are then used in an aggregation technique to
predict whether a class is prone to defects or not. To
achieve this, the Top N most similar classes are iden-
tified based on similarity scores and their labels are
combined to predict the label of the target class.
Defect Prediction Aggregation: (1)
for defect presence: w
1
=
N
∑
i=1
δ
1,i
for no defect presence: w
0
=
N
∑
i=1
δ
0,i
classification: ˆy = argmax(w
0
,w
1
)
The equation sums up the similarities of the top-
N classes, adding them to either the weight of label
1 or label 0, depending on the label of each class in
the top-N. The final prediction is then made based on
which weight, label 0 or label 1, has the higher value.
3.4 The Content-Based Approach Using
PCA Components
One of the most frequently used approaches to re-
duce dimensionality is the main component analysis
(PCA), it is a dimensional reduction technique that
aims to reduce large sets of variables to smaller sets
without losing too much information that the original
set offers (Salih et al., 2021). The other approach to
CB involves using PCA to capture new components
that will replace the original class vectors containing
the standard metrics. The similarities between these
transformed class vectors are then calculated using
the similarities presented and the Euclidean distance
L2. These similarity measures are combined using
the same aggregation technique as in Section 3.2.2 to
classify whether a class is defect-prone or not. The
Top N most similar classes are also identified based
on similarity scores.
ENASE 2025 - 20th International Conference on Evaluation of Novel Approaches to Software Engineering
418

3.5 Classic Machine Learning
Approaches for Software Defect
Prediction
Multiple models are used for the prediction of defect-
prone classes. The models will be trained to classify
software classes into classes that may contain defects
or not. The state-of-the-art models used for this pur-
pose are :
• SVM (Support vector machine)
• NB (Naive Bayes)
• Decision Tree Classifier
• KNN (k-nearest neighbors)
• LR (Logistic Regression)
• Neural Network
• Ensemble (Weighted voting Approach)
The simplicity of the implementation justifies the
choice of these algorithms, also since they are dif-
ferent methods and some of the most used in defect
classification, except for the ensemble weighted ap-
proach, from which we implemented and tested to
seek for more comparison material.
The ensemble learning method was presented by
(Kumar and Chaturvedi, 2024). Is an algorithm that
makes use of a set of classifiers to improve the data
label prediction accuracy. The method describes the
outcome based on the weighted voting among differ-
ent classifiers in the ensemble. All classifiers get an
initial weight = 1. In case a classifier fails, its weight
is reduced by a multiplier of Beta, which is equal to
0.5 depending on the number of mistakes it makes
(Rokach, 2005).
C 1 W sum =
n
∑
i=1
p
i
· w
i
C 0 W sum =
n
∑
i=1
(1 − p
i
) · w
i
final prediction =
(
1 if C 1 W sum > C 0 W sum
0 otherwise
Where:
• p = [p
1
, p
2
,. . ., p
n
] represents the predictions of
each classifier for a given software class, where:
– p
i
= 1 if the classifier i predicts the class is de-
fective 1
– p
i
= 0 if the classifier i predicts the class is not
defective 0
• w = [w
1
,w
2
,. . ., w
n
] represents the weights asso-
ciated with each classifier.
4 EXPERIMENT
4.1 DataSet
The dataset used to conduct the comparison was the
Promise dataset, it is a known dataset for general
research in software engineering, as it contains open
source projects from different domains. We combined
data from the 14 different software projects with their
different versions to create a unified dataset. Promise
is a set of Java object-oriented projects. Since all
projects have the same software metrics available, we
were able to produce a large set of data that con-
tains all Java classes from all available projects. This
leaves us with a dataset of 5883 Java classes. The
dataset originally included the number of defects as
output for each class, representing the number of de-
fects found. To adapt these data for a classification
context, we transformed the output into a binary la-
bel. We set the label to 1 if the number of defects
is greater than 0 and set 0 if the number of defects
is 0. A 1 label indicates that the class is defective.
And 0, indicates non-defective. This transformation
allowed us to set the problem as a binary classifica-
tion, making it suitable for prediction of defects.
Table 1 presents the 14 projects in the PROMISE
dataset. The projects have different numbers of soft-
ware classes and all of those software classes are pre-
sented with the same number of metrics 20. Table
1 presents the statics description of systems follow-
ing a subset of well-known metrics (including sev-
eral CK metrics + LOC)., we have included a met-
ric for each of the key software characteristics. Cou-
pling (CBO), which measures the degree of interde-
pendence between classes; Size (LOC), representing
the Lines of Code in a class to indicate its complexity;
Cyclomatic complexity (avg-Cc), which measures the
complexity of the control flow of a program by count-
ing the number of independent paths in the code; and
Inheritance (DIT), representing the Depth of Inheri-
tance Tree, which shows the level of inheritance in
the class hierarchy. The values in Table 1 represent
the average values of the CK metrics and the LOC for
each project, including projects with more than one
version. We can notice that the projects have differ-
ent values of LOC ranging from 105 to 439, when the
complexity varies from 0.94 to 1.97. The percentage
of defective classes varies from 10% to 51%. These
metrics provide valuable insight into the structure and
design of the software, which can help predict poten-
tial defective components. Table 2 gives the descrip-
tion of all the metrics available in the dataset, these
metrics were automatically extracted from code files
from Java software classes and then organized into
Recommender Systems Approaches for Software Defect Prediction: A Comparative Study
419

structured datasets.(Meiliana et al., 2017)
4.2 Data Preparation
Normalization: Since the data are not on the same
scale, normalization is a necessary step, the chosen
method is Z-score normalization (ZSN), it uses the
mean and standard deviation of the data to rescale it,
ensuring that the transformed features have a mean of
zero and a variance of one (Dalwinder and Birmohan,
2020).
Feature Selection: ANOVA-F Test: is a technique
of Analysis of Variance, which is a statistical method
used on a dataset to understand the characteristics of
its features. The main idea of the ANOVA F test is to
choose features based on how the data are distributed,
selecting those that are most related to the target vari-
able (Shakeela et al., 2021).
4.3 Evaluation Metrics
To evaluate and compare the selected approaches, we
used the accuracy, precision and F1 score measures.
The F score measure combines precision and recall as
a harmonic mean, making it a useful metric to eval-
uate models (Vujovic, 2021). On the other hand, ac-
curacy is commonly used in many prediction models.
However, it tends to be less effective when dealing
with imbalanced data, as it does not provide a reliable
measure of performance in those cases.
4.4 Implemented Approaches and
Hyper-Parameters
To carry out this comparative study, we followed two
methods for the content-based approach. The first
includes normalizing the dataset using Z-Score stan-
dardization techniques to ensure that all features were
comparable. After that, we applied the ANOVA F-
test for the selection of features to identify the most
relevant software metrics for classification. The data
were then divided into 80% training data and 20%
test data, where the test data were treated as new
software classes for classification. For each pair of
classes, four similarity and distance measurements
were calculated: Cosine similarity, Pearson correla-
tion, Spearman correlation, and Euclidean L2 dis-
tance. Based on these calculations, we identified the
most N similar classes of each class in the test dataset.
Finally, an aggregation function (1) is applied to the
selected similar classes to assign labels to each new
class in the test data, which completes the classifica-
tion process. The other method in the Content-based
approach will simply replace the ANOVA F-Test fea-
ture selection with PCA, So the procedure will stay
the same; it only considers the new PCA components
as the new features.
As hyperparameters, we set K=10, which is the
number of features selected using the ANOVA F-Test,
and N=14, which represents the top-N similar classes
to the new class we want to classify. These values
were chosen after testing several options to achieve
optimal results.
In the feature selection process, the ten metrics se-
lected using the ANOVA F-Test are: WMC (Weighted
Methods per class), CBO (Coupling Between Ob-
jects), RFC (Response for Class), CE (Efferent Cou-
pling), NPM (Number of Public Methods), LOC
(Lines of Code), DAM (Data Access Metrics), MOA
(Measure of Aggregation), MAX-CC (Maximum Cy-
clomatic Complexity), and AVG-CC (Average Cyclo-
matic Complexity).
For the classification models, the decision tree
classifier was trained with a maximum depth of 10,
the KNN was trained with 10 neighbors, and the lo-
gistic regression with 200 iterations and L2 to pe-
nalize large coefficients. For the neural network, we
used a learning rate of 0.001, 2 layers with 64 and 16
nodes, respectively. The ensemble learning method
has as base classifiers: NB, Decision Tree, SVM, LR,
and KNN. with the penalty beta parameter set to 0.5.
For PCA 10 components are considered.
4.5 Results and Discussion
The implementation of our comparison was carried
out on a Surface 8 with an Intel i7 processor and 16
GB of RAM, using PyCharm as the development en-
vironment.
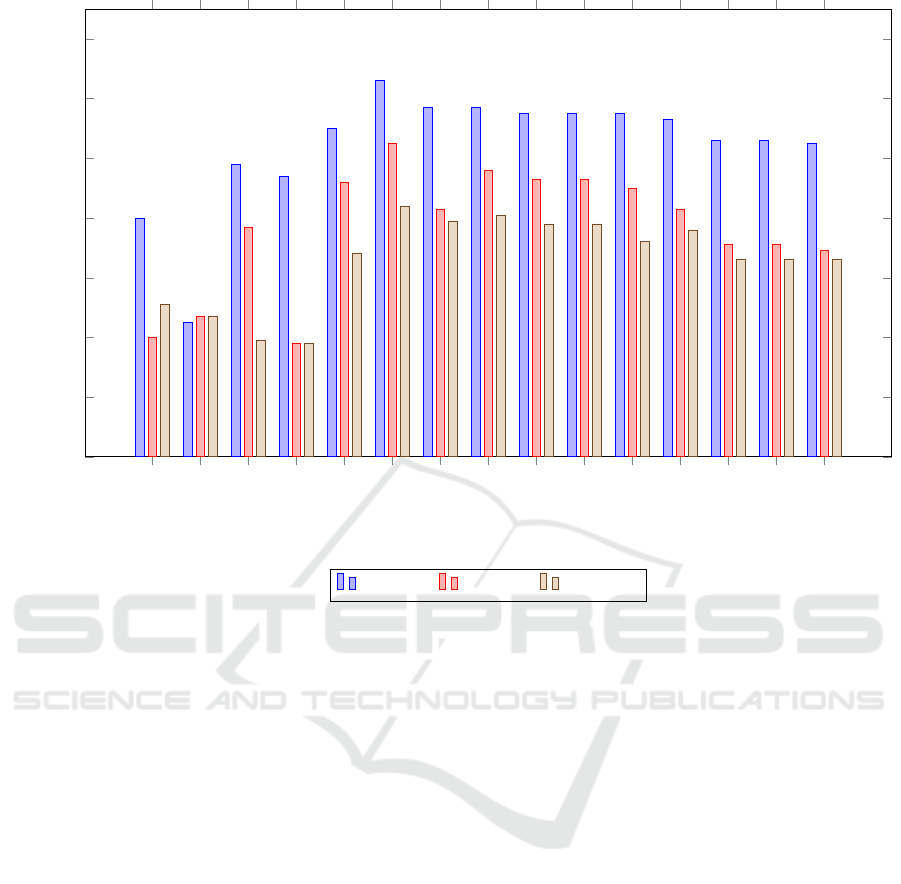
Table 3 presents the results obtained from the var-
ious traditional classification approaches, ensemble
learning, and deep learning side by side with content-
based approaches (CB) that calculate similarities be-
tween software classes, both in the raw software met-
rics and in the principal component analysis (PCA) as
new features, providing a comprehensive understand-
ing of the prediction capabilities of each model.
Traditional approaches include classic machine
learning models, ensemble methods, and deep learn-
ing. Among the classic models, K-Nearest Neighbors
(K-NN) and logistic regression appear to have the best
performance benchmark, with K-NN recording an ac-
curacy of 0.810, precision of 0.792, and F1 score of
0.768. Followed by Logistic Regression which has
an accuracy of 0.807, a precision of 0.791, and an
F1 score of 0.760. Other traditional models such as
Naive Bayes and SVM also give reasonable results
ENASE 2025 - 20th International Conference on Evaluation of Novel Approaches to Software Engineering
420

Table 1: Promise Dataset Description.
Project nb of versions Loc Avg-cc Lcom Cbo Dit classes defective % nb of defects
ant 1 280.07 1.37 89.15 11.05 2.52 745 28.67 338
camel 2 105.86 0.94 64.70 9.80 1.97 1047 22.59 506
data-arc 1 139.30 1.07 58.40 7.76 1.59 225 14.79 29
data-ivy 1 249.34 1.21 131.58 13.23 1.79 352 12.82 40
data-prop 1 146.14 1.25 42.27 10.16 1.39 644 10.46 61
data-redak 1 338.74 1.44 6.58 12.12 1.35 175 18.24 27
jedit 2 439.59 1.86 205.08 12.29 2.72 401 38.27 421
log4j 1 182.92 1.45 27.00 6.86 1.50 109 51.38 86
lucene 1 259.47 1.29 35.22 9.76 1.74 195 87.5 268
poi 1 296.72 1.15 103.76 8.65 1.70 314 13.35 39
synapse 2 203.09 1.97 38.27 12.44 1.59 264 51.72 149
velocity 1 248.96 1.27 80.34 10.81 1.68 229 51.65 190
xalan 1 311.33 1.35 130.08 14.50 2.57 723 17.94 156
xerces 2 359.43 1.22 90.80 5.02 2.02 460 36.49 280
Total Combined 18 243.59 1.29 86.85 10.61 2.00 5883 25.43 2590
Table 2: Classic ML and RS approach results.
Category Approach Top N Acc Prec F1-Score
Classic
Naive Bayes NA 0.780 0.740 0.751
Decision Tree NA 0.745 0.747 0.746
SVM NA 0.798 0.777 0.739
L-Regression NA 0.794 0.738 0.734
K-NN NA 0.810 0.792 0.768
Ensemble WMV ** NA 0.826 0.805 0.784
D.Learning NN NA 0.817 0.783 0.779
CB on classes*
Cosine 14 0.817 0.796 0.781
Spearman 14 0.815 0.793 0.778
Pearson 14 0.815 0.793 0.778
L2 14 0.812 0.788 0.772
CB On PCA *
Cosine 14 0.813 0.783 0.776
Spearman 14 0.801 0.757 0.750
Pearson 14 0.806 0.771 0.768
L2 14 0.805 0.769 0.766
* Proposed CB approaches, ** Approach from (Zamani
et al., 2014).
but lag behind K-NN in the F1 score.
Where weighted majority voting (WMV) is rep-
resentative of an ensemble method proposed by (Za-
mani et al., 2014), it scores higher than classic models
where an accuracy of 0.826, a precision of 0.805, and
an F1 score of 0.784 are recorded. The integration of
different classifiers leads to an overall improvement
in the classification performance.
The deep learning model (3-layer Neural Net-
work) achieves an accuracy of 0.817, precision of
0.783, and F1-score of 0.779, which is close to the
ensemble method (WMV). This result suggests that
even a relatively simple neural network architecture
can capture complex relationships within the data,
performing comparably to the ensemble approach and
slightly better than the best individual classic classi-
fiers. However, the neural network does not outper-
form WMV, indicating that deep learning may require
more tuning to gain more accuracy.
However, the CB approach operates by measur-
Table 3: Software Metrics in Dataset.
Metric Description
WMC Weighted Methods per Class: Sum of complexities of meth-
ods in a class.
DIT Depth of Inheritance Tree: Measures how deep a class is in
the inheritance hierarchy.
NOC Number of Children: Counts the direct subclasses of a class.
CBO Coupling Between Objects: Counts the number of other
classes a class is coupled with.
RFC Response For a Class: Number of methods that can be exe-
cuted in response to a message to an object.
LCOM Lack of Cohesion in Methods: Measures the dissimilarity of
methods in a class.
CA Afferent Couplings: Number of classes that depend on a
given class.
CE Efferent Couplings: Number of classes that a given class de-
pends on.
NPM Number of Public Methods: Counts the number of public
methods in a class.
LCOM3 Lack of Cohesion in Methods
LOC Lines of Code: Total number of lines in a class or method.
DAM Data Access Metric: Measures the ratio of private/protected
attributes to total attributes.
MOA Measure of Aggregation: Number of data declarations (at-
tributes) in a class.
MFA Measure of Functional Abstraction: Ratio of inherited meth-
ods to total methods.
CAM Cohesion Among Methods: Measures cohesion among meth-
ods in terms of attribute usage.
IC Inheritance Coupling: Number of parent classes to which a
class is coupled.
CBM Coupling Between Methods: Counts the number of method-
level couplings in a class.
AMC Average Method Complexity: Average complexity of meth-
ods in a class.
Max CC Maximum Cyclomatic Complexity: Highest cyclomatic com-
plexity among the methods in a class.
Avg CC Average Cyclomatic Complexity: Average cyclomatic com-
plexity across methods in a class.
ing similarity scores (Cosine, Spearman, Pearson, and
L2) using the original class features or after dimen-
sionality reduction via PCA. This method demon-
strates good accuracy and precision values, with co-
Recommender Systems Approaches for Software Defect Prediction: A Comparative Study
421
Naive Bayes
Decision Tree
SVM
L-Regression
K-NN
WMV
NN
Cosine-Class
Spearman-Class
Pearson-Class
L2-Class
Cosine-PCA
Spearman-PCA
Pearson-PCA
L2-PCA
0.7
0.72
0.74
0.76
0.78
0.8
0.82
0.84
Performance Metrics
Accuracy
Precision F1-Score
Figure 2: Results Comparison Chart.
sine similarity on classes yielding an accuracy of
0.817, precision of 0.796, and F1-score of 0.781,
highlighting that CB methods can be highly effective,
especially in cases where classes are represented by
relevant software metrics. Both Spearman and Pear-
son achieve an accuracy of 0.815 and a high pre-
cision of 0.793, with F1-scores of 0.778, indicating
good classification capability. However, the L2 met-
ric slightly underperforms with an accuracy of 0.812,
a precision of 0.788, and an F1 score of 0.772, assum-
ing that similarities based on Euclidean distance may
be less effective compared to correlation-based ones
in this case.
When applied after PCA, the CB approach shows
a slight drop in performance across all similarity mea-
sures. The cosine similarity in PCA still performs
well, with a precision of 0.813, a precision of 0.783,
and an F1 score of 0.776. The Spearman and Pearson
similarities yield accuracies of 0.801 and 0.806, re-
spectively, with corresponding drops in precision and
F1 score. The L2 euclidean distance on PCA records
the lowest accuracy within the CB on PCA category,
at 0.805, with a precision of 0.769 and F1-score of
0.766. We also noticed that kNN performs similar
to the proposed content-based approach because both
use the idea of similarity to make decisions.
Other studies, such as (Aljamaan and Alazba,
2020), show a higher classification accuracy (around
0.9) compared to the proposed CB method. This dif-
ference is because the CB method was tested on a
different dataset (PROMISE), which includes multi-
ple software systems from various domains. Further-
more, earlier studies treated each software system as
an individual dataset. However, the CB methodology
combines 14 different projects from different disci-
plines into one very large dataset with a significant
number of software classes. This makes our method
more general rather than being limited to a specific
dataset or domain.
5 THREATS TO VALIDITY
Despite the large size of the dataset utilized in this
study, which combined 5883 software classes from
14 different projects of various domains into one sin-
gle dataset, the results may present several threats that
limit their generalization:
• DataSet Nature: The Promise dataset is designed
for general purpose in software engineering re-
search and is not specifically adapted to predict
ENASE 2025 - 20th International Conference on Evaluation of Novel Approaches to Software Engineering
422

software defects. An extension of this paper could
be to apply this approach to a specialized dataset,
such as the NASA dataset, which is better suited
for defect prediction.
• Programming Language Dependence: The ex-
periments were conducted only on Java projects.
As a result, the conclusions obtained may not gen-
eralize to software written in other programming
languages, such as functional or procedural pro-
gramming.
• Open-Source Bias: The promise dataset is made
up exclusively of open source projects, which may
not reflect the characteristics and challenges of
closed source projects. This makes the results not
directly transferable to non-open-source projects.
• Static Metrics Only: Promise dataset is com-
posed of static metrics only. Code change met-
rics and developer-related information have been
shown to contribute better to predicting defects
than static code metrics (Moser et al., 2008).
6 CONCLUSION
This research established a state of the art for defect-
prone classes prediction. It explored how RS ap-
proaches can be used in software defect prediction
and compared it to traditional classification models.
The content-based approach, based on standard met-
rics or PCA components, produced competitive re-
sults for classification techniques, particularly ensem-
ble learning and neural networks. This reassures us
that the content-based approach using similarity, cor-
relation, and Euclidean distance measures may be a
potential substitute for widely used techniques in soft-
ware prediction. We also believe that performance
can be improved with more tuning by testing multi-
ple feature selection approaches, combining multiple
similarity or correlation measures, and optimizing the
N parameter for the selection of similar classes. In ad-
dition, considering different types of defects (such as
security, functional, or performance-related defects),
one possible extension of this study is to recommend
defects by using more appropriate metrics adapted to
each type of defect. This could lead to a more accu-
rate and meaningful recommendation. Furthermore,
taking into account the severity of the defect could
refine the analysis by prioritizing critical defects that
have a greater impact on the system. Applying recom-
mendation systems in this context could help develop-
ers focus on resolving high-severity defects first.
REFERENCES
Alighardashi, F. and Chahooki, M. (2016). The effec-
tiveness of the fused weighted filter feature selection
method to improve software fault prediction. Jour-
nal of Communications Technology, Electronics and
Computer Science, 8:5.
Aljamaan, H. and Alazba, A. (2020). Software defect pre-
diction using tree-based ensembles. In Proceedings of
the 16th ACM International Conference on Predictive
Models and Data Analytics in Software Engineering,
PROMISE 2020, page 1–10, New York, NY, USA.
Association for Computing Machinery.
Amer, A. A., Abdalla, H. I., and Nguyen, L. (2021).
Enhancing recommendation systems performance us-
ing highly-effective similarity measures. Knowledge-
Based Systems, 217:106842.
Banouar, O. and Raghay, S. (2018). Enriching sparql
queries by user preferences for results adaptation.
International Journal of Software Engineering and
Knowledge Engineering, 28(08):1195–1221.
Banouar, O. and Raghay, S. (2024). Pattern-based rec-
ommender system using nuclear norm minimization
of three-mode tensor and quantum fidelity-based k-
means. International Journal of Pattern Recognition
and Artificial Intelligence, 38(06):2455004.
Dalwinder, S. and Birmohan, S. (2020). Investigating the
impact of data normalization on classification perfor-
mance. Applied Soft Computing, 97:105524.
Iqbal, S., Naseem, R., Jan, S., Alshmrany, S., Yasar, M.,
and Ali, A. (2020). Determining bug prioritization
using feature reduction and clustering with classifica-
tion. IEEE Access, 8:215661–215678.
Jiang, T., Tan, L., and Kim, S. (2013). Personalized de-
fect prediction. In 2013 28th IEEE/ACM Interna-
tional Conference on Automated Software Engineer-
ing (ASE), pages 279–289.
Kolahkaj, M., Harounabadi, A., Nikravanshalmani, A., and
Chinipardaz, R. (2020). A hybrid context-aware ap-
proach for e-tourism package recommendation based
on asymmetric similarity measurement and sequential
pattern mining. Electronic Commerce Research and
Applications, 42:100978.
Kumar, R. and Chaturvedi, A. (2024). Software bug pre-
diction using reward-based weighted majority voting
ensemble technique. IEEE Transactions on Reliabil-
ity, 73(1):726–740.
Meiliana, S. Karim, S., Warnars, H. S., Gaol, Lumban,
F., Edi, A., and Soewito, B. (2017). Software met-
rics for fault prediction using machine learning ap-
proaches: A literature review with promise repository
dataset. In 2017 IEEE International Conference on
Cybernetics and Computational Intelligence (Cyber-
neticsCom), pages 19–23.
Mishra, P., Singh, U., Pandey, C., Mishra, P., and G, P.
(2019). Application of student’s t-test, analysis of
variance, and covariance. Annals of Cardiac Anaes-
thesia, 22:407.
Mittal, P., Jain, A., and Majumdar, A. (2014). Metadata
based recommender systems. In 2014 International
Recommender Systems Approaches for Software Defect Prediction: A Comparative Study
423

Conference on Advances in Computing, Communica-
tions and Informatics (ICACCI), pages 2659–2664.
Moser, R., Pedrycz, W., and Succi, G. (2008). A compar-
ative analysis of the efficiency of change metrics and
static code attributes for defect prediction. In Proceed-
ings of the 30th International Conference on Software
Engineering, ICSE ’08, page 181–190, New York,
NY, USA. Association for Computing Machinery.
Najmani, K., Benlahmar, E., Sael, N., and Zellou, A.
(2022). Collaborative filtering approach: A review
of recent research. In Kacprzyk, J., Balas, V., and
Ezziyyani, M., editors, Advanced Intelligent Systems
for Sustainable Development (AI2SD’2020), pages
151–163, Cham. Springer International Publishing.
Nassif, A., Talib, M. A., Azzeh, M., Alzaabi, S., Khanfar,
R., Kharsa, R., and Angelis, L. (2023). Software de-
fect prediction using learning to rank approach. Sci-
entific Reports, 13.
Ouedrhiri, O., Banouar, O., Hadaj, S. E., and Raghay, S.
(2022). Intelligent recommender system based on
quantum clustering and matrix completion. Concur-
rency and Computation: Practice and Experience,
34(15):e6943.
Pushpendu, K., Monideepa, R., and Sujoy, D. (2024).
Collaborative Filtering and Content-Based Systems,
pages 19–30. Springer Nature Singapore, Singapore.
Rathore, S. and Kumar, S. (2017). A decision tree logic
based recommendation system to select software fault
prediction techniques. Computing, 99.
Rokach, L. (2005). Ensemble Methods for Classifiers,
pages 957–980. Springer US, Boston, MA.
Salih, H., Basna, M., and Abdulazeez, A. (2021). A review
of principal component analysis algorithm for dimen-
sionality reduction. Journal of Soft Computing and
Data Mining, 2(1):20–30.
Salman, M., Nag, A., Pathan, M., and Dev, S. (2022). An-
alyzing the impact of feature selection on the accu-
racy of heart disease prediction. Healthcare Analytics,
2:100060.
Shakeela, S., Shankar, N. S., Reddy, P. M., Tulasi, T. K.,
and Koneru, M. M. (2021). Optimal ensemble learn-
ing based on distinctive feature selection by univari-
ate anova-f statistics for ids. International Journal
of Electronics and Telecommunications, vol. 67(No
2):267–275.
Sheugh, L. and Alizadeh, S. (2015). A note on pearson
correlation coefficient as a metric of similarity in rec-
ommender system. In 2015 AI and Robotics (IRA-
NOPEN), pages 1–6.
Singh, R. H., Maurya, S., Tripathi, T., Narula, T., and Sri-
vastav, G. (2020). Movie recommendation system us-
ing cosine similarity and knn. International Journal
of Engineering and Advanced Technology, 9(5):556–
559.
Tahir, H., Khan, S., S.Ali, and Syed, S. (2021). Lcbpa: An
enhanced deep neural network-oriented bug prioriti-
zation and assignment technique using content-based
filtering. IEEE Access, 9:92798–92814.
Tapucu, D., Kasap, S., and Tekbacak, F. (2012). Perfor-
mance comparison of combined collaborative filter-
ing algorithms for recommender systems. In 2012
IEEE 36th Annual Computer Software and Applica-
tions Conference Workshops, pages 284–289.
Toure, F., Mourad, B., and Lamontagne, L. (2017). Inves-
tigating the prioritization of unit testing effort using
software metrics. In Proceedings of the 12th Interna-
tional Conference on Evaluation of Novel Approaches
to Software Engineering - ENASE, pages 69–80. IN-
STICC, SciTePress.
Vujovic, Z. D. (2021). Classification model evaluation met-
rics. International Journal of Advanced Computer
Science and Applications, 12(6).
Wu, D., Shang, M., Luo, X., and Wang, Z. (2022). An l1-
and-l2-norm-oriented latent factor model for recom-
mender systems. IEEE Transactions on Neural Net-
works and Learning Systems, 33(10):5775–5788.
Wu, X. (2024). Review of collaborative filtering recom-
mendation systems. Applied and Computational En-
gineering, 43:76–82.
Zaid, M. (2015). Correlation and Regression Analysis.
SESRI Publications. Comprehensive overview of
Pearson and Spearman correlation types, assumptions,
and applications.
Zamani, M., Beigy, H., and Shaban, A. (2014). Cascading
randomized weighted majority: A new online ensem-
ble learning algorithm. ArXiv, abs/1403.0388.
Zegzouti, S. E. F., Banouar, O., and Benslimane, M. (2023).
Collaborative filtering approach: A review of recent
research. In Cerchiello, P., Osmetti, A. A. S., and
Spelta, A., editors, Proceedings of the Statistics and
Data Science Conference (SDS’2023), pages 164–
169, Cham. Springer International Publishing.
Zhongbin, S., Junqi, L., Heli, S., and Liang, H. (2021).
Cfps: Collaborative filtering based source projects se-
lection for cross-project defect prediction. Applied
Soft Computing, 99:106940.
ENASE 2025 - 20th International Conference on Evaluation of Novel Approaches to Software Engineering
424
