
Predicting the State of Health of Supercapacitors Using a Federated
Learning Model with Homomorphic Encryption
V
´
ıctor L
´
opez
1 a
, Oscar Fontenla-Romero
2 b
, Elena Hern
´
andez-Pereira
2 c
,
Bertha Guijarro-Berdi
˜
nas
2 d
, Carlos Blanco-Seijo
3 e
and Samuel Fern
´
andez-Paz
3 f
1
Universidade da Coru
˜
na, CEMI UDC-Navantia, Spain
2
Universidade da Coru
˜
na, CITIC, Spain
3
Navantia, Spain
Keywords:
Federated Learning, Homomorphic Encryption, Supercapacitors, State of Health (SOH).
Abstract:
The increasing prevalence of supercapacitors (SCs) in various industrial sectors underscores the necessity for
precise estimation of the state of health (SOH) of these devices. This article presents a novel approach to
SOH prediction using a model that integrates federated learning (FL) and homomorphic encryption (HE),
FedHEONN. Conventional SOH prediction models face challenges concerning accuracy, reliability, and se-
cure data handling, particularly in Internet of Things (IoT) environments. FedHEONN addresses these issues
by using FL to enable a network of distributed nodes to collaboratively develop a predictive model without the
need to share private data. This model enhances both data privacy and leverages the collective intelligence of
edge computing devices. Furthermore, the inclusion of HE allows computations to be performed on encrypted
data, further securing the federated learning framework. We conducted experiments with a real dataset to eval-
uate the effectiveness of this FL method in predicting the SOH of SCs against conventional models, including
linear regression with regularisation techniques such as Lasso, Ridge and Elastic-net, and non-linear models
such as multilayer perceptron and support vector machine for regression. The results were tested in various
configurations, including empirical mode decomposition (EMD) and multi-stage (MS) setups.
1 INTRODUCTION
Supercapacitors (SCs) play a key role in modern en-
ergy storage and power management systems due to
their exceptional power density and almost instanta-
neous energy delivery. These characteristics make
them ideal for a wide range of applications, includ-
ing the stabilisation of power in consumer electron-
ics (Banerjee et al., 2020). They facilitate the de-
ployment of longer-lasting energy storage solutions
and regenerative braking systems in electric vehicles
(EVs), where they capture and reuse energy typically
lost during braking (Zou et al., 2015). In power grids,
they can assist in more effectively balancing load and
supply, thus supporting more stable and reliable en-
a
https://orcid.org/0000-0003-3752-8880
b
https://orcid.org/0000-0003-4203-8720
c
https://orcid.org/0000-0001-8666-4075
d
https://orcid.org/0000-0001-8901-5441
e
https://orcid.org/0009-0002-0972-4155
f
https://orcid.org/0009-0004-6462-6448
ergy distribution (Rocabert et al., 2018). They are
also increasingly used in renewable energy systems
to smooth out short-term fluctuations in power gener-
ation (Panhwar et al., 2020)(Zhang et al., 2023).
The state of health (SOH) of a SC is a critical met-
ric that indicates its ability to perform reliably over
its expected lifetime. SOH encompasses several as-
pects, including capacitance, internal resistance, and
cycle stability. The capacity to accurately predict the
SOH of SCs can enhance the efficiency and reliability
of systems in which they are deployed. Traditional
methods for estimating SOH involve regular testing
under controlled conditions to measure these param-
eters, but this can be cumbersome and inefficient in
practical applications (Zhang and Pan, 2015)(Zhao
et al., 2017).
Recent advances have introduced more sophisti-
cated techniques for estimating SOH, leveraging sen-
sor data and advanced analytics, including machine
learning (ML) techniques. Among these, federated
learning (FL) represents a significant innovation, en-
abling the creation of collaborative models without
884
López, V., Fontenla-Romero, O., Hernández-Pereira, E., Guijarro-Berdiñas, B., Blanco-Seijo, C. and Fernández-Paz, S.
Predicting the State of Health of Supercapacitors Using a Federated Learning Model with Homomorphic Encryption.
DOI: 10.5220/0013215300003890
In Proceedings of the 17th International Conference on Agents and Artificial Intelligence (ICAART 2025) - Volume 3, pages 884-891
ISBN: 978-989-758-737-5; ISSN: 2184-433X
Copyright © 2025 by Paper published under CC license (CC BY-NC-ND 4.0)

the need for data centralisation. These models pro-
vide data privacy by design since the data does not
travel through the data network but always remains
in the source that generated it. Therefore, the data is
never handled by third parties, nor is it susceptible to
interception on the network.
This approach not only secures and privatises data
but also increases scalability and reduces reliance on
central data storage. As a result, this decentralised
method is especially vital in fields where data confi-
dentiality is critical (Li et al., 2021)(Mothukuri et al.,
2021).
This work presents a novel approach to predict the
SOH of SCs using a new federated learning method,
FedHEONN (Fontenla-Romero et al., 2023), based
on one-layer neural networks that incorporate homo-
morphic encryption (HE) to ensure robustness against
model inversion attacks (Huang et al., 2021). The re-
mainder of this paper is structured as follows. Section
2 reviews the literature on SOH prediction and ML.
Section 3 details the proposed method. Section 4 in-
troduces the dataset and feature configurations. Sec-
tion 5 presents the results of the experimental analy-
sis. Finally, section 6 presents the conclusions drawn
from the work.
2 STATE OF THE ART
The accurate prediction of the SOH is of paramount
importance for the reliability and efficiency of energy
storage systems. Over the years, many ML models
have been proposed in the literature with the aim of
enhancing the accuracy and efficiency of predictions.
This section outlines the main developments in this
area, focusing on the types of models used and their
reported effectiveness.
Regression models have traditionally been
favoured for their simplicity and effectiveness in
continuous output prediction tasks. Linear regression
models have provided a baseline for performance
comparisons. However, their simplicity often limits
their accuracy in capturing the complex behaviours of
supercapacitors under varying operational conditions.
More sophisticated regression techniques, such as
Support Vector Machines (SVM), have been shown to
offer improvements by managing non-linear relation-
ships more effectively. For instance, Gheytanzadeh et
al. (Gheytanzadeh et al., 2021) employed a SVM with
grey wolf optimisation (GWO) to correlate structural
features of carbon-based materials in SCs with their
performance in terms of energy and power density.
The SVM-GWO model obtained a coefficient of
determination (R
2
) of 0.92, showing that the fitted
model explained a high level of variability present in
the real data, and identified the specific surface area
as the most influential factor.
Artificial Neural Networks (ANN) have gained
popularity due to their ability to model non-linear and
complex relationships inherent in SC behavior. The
flexibility of the architecture, from simple feedfor-
ward networks to more complex configurations such
as recurrent neural networks (RNN), allows for de-
tailed modelling of time-dependent degradation pat-
terns in SC. Sawant et al. (Sawant et al., 2023) tested
the use of a multilayer perceptron (MLP) neural net-
work against other techniques for the prediction of
capacitance and remaining useful life (RUL) of SCs
with significant accuracy, leveraging large datasets
from operational SCs to train the models.
Although ML models discussed in the literature
show promise, they still face challenges in the spe-
cific purpose of accurately predicting the SOH of SCs
(Laadjal and Marques Cardoso, 2021). Additionally,
these models typically rely on centralised systems that
require data to be sent to a central server for training,
which introduces a significant security risk. This data
could be intercepted or acquired by unauthorised par-
ties during its transmission, leading to potential pri-
vacy breaches. Moreover, the process of transmitting
data is inherently limited. For example, in certain IoT
scenarios, a substantial quantity of data must be trans-
mitted to a central server, which introduces complica-
tions to the process.
The field of FL has recently experienced remark-
able advancement. This innovative method in ma-
chine learning has been successfully implemented
across various sectors, including healthcare, finance,
and transportation (Banabilah et al., 2022)(Li et al.,
2020). Recent efforts have aimed at enhancing the
efficiency and security of FL through several means,
including the development of new algorithms, the em-
ployment of differential privacy techniques, and the
incorporation of blockchain technology within edge
computing environments (Ji et al., 2024)(Wei et al.,
2020)(Qu et al., 2022). These innovations are set
to enhance the scalability and robustness of FL, po-
sitioning it as a viable option for privacy-preserving
machine learning. However, the use of FL in the field
of SCs energy storage systems remains largely unex-
amined, particularly in the context of predicting the
SOH of SCs.
This paper contributes to the literature as it is the
first study to demonstrate that a federated learning ap-
proach with a homomorphic encryption layer is viable
for predicting the SOH in supercapacitors, obtain-
ing similar results to state-of-the-art learning methods
with centralized data.
Predicting the State of Health of Supercapacitors Using a Federated Learning Model with Homomorphic Encryption
885
3 PROPOSED METHOD
This research introduces the use of a FL approach
(Fontenla-Romero et al., 2023), for predicting the
SOH of SCs. This method employs an FL framework
that allows multiple distributed clients to collabora-
tively train a predictive model while preserving the
privacy of their data. The goal is to enable the devel-
opment of a collective learning model among multi-
ple clients without requiring the transfer of potentially
sensitive data to a centralised processing location.
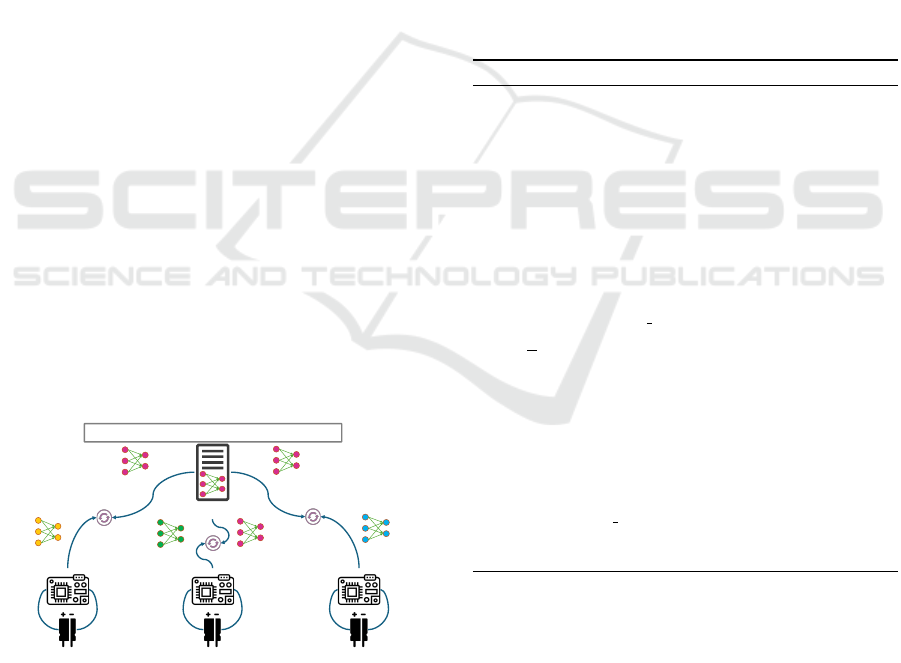
Figure 1 depicts the operational framework of the
FL method, which involves a network of n clients,
each holding data from a limited set of SCs. In an ex-
treme scenario, it might be assumed that each client
has data pertaining to just one SC. Such a scenario
is typical in IoT environments, where there could be
thousands or even millions of SC-powered edge com-
puting devices, including in applications like smart
grids or autonomous vehicles. In particular, each
client p has a local data matrix X
p
∈ R
m×n
p
, which
contains the data from its SCs. The dimensions of
this matrix are indicated by m, which represents the
number of features, and n
p
, which represents the vol-
ume of data. Subsequently, each client is required to
train a single-layer neural network. The parameters
of the neural network are defined by a weight vector
(including the bias), w ∈ R
m×1
, and the output of the
model (y) is obtained as follows:
y = f (X
T
w)
where f : R → R is the nonlinear activation function
at the output neuron. The loss function employed
for training the model was the mean squared error
(MSE) with L2-type regularisation, with the objective
of minimising the risk of overfitting.
Client 1: local data 1
Coordinator
Model 2
Model 1
Model n
Client 2: local data 2
⋯
Client n: local data n
Global
model
Global
model
Global
model
Aggregates local models to obtain a Global model
Figure 1: The proposed method is based on a distributed
architecture approach.
Furthermore, the FL method incorporates HE to
enhance privacy protection. This encryption tech-
nique provides an additional security layer to pre-
vent model inversion attacks, where attackers attempt
to infer training data from the outputs of the ma-
chine learning model. HE ensures user privacy by
encrypting the model parameters that are exchanged
during the learning process. In this research, it is
employed the Cheon-Kim-Kim-Song (CKKS) homo-
morphic encryption scheme (Cheon et al., 2017),
which represents the most effective technique for
conducting approximate homomorphic computations
on encrypted floating-point numbers. Despite being
limited to homomorphic addition and multiplication,
these operations are sufficient for the execution of the
proposed method.
Algorithm 1 presents the pseudocode for the train-
ing process conducted by the clients. To implement
FL at client p, the requisite computations include de-
termining matrices U
p
and S
p
from the singular value
decomposition (SVD) of X
p
F
p
, calculating the vec-
tor m
p
= X
p
F
p
F
p
¯
d
p
, and encrypting this vector using
the CKKS HE scheme to produce the ciphertext Jm
p
K.
The HE operator is denoted by the symbol J · K.
Algorithm 1: Pseudocode for the FedHEONN client.
Inputs for a client p: ▷
X
p
∈ R
m×n
p
▷ Local data block with m inputs and n
p
samples
d
p
∈ R
n
p
×1
▷ The corresponding local vector of desired
outputs
f ▷ Nonlinear activation function (invertible)
Outputs: ▷
Jm
p
K ▷ Encrypted local m vector computed by client p
US
p
▷ Local U ∗ S matrix computed by client p
1: function FEDHEONN CLIENT(X
p
,d
p
, f )
2: X
p
= [ones(1, n
p
);X
p
]; ▷ Bias is added
3: d
p
= f
−1
(d
p
); ▷ Inverse of the neural function
4: f
p
= f
′
(
¯
d
p
); ▷ Derivative of the neural function
5: F
p
= diag(f
p
); ▷ Diagonal matrix
6: [U
p
, S
p
, ∼] = SVD(X
p
∗ F
p
); ▷ Economy size SVD
7: US
p
= U
p
∗ diag(S
p
) ▷ Local product US
p
is
computed
8: m
p
= X
p
∗ (f
p
. ∗ f
p
. ∗
¯
d
p
); ▷ Local vector m
p
is
computed
9: Jm
p
K = ckks encryption(m
p
) ▷ CKKS encryption
10: return Jm
p
K, US
p
11: end function
After each client has trained its local model, these
models are sent to the coordinator. The coordinator
collects the encrypted models from the clients and
synthesises them into a consolidated final model. Al-
gorithm 2 presents the pseudocode for the coordina-
tor’s operations. The coordinator receives a collec-
tion of computations conducted locally by each client,
which includes the encrypted m
p
vectors and US
p
matrices, and builds the global model using the fol-
lowing properties.
ICAART 2025 - 17th International Conference on Agents and Artificial Intelligence
886

• Iwen and Ong (Iwen and Ong, 2016) demon-
strated that the singular value decomposition
(SVD) can be computed in an incremental and
distributed manner. Therefore, the incremental
SVD can be obtained by starting from the SVD
matrices calculated locally by each client, as il-
lustrated in line 6 of algorithm 2.
• The CKKS encryption scheme permits the aggre-
gation of ciphertexts without limit. Consequently,
the homomorphic addition operator shown in line
5 of algorithm 2 can be used to perform the aggre-
gation of the Jm
p
K vectors provided by the clients.
Algorithm 2: Pseudocode for the FedHEONN coordinator.
Inputs: ▷
M list ▷ List containing the encrypted m vectors of the
clients
US list ▷ List containing the US matrices of the clients
λ ▷ Regularization hyperparameter
Outputs: ▷
JwK ∈ R
m×1
▷ Encrpyted optimal weights
1: function FEDHEONN COORDINATOR(M list, US list, λ)
2: JmK = 0 ▷ Zero vector
3: US = [ ] ▷ Empty matrix
4: for Jm
p
K, US
p
in (M list, US list): ▷ Loop through
clients
5: JmK = JmK + Jm
p
K ▷ Aggregation of m vector
6: [U, S, ∼] = SVD([US | US
p
]); ▷ Incremental SVD
7: US = U ∗ diag(S) ▷ Aggregation of US Matrix
8: JwK = U ∗ inv(S ∗S + λI) ∗ (U
T
∗ JmK) ▷ Weights
9: return JwK
10: end function
4 DATASET
The effectiveness of the federated learning method for
supercapacitor SOH prediction was evaluated using a
dataset from Ren et al. (Ren et al., 2020), comprising
113 commercial carbon electrode based SCs (Eaton
Series 1F, 2.7 V model) with a voltage range of 1
to 2.7 V. These SCs underwent 10,000 charging and
discharging cycles in a temperature-controlled envi-
ronmental chamber maintained at 28°C. A total of
88 SCs were subjected to the same constant current
charge-discharge regime, at 20 mA. In contrast to the
capacity fade observed in commercial lithium-ion bat-
teries, which typically begins at negligible levels and
increases significantly towards the end of their lifes-
pan, SCs exhibit rapid degradation during the initial
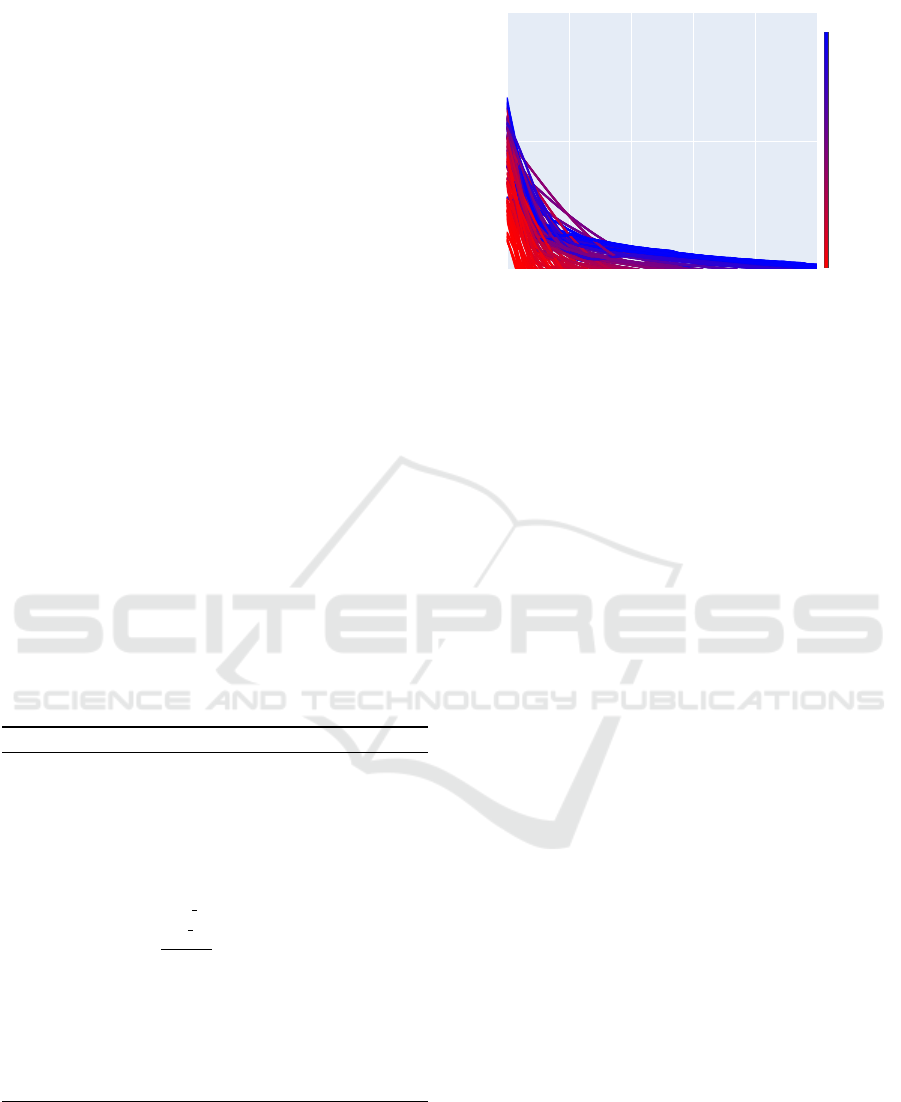
cycles and slower degradation in later cycles. As il-
lustrated in Figure 2, the cycling life of the 88 SCs
varies considerably. For the sake of visual clarity, the
end of useful life threshold has been limited to 0.9 F
in the y-axis coordinates.
0 2000 4000 6000 8000 10000
0.9
1
1.1
2000
4000
6000
8000
Cycle life
2000
4000
6000
8000
Cycle life
2000
4000
6000
8000
Cycle life
2000
4000
6000
8000
Cycle life
2000
4000
6000
8000
Cycle life
2000
4000
6000
8000
Cycle life
2000
4000
6000
8000
Cycle life
2000
4000
6000
8000
Cycle life
2000
4000
6000
8000
Cycle life
2000
4000
6000
8000
Cycle life
2000
4000
6000
8000
Cycle life
2000
4000
6000
8000
Cycle life
2000
4000
6000
8000
Cycle life
2000
4000
6000
8000
Cycle life
2000
4000
6000
8000
Cycle life
2000
4000
6000
8000
Cycle life
2000
4000
6000
8000
Cycle life
2000
4000
6000
8000
Cycle life
2000
4000
6000
8000
Cycle life
2000
4000
6000
8000
Cycle life
2000
4000
6000
8000
Cycle life
2000
4000
6000
8000
Cycle life
2000
4000
6000
8000
Cycle life
2000
4000
6000
8000
Cycle life
2000
4000
6000
8000
Cycle life
2000
4000
6000
8000
Cycle life
2000
4000
6000
8000
Cycle life
2000
4000
6000
8000
Cycle life
2000
4000
6000
8000
Cycle life
2000
4000
6000
8000
Cycle life
2000
4000
6000
8000
Cycle life
2000
4000
6000
8000
Cycle life
2000
4000
6000
8000
Cycle life
2000
4000
6000
8000
Cycle life
2000
4000
6000
8000
Cycle life
2000
4000
6000
8000
Cycle life
2000
4000
6000
8000
Cycle life
2000
4000
6000
8000
Cycle life
2000
4000
6000
8000
Cycle life
2000
4000
6000
8000
Cycle life
2000
4000
6000
8000
Cycle life
2000
4000
6000
8000
Cycle life
2000
4000
6000
8000
Cycle life
2000
4000
6000
8000
Cycle life
2000
4000
6000
8000
Cycle life
2000
4000
6000
8000
Cycle life
2000
4000
6000
8000
Cycle life
2000
4000
6000
8000
Cycle life
2000
4000
6000
8000
Cycle life
2000
4000
6000
8000
Cycle life
2000
4000
6000
8000
Cycle life
2000
4000
6000
8000
Cycle life
2000
4000
6000
8000
Cycle life
2000
4000
6000
8000
Cycle life
2000
4000
6000
8000
Cycle life
2000
4000
6000
8000
Cycle life
2000
4000
6000
8000
Cycle life
2000
4000
6000
8000
Cycle life
2000
4000
6000
8000
Cycle life
2000
4000
6000
8000
Cycle life
2000
4000
6000
8000
Cycle life
2000
4000
6000
8000
Cycle life
2000
4000
6000
8000
Cycle life
2000
4000
6000
8000
Cycle life
2000
4000
6000
8000
Cycle life
2000
4000
6000
8000
Cycle life
2000
4000
6000
8000
Cycle life
2000
4000
6000
8000
Cycle life
2000
4000
6000
8000
Cycle life
2000
4000
6000
8000
Cycle life
2000
4000
6000
8000
Cycle life
2000
4000
6000
8000
Cycle life
2000
4000
6000
8000
Cycle life
2000
4000
6000
8000
Cycle life
2000
4000
6000
8000
Cycle life
2000
4000
6000
8000
Cycle life
2000
4000
6000
8000
Cycle life
2000
4000
6000
8000
Cycle life
2000
4000
6000
8000
Cycle life
2000
4000
6000
8000
Cycle life
2000
4000
6000
8000
Cycle life
Cycles
Capacitance (F)
Figure 2: Capacitance degradation curves over cycles and
cycle life trend for all the SCs.
We used the empirical mode decomposition
(EMD) method to smooth the raw capacitance series
of the SCs by removing high-frequency noise and ob-
taining the residual trend term, which preserves the
characteristics of the original data and improves the
accuracy of predictions (Cao et al., 2022). In addition,
due to the non-linearities of the cycle life exhibited in
SCs, a multi-stage (MS) modification is conceived by
dividing the degradation curves into two decay phases
to predict them separately (Guo et al., 2023).
For the puropose of clarity, Figure 3 shows the
capacitance signal processing and the three different
prediction scenarios performed by the model with the
input data: the original capacitance (a), the residual
capacitance after the EMD process (b), and the fast
and slow residual capacitance degradation phases in
the MS modification (c), independently.
Cycles
Capacitance (F)
Cycles
Cycles
Cycles
EMD
Original Residual
Fast-decay
Slow-decay
(a) (b)
(c)
MS
Capacitance (F)
Capacitance (F)
Capacitance (F)
𝑠
𝑖
(𝑡)
𝑙
𝑖
(𝑡)
𝑢
𝑖
(𝑡)
𝑚
𝑖
(𝑡)
Figure 3: Signal processing and input data in each predic-
tion scenario. (a) Original capacitance. (b) Residual capac-
itance after the EMD process. (c) Fast and slow residual
capacitance degradation phases in the MS modification.
4.1 Empirical Mode Decomposition
The EMD algorithm is a method used for the analy-
sis of non-linear and non-stationary signals. Its core
principle involves the construction of Intrinsic Mode
Functions (IMFs) by identifying the local extrema in
Predicting the State of Health of Supercapacitors Using a Federated Learning Model with Homomorphic Encryption
887
non-stationary signals. Each IMF represents a spe-
cific oscillatory mode within these signals. The EMD
process involves the sequential extraction of each
IMF from the signal, and what remains after all the
IMFs have been removed is the residual component.
The residual thus provides an overview of the over-
all trend of the signal and represents the underlying
change, serving as the final descriptor of the signal’s
behaviour. After EMD decomposition, the original
signal s(t) can be represented as follows:
s(t) =
k
∑
i=1
im f
i
(t) + r
k
(t) (1)
Being r
k
(t) the residual trend term after k itera-
tions.
The EMD decomposition process is subject to two
conditions: the IMF termination condition, which pri-
marily constrains the IMFs and determines their qual-
ity; and the EMD stopping criterion, which is typi-
cally triggered when the residuals r
k
(t) generated dur-
ing the decomposition process exhibit monotonicity
or contain a single extreme point.
Algorithm 3 introduces the pseudocode descrip-
tion of EMD (Cao et al., 2022). The upper and lower
envelopes u
i
(t) and l
i
(t) are obtained by cubic spline
interpolation along maximum and minimum local ex-
trema, respectively, and solved for the mean value
function m
i
(t). The computed difference between s(t)
and m
i
(t) is noted as the function h
i
(t), and k repre-
sents the number of the decomposition.
Algorithm 3: Pseudocode for the EMD process.
Inputs: ▷
s(t) ▷ Original signal
Outputs: ▷
im f
i
(t) ▷ ith IMFs
r
k
(t) ▷ Residual trend
1: for i = 1; i < k; i + + do ▷ Decomposition loop
2: for h
i
(t) does not meet IMF condition do:
3: u
i
(t) = upper envelope(s(t)) ▷ Maximum s(t)
4: l
i
(t) = lower envelope(s(t)) ▷ Minimum s(t)
5: m
i
(t) =
u
i
(t)−l
i
(t)
2
▷ Mean value function
6: h
i
(t) = s(t) − m
i
(t) ▷ Compute the difference
7: s(t) = h
i
(t) ▷ Update s(t) with h
i
(t)
8: end for
9: im f
i
(t) = h
i
(t) ▷ ith IMF
10: r
i
(t) = s(t) − im f
i
(t) ▷ Residual r
i
(t)
11: s(t) = r
i
(t) ▷ Update s(t) with r
i
(t)
12: end for
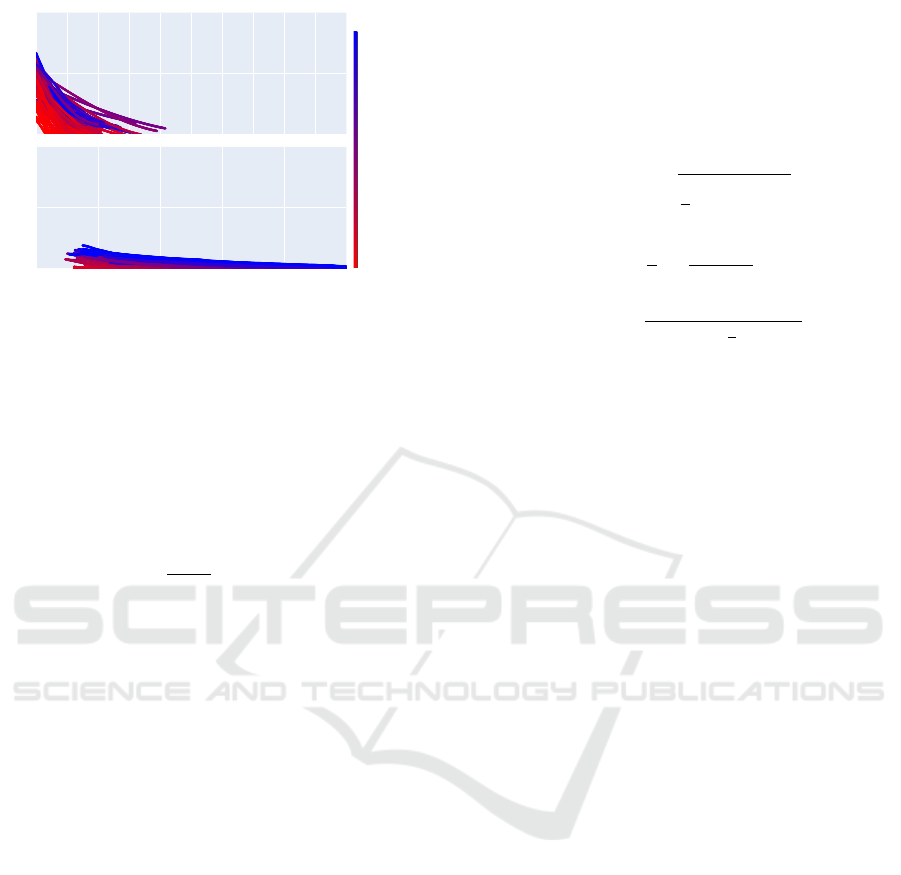
The residual capacitance degradation curves re-
sulting from the EMD process on the 88 SCs are pre-
sented in Figure 4.
0 2000 4000 6000 8000 10000
0.9
1
1.1
2000
4000
6000
8000
Cycle life
2000
4000
6000
8000
Cycle life
2000
4000
6000
8000
Cycle life
2000
4000
6000
8000
Cycle life
2000
4000
6000
8000
Cycle life
2000
4000
6000
8000
Cycle life
2000
4000
6000
8000
Cycle life
2000
4000
6000
8000
Cycle life
2000
4000
6000
8000
Cycle life
2000
4000
6000
8000
Cycle life
2000
4000
6000
8000
Cycle life
2000
4000
6000
8000
Cycle life
2000
4000
6000
8000
Cycle life
2000
4000
6000
8000
Cycle life
2000
4000
6000
8000
Cycle life
2000
4000
6000
8000
Cycle life
2000
4000
6000
8000
Cycle life
2000
4000
6000
8000
Cycle life
2000
4000
6000
8000
Cycle life
2000
4000
6000
8000
Cycle life
2000
4000
6000
8000
Cycle life
2000
4000
6000
8000
Cycle life
2000
4000
6000
8000
Cycle life
2000
4000
6000
8000
Cycle life
2000
4000
6000
8000
Cycle life
2000
4000
6000
8000
Cycle life
2000
4000
6000
8000
Cycle life
2000
4000
6000
8000
Cycle life
2000
4000
6000
8000
Cycle life
2000
4000
6000
8000
Cycle life
2000
4000
6000
8000
Cycle life
2000
4000
6000
8000
Cycle life
2000
4000
6000
8000
Cycle life
2000
4000
6000
8000
Cycle life
2000
4000
6000
8000
Cycle life
2000
4000
6000
8000
Cycle life
2000
4000
6000
8000
Cycle life
2000
4000
6000
8000
Cycle life
2000
4000
6000
8000
Cycle life
2000
4000
6000
8000
Cycle life
2000
4000
6000
8000
Cycle life
2000
4000
6000
8000
Cycle life
2000
4000
6000
8000
Cycle life
2000
4000
6000
8000
Cycle life
2000
4000
6000
8000
Cycle life
2000
4000
6000
8000
Cycle life
2000
4000
6000
8000
Cycle life
2000
4000
6000
8000
Cycle life
2000
4000
6000
8000
Cycle life
2000
4000
6000
8000
Cycle life
2000
4000
6000
8000
Cycle life
2000
4000
6000
8000
Cycle life
2000
4000
6000
8000
Cycle life
2000
4000
6000
8000
Cycle life
2000
4000
6000
8000
Cycle life
2000
4000
6000
8000
Cycle life
2000
4000
6000
8000
Cycle life
2000
4000
6000
8000
Cycle life
2000
4000
6000
8000
Cycle life
2000
4000
6000
8000
Cycle life
2000
4000
6000
8000
Cycle life
2000
4000
6000
8000
Cycle life
2000
4000
6000
8000
Cycle life
2000
4000
6000
8000
Cycle life
2000
4000
6000
8000
Cycle life
2000
4000
6000
8000
Cycle life
2000
4000
6000
8000
Cycle life
2000
4000
6000
8000
Cycle life
2000
4000
6000
8000
Cycle life
2000
4000
6000
8000
Cycle life
2000
4000
6000
8000
Cycle life
2000
4000
6000
8000
Cycle life
2000
4000
6000
8000
Cycle life
2000
4000
6000
8000
Cycle life
2000
4000
6000
8000
Cycle life
2000
4000
6000
8000
Cycle life
2000
4000
6000
8000
Cycle life
2000
4000
6000
8000
Cycle life
2000
4000
6000
8000
Cycle life
2000
4000
6000
8000
Cycle life
2000
4000
6000
8000
Cycle life
Cycles
Capacitance (F)
Figure 4: Residual capacitance degradation curves resulting
from EMD process for all the SCs.
4.2 Multi-Stage Modification
The cycle life curves of supercapacitors exhibit char-
acteristics that have led to the segmentation of the
prediction process into two distinct phases: the rapid
decay phase (fast-decay) and the gradual degrada-
tion phase (slow-decay). The transition between
these phases is determined by identifying the point
where the maximum difference between successive
discharge capacities, calculated over cycles, falls be-
low a predefined threshold. When the difference in
discharge capacities over these cycles consistently re-
mains below the aforementioned threshold, it can be
concluded that the transition to the gradual degrada-
tion stage has been completed.
Figure 5, shows the segmented residual capaci-
tance degradation curves of the 88 SCs (presented in
Figure 4) into fast-decay and slow-decay for a differ-
ential capacitance threshold of 1e-4F over 10 cycles
(Guo et al., 2023). For the first phase, we trained
the model using cycles from the fast-decay stage, and
similarly, for the second phase, we utilised cycles
from the slow-decay stage. The final overall predic-
tive performance is derived from combining the pre-
dictions from both stages, as well as the computa-
tional cost which is calculated as the sum of the train-
ing times measured.
5 EXPERIMENTS AND RESULTS
The effectiveness of the proposed method in predict-
ing the SOH on each configuration was evaluated us-
ing a linear model of the form y = X
T
w with three
regularisation techniques P(w) to avoid overfitting:
Lasso (Tibshirani, 1996), Ridge (Hoerl and Kennard,
1988) and Elastic-net (Zou and Hastie, 2005) (Equa-
tions 2-4, respectively), where α is a scalar value be-
ICAART 2025 - 17th International Conference on Agents and Artificial Intelligence
888
0.9
1
1.1
0 2000 4000 6000 8000 10000
0.9
1
1.1
2000
4000
6000
8000
Cycle life
2000
4000
6000
8000
Cycle life
2000
4000
6000
8000
Cycle life
2000
4000
6000
8000
Cycle life
2000
4000
6000
8000
Cycle life
2000
4000
6000
8000
Cycle life
2000
4000
6000
8000
Cycle life
2000
4000
6000
8000
Cycle life
2000
4000
6000
8000
Cycle life
2000
4000
6000
8000
Cycle life
2000
4000
6000
8000
Cycle life
2000
4000
6000
8000
Cycle life
2000
4000
6000
8000
Cycle life
2000
4000
6000
8000
Cycle life
2000
4000
6000
8000
Cycle life
2000
4000
6000
8000
Cycle life
2000
4000
6000
8000
Cycle life
2000
4000
6000
8000
Cycle life
2000
4000
6000
8000
Cycle life
2000
4000
6000
8000
Cycle life
2000
4000
6000
8000
Cycle life
2000
4000
6000
8000
Cycle life
2000
4000
6000
8000
Cycle life
2000
4000
6000
8000
Cycle life
2000
4000
6000
8000
Cycle life
2000
4000
6000
8000
Cycle life
2000
4000
6000
8000
Cycle life
2000
4000
6000
8000
Cycle life
2000
4000
6000
8000
Cycle life
2000
4000
6000
8000
Cycle life
2000
4000
6000
8000
Cycle life
2000
4000
6000
8000
Cycle life
2000
4000
6000
8000
Cycle life
2000
4000
6000
8000
Cycle life
2000
4000
6000
8000
Cycle life
2000
4000
6000
8000
Cycle life
2000
4000
6000
8000
Cycle life
2000
4000
6000
8000
Cycle life
2000
4000
6000
8000
Cycle life
2000
4000
6000
8000
Cycle life
2000
4000
6000
8000
Cycle life
2000
4000
6000
8000
Cycle life
2000
4000
6000
8000
Cycle life
2000
4000
6000
8000
Cycle life
2000
4000
6000
8000
Cycle life
2000
4000
6000
8000
Cycle life
2000
4000
6000
8000
Cycle life
2000
4000
6000
8000
Cycle life
2000
4000
6000
8000
Cycle life
2000
4000
6000
8000
Cycle life
2000
4000
6000
8000
Cycle life
2000
4000
6000
8000
Cycle life
2000
4000
6000
8000
Cycle life
2000
4000
6000
8000
Cycle life
2000
4000
6000
8000
Cycle life
2000
4000
6000
8000
Cycle life
2000
4000
6000
8000
Cycle life
2000
4000
6000
8000
Cycle life
2000
4000
6000
8000
Cycle life
2000
4000
6000
8000
Cycle life
2000
4000
6000
8000
Cycle life
2000
4000
6000
8000
Cycle life
2000
4000
6000
8000
Cycle life
2000
4000
6000
8000
Cycle life
2000
4000
6000
8000
Cycle life
2000
4000
6000
8000
Cycle life
2000
4000
6000
8000
Cycle life
2000
4000
6000
8000
Cycle life
2000
4000
6000
8000
Cycle life
2000
4000
6000
8000
Cycle life
2000
4000
6000
8000
Cycle life
2000
4000
6000
8000
Cycle life
2000
4000
6000
8000
Cycle life
2000
4000
6000
8000
Cycle life
2000
4000
6000
8000
Cycle life
2000
4000
6000
8000
Cycle life
2000
4000
6000
8000
Cycle life
2000
4000
6000
8000
Cycle life
2000
4000
6000
8000
Cycle life
2000
4000
6000
8000
Cycle life
2000
4000
6000
8000
Cycle life
Cycles
Capacitance (F)Capacitance (F)
Fast-decay stage
Slow-decay stage
Figure 5: Residual capacitance degradation curves seg-
mented into fast-decay and slow-decay stages for a differ-
ential capacitance threshold of 1e-4F over 10 cycles (Guo
et al., 2023).
tween 0 and 1, and w are the weights of the model.
P(w) = ∥w∥
1
(2)
P(w) = ∥w∥
2
2
(3)
P(w) =
1 − α
2
∥w∥
2
2
+ α∥w∥
1
(4)
In addition, conventional non-linear methods,
such as multilayer perceptron (MLP) and support vec-
tor machine for regression (SVR) were also tested.
In all cases, the mean-squared error (MSE) was em-
ployed as the loss function.
For the training process and selection of the best
model, a 10-fold cross-validation (CV) was employed
using 80% of the SCs. In order to achieve early pre-
diction, the training data comprised the first 100 sam-
ples of the SCs complete cycle life. The remaining
20% of the SCs was reserved for the purpose of test-
ing the model performance at inference.
The models received an input sequence of capac-
itance values, with the target of predicting the future
capacitance according to the cycle steps considered.
These cycle steps are 10, 50, and 100.
For the federated model (FedHEONN), an ex-
treme case was tested, in which each client contains
data for only one SC. In contrast, the reference mod-
els were trained using a traditional approach, with all
data centralised on a single computer. The execution
time taken for the training process was recorded in
order to assess the computational efficiency.
Three metrics were employed to assess the pre-
dictive performance of the models: the root-mean-
squared error (RMSE), expressed in units of capac-
itance, the mean-absolute-percentage error (MAPE),
expressed as a percentage of the systematic error com-
mitted, and the coefficient of determination (R
2
), ex-
pressed as a percentage of how well observed cycle
capacitance is replicated by the model. The metrics
are defined in Equations 5-7, where y
i
is the observed
cycle capacitance, ˆy
i
is the predicted cycle capaci-
tance, and n is the total number of samples.
RMSE =
s
1
n
n
∑
i=1
(y
i
− ˆy
i
)
2
(5)
MAPE =
1
n
n
∑
i=1
(y
i
− ˆy
i
)
y
i
× 100 (6)
R
2
= 1 −
∑
n
i=1
(y
i
− ˆy
i
)
∑
n
i=1
(y
i
−
1
n
∑
n
i=1
y
i
)
(7)
In order to provide a comprehensive overview, the
global error metrics committed for all models on the
test SCs, are summarized in Table 1. Each column
represents the model evaluated, the cycle steps con-
sidered for the input sequence and prediction horizon,
the RMSE, the MAPE, the R
2
and the training time
measured. The best scores are highlighted in bold for
the different configurations.
In the first case scenario, when considering the
original capacitance degradation curves for predic-
tion, the FedHEONN model achieved the optimal
RMSE, MAPE and R
2
for 10 cycle steps. Concern-
ing the second model configuration, where the resid-
ual capacitance resulting from the EMD process is the
target signal, the EMD-FedHEONN model achieves
the best RMSE, MAPE and R
2
for 100 cycle steps.
Similarly, for the third model configuration, which
includes the aforementioned residual capacitance di-
vided into fast and slow decay phases, EMD-MS-
FedHEONN maintains the optimal RMSE and R
2
,
with the third best MAPE for 50 cycle steps, just be-
hind EMD-MS-Elastic-net and EMD-MS-Lasso with
10 cycle steps. In each case, the proposed method
recorded the lowest training times.
As for the cycle steps, they affect both the width
of the input sequence and the scope of the predic-
tion horizon, which repercute directly on the compu-
tational cost and the predicting performance. How-
ever, while a higher number of cycle steps is associ-
ated with an increase in the duration of the training
process, the configurations of FedHEONN and linear
models may yield lower error metrics.
6 CONCLUSIONS
In this study, we have employed a cutting-edge
FL framework using single-layer neural network en-
hanced with HE to predict the SOH of SCs. While
Predicting the State of Health of Supercapacitors Using a Federated Learning Model with Homomorphic Encryption
889

Table 1: Error metrics and training times for all models
evaluated on the test SCs.
Model Cycle steps RMSE (F) MAPE (%) R
2
(%) Time (s)
Lasso
10 1.390e-3 1.250e-3 99.918 0.432
50 5.102e-3 5.831e-3 98.848 0.904
100 6.255e-3 7.122e-3 98.211 2.427
Ridge
10 3.505e-3 3.249e-3 99.482 12.48
50 6.178e-3 7.064e-3 98.314 37.97
100 6.927e-3 7.899e-3 97.806 73.48
Elastic-net
10 1.640e-3 1.466e-3 99.887 0.241
50 5.219e-3 5.960e-3 98.798 0.910
100 6.512e-3 7.422e-3 98.061 2.763
MLP
10 2.142e-3 2.123e-3 99.806 359.7
50 4.890e-3 5.435e-3 98.944 361.1
100 1.507e-2 1.732e-2 89.606 333.4
SVR
10 9.730e-3 1.010e-2 96.009 38.51
50 1.564e-2 1.792e-2 89.203 41.54
100 1.971e-2 2.255e-2 82.228 52.01
FedHEONN
10 1.255e-3 1.126e-3 99.934 0.280
50 4.926e-3 5.630e-3 98.929 0.842
100 3.596e-3 4.067e-3 99.409 2.055
EMD-Lasso
10 6.228e-4 5.536e-4 99.985 0.530
50 6.928e-4 6.105e-4 99.980 1.718
100 4.416e-4 4.283e-4 99.992 2.989
EMD-Ridge
10 8.824e-4 7.980e-4 99.969 12.59
50 1.486e-3 1.305e-3 99.911 38.93
100 5.982e-4 5.668e-4 99.985 78.01
EMD-Elastic-net
10 6.865e-4 6.123e-4 99.981 0.374
50 9.377e-4 8.250e-4 99.964 2.263
100 4.736e-4 4.610e-4 99.991 4.603
EMD-MLP
10 1.422e-3 1.477e-3 99.920 401.3
50 2.888e-3 2.562e-3 99.662 303.0
100 5.818e-3 5.874e-3 98.583 361.0
EMD-SVR
10 5.662e-3 4.350e-3 98.737 30.97
50 5.836e-3 4.540e-3 98.620 36.47
100 1.143e-2 9.725e-3 94.531 44.58
EMD-FedHEONN
10 6.370e-4 5.590e-4 99.984 0.264
50 5.018e-4 5.394e-4 99.990 0.831
100 2.888e-4 2.402e-4 99.996 2.429
EMD-MS-Lasso
10 3.326e-4 2.031e-4 99.996 0.785
50 5.252e-4 5.149e-4 99.989 3.095
100 4.367e-4 4.212e-4 99.992 11.57
EMD-MS-Ridge
10 4.529e-4 2.483e-4 99.992 30.56
50 8.394e-4 5.990e-4 99.972 83.37
100 5.314e-4 5.290e-4 99.988 168.4
EMD-MS-Elastic-net
10 3.599e-4 1.998e-4 99.995 0.848
50 5.826e-4 4.981e-4 99.986 5.229
100 4.428e-4 4.286e-4 99.992 14.92
EMD-MS-MLP
10 7.527e-4 8.303e-4 99.978 667.1
50 1.873e-3 1.859e-3 98.858 751.8
100 5.137e-3 3.158e-3 98.898 678.5
EMD-MS-SVR
10 2.028e-3 1.006e-3 99.838 60.27
50 2.092e-3 1.204e-3 99.823 68.19
100 4.176e-3 2.766e-3 99.272 93.78
EMD-MS-FedHEONN
10 3.567e-4 2.370e-4 99.995 0.522
50 2.849e-4 2.326e-4 99.997 1.651
100 3.299e-4 2.961e-4 99.995 3.786
several ML strategies for SOH prediction have been
explored in the literature, none have yet integrated
such estimations within a federated learning context,
which is increasingly relevant in practical scenarios
such as on the IoT environments. The contribution of
this work is a novel approach to SOH prediction based
on the integration of federated learning and HE. The
proposed FedHEONN model demonstrates optimal
performance compared to traditional centralised ML
models, while also offering enhanced privacy through
local training and data encryption. The distributed
structure of this approach also helps to decrease the
network’s data load, which is a significant advantage
in IoT settings where vast amounts of data are ex-
changed. Furthermore, the HE method provides an
additional layer of security, protecting against privacy
threats such as model inversion attacks. This encryp-
tion technology enables operations on encrypted data,
ensuring the outcomes remain unchanged.
The proposed approach was tested using a public
data set with 88 commercial carbon-electrode based
SCs (Eaton Series 1F, 2.7 V model) cycled under
constant current regimen in a temperature-controlled
environmental chamber. In addition, to validate the
model and assess its performance, a set of linear
methods with different regularisation techniques (i.e.,
Lasso, Ridge and Elastic-net) and non-linear methods
such as a MLP and SVR, were proposed.
Multiple experiments were conducted considering
different cycle steps (10, 50 and 100) and SOH pre-
diction scenarios: the original capacitance, the resid-
ual capacitance resulting after EMD proccess, and
the residual capacitance after EMD process in MS
analysis. The results obtained demonstrate that Fed-
HEONN achieved equivalent metrics to conventional
ML models, while exhibiting a reduced computa-
tional cost due to its distributed architecture. The
EMD-MS-FedHEONN model obtained the optimal
RMSE and R
2
(2.849e-4 F and 99.997%), along with
the third best MAPE (2.326e-4%) for 50 cycle steps.
Alternatively, the lowest training time was recorded
by the EMD-FedHEONN model with 0.264s for 10
cycle steps.
Despite its simpler structure with no hidden lay-
ers, the experiments conducted indicate that Fed-
HEONN is capable of achieving competitive results
in predicting the SOH of SCs. These findings suggest
that a FL method may be considered as an alternative
to meet this challenge while offering more capabili-
ties than other traditional ML techniques.
ACKNOWLEDGEMENTS
This work has been supported by Xunta de Gali-
cia through Axencia Galega de Innovaci
´
on (GAIN)
by grant IN853C 2022/01, Centro Mixto de In-
vestigaci
´
on UDC-NAVANTIA “O estaleiro do fu-
turo”, co-funded by ERDF funds from the EU in
the framework of program FEDER Galicia 2021-
2027. CITIC is funded by “Conseller
´
ıa de Cultura,
Educaci
´
on e Universidade from Xunta de Galicia”,
supported by ERDF Operational Programme Galicia
2014-2020 and “Secretar
´
ıa Xeral de Universidades”
(Grant ED431G 2023/01) and the authors belonging
to the CITIC are also supported by the Xunta de Gali-
cia (Grant ED431C 2022/44) and the European Union
ERDF funds.
ICAART 2025 - 17th International Conference on Agents and Artificial Intelligence
890

REFERENCES
Banabilah, S., Aloqaily, M., Alsayed, E., Malik, N., and
Jararweh, Y. (2022). Federated learning review:
Fundamentals, enabling technologies, and future ap-
plications. Information processing & management,
59(6):103061.
Banerjee, S., De, B., Sinha, P., Cherusseri, J., and Kar, K. K.
(2020). Applications of supercapacitors. Handbook of
Nanocomposite Supercapacitor Materials I: Charac-
teristics, pages 341–350.
Cao, Y., Ji, R., Huang, X., Lei, G., Shao, X., and You, I.
(2022). Empirical mode decomposition-empowered
network traffic anomaly detection for secure multipath
tcp communications. Mobile Networks and Applica-
tions, 27(6):2254–2263.
Cheon, J. H., Kim, A., Kim, M., and Song, Y. (2017). Ho-
momorphic encryption for arithmetic of approximate
numbers. In Advances in Cryptology–ASIACRYPT
2017: 23rd International Conference on the Theory
and Applications of Cryptology and Information Se-
curity, Hong Kong, China, December 3-7, 2017, Pro-
ceedings, Part I 23, pages 409–437. Springer.
Fontenla-Romero, O., Guijarro-Berdi
˜
nas, B., Hern
´
andez-
Pereira, E., and P
´
erez-S
´
anchez, B. (2023). Fedheonn:
Federated and homomorphically encrypted learning
method for one-layer neural networks. Future Gen-
eration Computer Systems, 149:200–211.
Gheytanzadeh, M., Baghban, A., Habibzadeh, S., Mohad-
despour, A., and Abida, O. (2021). Insights into the
estimation of capacitance for carbon-based superca-
pacitors. RSC advances, 11(10):5479–5486.
Guo, F., Lv, H., Wu, X., Yuan, X., Liu, L., Ye, J., Wang,
T., Fu, L., and Wu, Y. (2023). A machine learning
method for prediction of remaining useful life of su-
percapacitors with multi-stage modification. Journal
of Energy Storage, 73:109160.
Hoerl, A. and Kennard, R. (1988). Ridge regression, in
‘encyclopedia of statistical sciences’, vol. 8.
Huang, Y., Gupta, S., Song, Z., Li, K., and Arora, S. (2021).
Evaluating gradient inversion attacks and defenses in
federated learning. Advances in Neural Information
Processing Systems, 34:7232–7241.
Iwen, M. A. and Ong, B. (2016). A distributed and incre-
mental svd algorithm for agglomerative data analysis
on large networks. SIAM Journal on Matrix Analysis
and Applications, 37(4):1699–1718.
Ji, S., Tan, Y., Saravirta, T., Yang, Z., Liu, Y., Vasankari,
L., Pan, S., Long, G., and Walid, A. (2024). Emerg-
ing trends in federated learning: From model fusion
to federated x learning. International Journal of Ma-
chine Learning and Cybernetics, pages 1–22.
Laadjal, K. and Marques Cardoso, A. J. (2021). A review
of supercapacitors modeling, soh, and soe estimation
methods: Issues and challenges. International Journal
of Energy Research, 45(13):18424–18440.
Li, L., Fan, Y., Tse, M., and Lin, K.-Y. (2020). A review
of applications in federated learning. Computers &
Industrial Engineering, 149:106854.
Li, Q., Wen, Z., Wu, Z., Hu, S., Wang, N., Li, Y., Liu,
X., and He, B. (2021). A survey on federated learn-
ing systems: Vision, hype and reality for data privacy
and protection. IEEE Transactions on Knowledge and
Data Engineering, 35(4):3347–3366.
Mothukuri, V., Parizi, R. M., Pouriyeh, S., Huang, Y., De-
hghantanha, A., and Srivastava, G. (2021). A survey
on security and privacy of federated learning. Future
Generation Computer Systems, 115:619–640.
Panhwar, I. H., Ahmed, K., Seyedmahmoudian, M., Sto-
jcevski, A., Horan, B., Mekhilef, S., Aslam, A., and
Asghar, M. (2020). Mitigating power fluctuations for
energy storage in wind energy conversion system us-
ing supercapacitors. IEEE Access, 8:189747–189760.
Qu, Y., Uddin, M. P., Gan, C., Xiang, Y., Gao, L., and Year-
wood, J. (2022). Blockchain-enabled federated learn-
ing: A survey. ACM Computing Surveys, 55(4):1–35.
Ren, J., Lin, X., Liu, J., Han, T., Wang, Z., Zhang, H., and
Li, J. (2020). Engineering early prediction of superca-
pacitors’ cycle life using neural networks. Materials
Today Energy, 18:100537.
Rocabert, J., Capo-Misut, R., Mu
˜
noz-Aguilar, R. S., Can-
dela, J. I., and Rodriguez, P. (2018). Control of en-
ergy storage system integrating electrochemical bat-
teries and supercapacitors for grid-connected applica-
tions. IEEE Transactions on Industry Applications,
55(2):1853–1862.
Sawant, V., Deshmukh, R., and Awati, C. (2023). Machine
learning techniques for prediction of capacitance and
remaining useful life of supercapacitors: A compre-
hensive review. Journal of Energy Chemistry, 77:438–
451.
Tibshirani, R. (1996). Regression shrinkage and selection
via the lasso. Journal of the Royal Statistical Society
Series B: Statistical Methodology, 58(1):267–288.
Wei, K., Li, J., Ding, M., Ma, C., Yang, H. H., Farokhi,
F., Jin, S., Quek, T. Q., and Poor, H. V. (2020). Fed-
erated learning with differential privacy: Algorithms
and performance analysis. IEEE transactions on in-
formation forensics and security, 15:3454–3469.
Zhang, J., Gu, M., and Chen, X. (2023). Supercapacitors
for renewable energy applications: A review. Micro
and Nano Engineering, page 100229.
Zhang, S. and Pan, N. (2015). Supercapacitors per-
formance evaluation. Advanced Energy Materials,
5(6):1401401.
Zhao, J., Gao, Y., and Burke, A. F. (2017). Performance
testing of supercapacitors: Important issues and un-
certainties. Journal of Power Sources, 363:327–340.
Zou, H. and Hastie, T. (2005). Regularization and vari-
able selection via the elastic net. Journal of the Royal
Statistical Society Series B: Statistical Methodology,
67(2):301–320.
Zou, Z., Cao, J., Cao, B., and Chen, W. (2015). Evaluation
strategy of regenerative braking energy for superca-
pacitor vehicle. ISA transactions, 55:234–240.
Predicting the State of Health of Supercapacitors Using a Federated Learning Model with Homomorphic Encryption
891
