
Game-Based Ergonomic Adaptation of User Interfaces for Online
Learning Environments
Niels Seidel
a
CATALPA, FernUniversit
¨
at in Hagen, Universit
¨
atsstr. 27, 58097 Hagen, Germany
Keywords:
Ability-Based Design, User Interface Adaption, Personalized User Interfaces, Adoption.
Abstract:
The standardization of user interfaces makes it more difficult for people with physical or mental impairments
to operate software and hardware. Incorrect inputs, longer reaction times, and slower operation are the price
to be paid for the standardized appearance. The ability-based design approach considers users’ individual
abilities and adapts the user interface accordingly. This paper presents a computer game to measure cognitive
and motor skills, which will be used to adapt ergonomic parameters individually. The adaptation is based
on key figures from the tap and pan inputs, summarized in user profiles. In a study with a heterogeneous
group of 43 participants, apparent differences concerning the examined abilities could be diagnosed. A larger
representation of control objects positively affected hit rate, hit accuracy, and reaction time. More considerable
distances between control elements did not necessarily lead to a higher hit rate. Drag’n’drop interactions
caused great difficulties for participants with shaky hands. In a case study, we demonstrate the implementation
of an adaptive user interface for the Moodle online learning environment. The high individual deviations
compared to the whole group underline the need for ergonomically adaptive graphical user interfaces.
1 INTRODUCTION
The standardization of user interfaces (UI) makes it
more difficult for people with motor or cognitive im-
pairments to operate software and hardware (Wang
et al., 2024; Moured et al., 2024; Castilla et al., 2020;
Caldwell et al., 2008). Incorrect inputs, higher re-
sponse times, and slower operation are the price to
be paid for the standardized appearance. This applies
to applications for smartphones, tablets, and desktop
computers, as they are not only used by the archetypal
users to whom attention was paid in the user interface
design. The inclusion of broad user groups is a sig-
nificant concern. For instance, 80 million Europeans
(10.7 % of the population) live with one or more types
of disability. Many are excluded from using standard-
ized user interfaces of software and hardware appli-
cations due to medical conditions or having problems
operating them (Naughton, 2017).
This also applies to students in higher education.
Firstly, the proportion of students with physical dis-
abilities is just as high as in society as a whole. Sec-
ondly, students are reluctant to disclose their impair-
ment to the university and to demand accessible ser-
vices from lecturers or those responsible for learn-
a
https://orcid.org/0000-0003-1209-5038
ing applications (e.g., Learning Management Systems
(LMS)) (Riddell and Weedon, 2014). Thirdly, online
learning is assumed to increase in higher education
due to transitions made during the pandemic and the
emerging potential of artificial intelligence. Fourthly,
distance learning universities are particularly affected
because the average age is 10 to 15 years higher than
at other higher education institutions (Schmidtmann
and Preusse, 2015), and impairments gradually in-
crease with age.
(Wobbrock et al., 2018) presented ability-based
design as a promising solution for this problem. This
approach focuses on the user as an individual with
abilities. Users should not have to adapt to an ap-
plication; instead, the applications should be adapted
to their specific and personal needs and abilities. The
user’s behavior is analyzed for this purpose. Based
on this data, the system can, for example, adapt the
user interface according to the user’s abilities (Wob-
brock et al., 2011). No generalization is made because
this would, in turn, exclude many people from using
it. Instead, an attempt is made to create a user pro-
file by analyzing individual usage behavior and data
from the available input devices, including sensors.
As a result, the software or hardware systems adapt
their user interface according to the created and con-
Seidel, N.
Game-Based Ergonomic Adaptation of User Interfaces for Online Learning Environments.
DOI: 10.5220/0013215900003932
Paper published under CC license (CC BY-NC-ND 4.0)
In Proceedings of the 17th International Conference on Computer Supported Education (CSEDU 2025) - Volume 1, pages 255-265
ISBN: 978-989-758-746-7; ISSN: 2184-5026
Proceedings Copyright © 2025 by SCITEPRESS – Science and Technology Publications, Lda.
255

stantly updated user model and provide the user with
a personalized and, therefore, more ergonomic user
interface.
The approach of ability-based design is thus com-
plementary to established methods of responsive de-
sign. Instead of adapting the user interfaces to the
device’s requirements (e.g., the display size), the user
interface adapts to the user. In contrast to the W3C
recommendations for accessible applications (W3C,
2011) and content (Caldwell et al., 2008), the focus
of ability-based design is not on accessibility for tar-
get groups with physical or cognitive limitations but
on the promotion of abilities. The approach thus at-
tempts to do justice through design to those target
groups who do not perceive themselves as limited.
(Wobbrock et al., 2018) points out that people’s abili-
ties can be affected not only by disabilities but also by
disabling situations. Designing for individual abilities
should benefit everyone through more user-friendly
and accessible applications.
This paper presents a game that measures cog-
nitive and motor skills for the personalized adapta-
tion of ergonomic features. From the measured val-
ues obtained in the game, metrics for specific abilities
are calculated and summarized in individual profiles.
These profiles are available for the individual adapta-
tion of the user interface in different adaptive systems.
A study is presented to determine suitable metrics
and value ranges in which 43 participants tested the
game under real-world conditions. In a case study, we
demonstrate the implementation of a game-based user
interface adaptation in Moodle’s online learning envi-
ronment, including game-based adaptation sources.
The remainder of this paper is structured as fol-
lows: Section 2 covers related research, Section 3 de-
tails game design and implementation, Section 4 dis-
cusses data evaluation from a user study, and Section
5 explores adaptive data integration in Moodle. The
final section provides conclusions and outlook.
2 REALTED WORKS
A person’s limitations and abilities can be roughly di-
vided into vision, hearing, motor skills, and cogni-
tion. In terms of abilities, there is also a continuum
between non-changing and constantly changing abil-
ities. Adaptation to situational limitations and, thus,
changing abilities of users have already been investi-
gated in several studies (Bihler et al., 2009; Perry and
Hourcade, 2008). In contrast, longer-term or perma-
nent limitations, while highlighted as important fac-
tors influencing UI design (e.g., (Henze et al., 2011)),
rarely result in personalized user interfaces for hetero-
geneous audiences (Kurschl et al., 2012; Kane et al.,
2008). Some studies only focus on specific applica-
tions such as computer games (Kurschl et al., 2012;
Bihler et al., 2009) or recommender systems (Moon
et al., 2017), although the collected user data could
be used to personalize multiple applications.
Sensor data from mobile devices (Bihler et al.,
2009; Paymans et al., 2004), tracking data from the
running application (Moon et al., 2017), or user sur-
veys (Gajos and Chauncey, 2017; Parhi et al., 2006)
have been used for adaptation before. Tracking data
was used to detect a user’s handedness, for exam-
ple. How handedness can affect performance when
operating different devices and interaction techniques
has been studied several times (Perry and Hourcade,
2008; Inkpen et al., 2006; Silfverberg et al., 2000),
but it has not yet been directly translated into adaptive
UIs. (Galindo et al., 2018) presented four design op-
tions in an adaptive UI. For this purpose, they detected
the users’ emotional state through facial expressions
photographed during runtime. (Henze et al., 2011)
took a different approach and collected touch input
data from a game app for more than a year to em-
ploy comprehensive analyses but not for adaptation.
(Gajos et al., 2010) tested the motor skills of experi-
mental participants in a test and adapted the UI of the
subsequently examined application according to the
test results.
Modeling of adaptation behavior is usually based
on key figures calculated from the collected data. For
pointing devices like a mouse, touchpad, or touch-
screen, the following metrics can be found in the liter-
ature: error rate during object selection (Henze et al.,
2011), error rate per object size (Henze et al., 2011),
processing time of a task (Parhi et al., 2006), ratio of
incorrectly processed tasks (Parhi et al., 2006), task
hit distribution (Parhi et al., 2006), history of touch
movements (Lee and Choi, 2011).
The number of metrics results in a vast design
space for the user interface as the target of adapta-
tion (Bouzit et al., 2016). However, the design space
should be reduced to a reasonable level in favor of
recognizing the familiar UI elements, the ease of use,
and the learnability (Paymans et al., 2004). Most of
the existing works focussed on the adaptation of in-
dividual design elements. For example, the optimal
size of control elements has been investigated sev-
eral times (Bihler et al., 2009; Henze et al., 2011;
Parhi et al., 2006), but without considering users’ in-
dividual abilities. This applies equally to one-handed
operation with the thumb (Parhi et al., 2006; Perry
and Hourcade, 2008). (Gajos and Chauncey, 2017),
on the other hand, have used so-called Split Adap-
tive Interfaces that reserve a limited portion of the
CSEDU 2025 - 17th International Conference on Computer Supported Education
256

screen for quick-launch elements. More comprehen-
sive user interface adaptations consider the placement
(Lee and Choi, 2011; Perry and Hourcade, 2008) and
orientation (Bihler et al., 2009) of elements as well as
the overall layout (Moon et al., 2017; Galindo et al.,
2018).
(de Santana and Silva, 2019) presented a client-
side measurement of user activities, with the help of
the freely accessible data logger WELFIT
1
. Detailed
web user data can be continuously collected and au-
tomatically analyzed for empirical evaluations.
Over the last two decades, there has been a sub-
stantial advance in developing adaptive learning envi-
ronments (e.g., (Martin et al., 2020). This trend can
be attributed to several factors, including the evolving
availability of student data, the increasing importance
of online learning, the advances in AI, and the awak-
ening awareness of educational institutions to address
student diversity (De Clercq et al., 2020). However,
in none of these studies and systems was the user in-
terface adapted to improve individual usability, acces-
sibility, or the learner’s different cognitive and motor
abilities. Therefore, the system proposed in this paper
is intended to contribute to extending adaptive learn-
ing systems with an adaptive ability-based UI.
3 GAME DESIGN AND METRICS
Because motor and cognitive skills in traditional
WIMP (Windows, Icons, Menus, Pointer) interfaces
are not measurable or only discernible after extended
periods of use, an application-independent computer
game that can be played repeatedly and in various
contexts is proposed for collecting metric data. Mea-
sures are computed and integrated into a user model
from the values measured within the game. Based
on this user model, adaptations to the graphical user
interface of arbitrary WIMP applications can be im-
plemented, enhancing the interaction and accessibil-
ity tailored to individual user profiles.
In conceptualizing the game, stringent criteria
were adhered to: Initially, the game’s theme was cu-
rated to resonate with a diverse demographic, ensur-
ing broad appeal and engagement. Subsequently, the
game was architectured as a standalone application,
capable of seamless integration as a desktop or web
app within a spectrum of extant applications, irre-
spective of their specific functionalities. Lastly, the
game was engineered to meticulously capture and
process user input data in real-time into a user model.
1
See the Web Event Logger and Flow Evaluation Tool
at https://github.com/IBM/user-test-logger (last accessed
2024/10/29.
This user model serves as a cornerstone, facilitating
the immediate application and refinement of adaptive
user interfaces upon the game’s conclusion, thereby
streamlining the user’s interaction experience.
3.1 Game Design
The design of the game was underpinned with a set
of design principles (e.g., ‘play’ as grounded in So-
cial Constructivist Theory, ‘challenge’ as grounded
in Zone of Proximate Development Theory) and de-
sign patterns for game design (Bj
¨
ork et al., 2003).
The applied design process was based on Fullerton’s
player-centric four-step iterative design methodology
(Fullerton, 2008). This process comprises idea gen-
eration, formalization, testing, and results evaluation.
Existing browser games, literature about games and
game patterns (Bj
¨
ork et al., 2003), and measurable
cognitive and motor skills inspired the ideation pro-
cess in a group of three designers. We defined the
following player experience goals: (1) Ensuring play-
ers feel challenged but not overwhelmed, keeping
them motivated to progress. (2) Encouraging play-
ers to maintain concentration and testing their cog-
nitive skills under various scenarios. (3) Creating a
game environment that assesses and stimulates fine
motor skills through precise controls. (4) Allowing
players to feel accomplished upon completing levels.
Based on these goals, we formalized the game me-
chanics (e.g., level structure, core actions, feedback
loops, scores) and established rules and constraints
(e.g., rules, time limits, and level constraints). We’ve
selected nature as the game’s theme because it is a
universal topic, especially since many content exten-
sions can be imagined. Different abilities could be
measured using appropriate methods by dividing the
game app into several games and game levels. The
measurement methods, including the resulting data,
determined the game’s task design. The actions per-
formed by a user playing a game section required rep-
etitions to increase the accuracy of the metrics. De-
spite this necessary repetition of actions, the game
should not appear monotonous. We limited the play-
ing time for each section to provide a certain degree
of variety and playful challenges.
The authors and several partly gaming-
experienced volunteers playtested early ideas
and prototyped games. Feedback from playtesting
sessions was continually used to refine and improve
the game, ensuring each iteration was better aligned
with cognitive and motor skill assessment goals and
enhanced the player experience.
Using the Unity game engine and the C# program-
ming language, a total of three games (see Figure 1)
Game-Based Ergonomic Adaptation of User Interfaces for Online Learning Environments
257

were developed with a total of 6 levels.
The first game consists of three levels and is about
chasing moles out of the garden. The animals appear
randomly at different positions on the screen and have
to be hit as quickly as possible. In the process, the
user’s reaction time is recorded. At the same time, it
is tested whether and how accurately the target object
was hit. This provides information about the user’s
hand-eye coordination, attention, and speed. This
principle makes it possible to test the factors under
different conditions, which is why the objects in the
1st level change in size after hits have been made.
The input required is a simple touch on the screen or
a mouse click. This model was extended in the sec-
ond level of the first game, in that a mole must be hit
not just once but several times in a row. This addi-
tionally allows testing the speed of the hands over a
longer period. In order to check how far apart small
objects should be, we presented several moles in the
third level of which one has to be selected.
In the second game, green and red apples must be
placed in the corresponding bucket. By swiping with
the finger or dragging while holding down the mouse
button, the objects must be moved over a longer dis-
tance, some of which are curved and have obstacles.
The game duration is limited to 90 or 60 seconds.
This allows for testing not only the coordination abil-
ity but also the tremulousness and speed of the hand.
The size of the displayed objects (in the case of ap-
ples) and buttons was adaptively adjusted based on
the first game’s results. Due to the variable object
size, the number of objects displayed simultaneously
varied, with no more than 12 apples appearing simul-
taneously. The coloring of red and green apples in
the first level and yellow and blue plums in the sec-
ond level allowed the detection of the two most com-
mon color vision deficits (The National Eye Institute
(NEI), 2015).
The task of the last game is to throw stones over
the water. Here, the 1st level tests handedness as an-
other important parameter for developing an adaptive,
ergonomic design. Handedness can be indicated by
the movement of the thumb or mouse on the screen.
Recognizing handedness is necessary for one-handed
operations because of the limited motion range of the
thumb. Important input options could be placed with
this knowledge so the user can reach them with the
thumb without switching hands or operating the de-
vice with both hands. During the second level of
game 3, the position of the stone changes in each
round. The thumb’s range can be determined if the
device is held at a fixed position. At this level, coor-
dination and hand and finger dexterity are additionally
tested.
3.2 Metrics of Input Data
The game instructions determine the type of input
required to manipulate gameplay depending on the
game and level. Input is generated by the user when
touching the screen or using a mouse. For each in-
put, information is recorded to calculate the required
metrics.
The position of a tap on the screen or a mouse
click is used to infer whether the target was hit. This
way, a hit rate and corresponding standard deviation
per object size are derived. For game levels with sev-
eral potential targets, of which only one may be hit, it
is also determined in which of the defined zones the
hit was located. Two zones are defined: (1) directly
hits the target object, and (2) hits within a certain mar-
gin around the object. Other objects are in the second
zone, which is directly adjacent to the distance and
has the same width as the target object. Since a tar-
get is given, the distance between one tap and another
can be determined, which is necessary to avoid wrong
hits. The hits outside these two zones are treated as
slips. If the target was hit, the accuracy of the hit
is calculated from the target’s center position and the
hit’s distance. In addition, the reaction time is calcu-
lated from the time of the target’s appearance and the
time of the hit. From the time of the hit and the ter-
mination of the input, the duration of the input, the
tap or mouse down duration, is determined. At these
times, the pressure exerted on the screen is also mea-
sured for tap events. If several hits on an object are
necessary, the number of hits per second is calculated
from the required number and the period over which
these were made. The number of errors that occurred
during this period is the number of errors per second.
The measures in game two aimed to examine the
ability to drag objects over a long distance. To drag
an object, the mouse must be moved while the mouse
button is pressed for a longer time until the object’s
destination is reached – this type of input results in a
covered distance defined by individual points on the
screen. Depending on the device, approximately 60
waypoints per second are recorded. Suppose the fre-
quencies are filtered out of this distance by not consid-
ering every waypoint for the distance calculation. In
that case, the tremors of the input can be determined
based on the ratio of the distances of the covered dis-
tance and the smoothed distance. It also results in the
calculation of movement speed by considering the du-
ration and distance of the interactions. Using the start
and end point, it is determined (1) whether the object
has been moved to a destination at all, (2) whether
the object was moved to the expected destination, and
(3) whether the user applied a strategy to complete the
CSEDU 2025 - 17th International Conference on Computer Supported Education
258

Figure 1: Game scenes: Hitting moles in game 1 level 2 (left), Throwing stones in game 3 (middle), and Sorting apples by
color in game 2 level 1 (right).
tasks efficiently (e.g., collect red apples first or collect
the nearest apples). In addition, it is stored whether
one of the built-in obstacles was touched during the
movement.
Analogous to Game 2, Game 3 mandates an
extended navigation of the input device across the
screen. However, in this tier, the emphasis pivots to
the velocity of the swipe gesture. Concurrently, the
user’s handedness is discerned through the curvature
of the swipe trajectory. The orientation of the arcs,
whether they open towards the left or the right, indi-
cates the hand employed by the user during interac-
tion.
4 STUDY
The game presented in the last section allows them
to capture the motor and cognitive skills of the play-
ers. A study was conducted to collect participant data
using the game to determine the distribution of the
surveyed abilities and identify parameters for adapt-
ing user interfaces. For this purpose, 7 hypotheses
have been defined. By testing hypotheses 1 to 7, the
study aimed to show whether the variance in individ-
ual abilities justifies an adaptive user interface design
in terms of ability-based design. In particular, hy-
potheses 2–6 aim to identify metrics and ranges of
values that can be applied to user interface adapta-
tions.
H1: Smaller objects can be hit less accurately
and quickly. The smaller an object is, the more pre-
cisely it must be hit with the respective pointing de-
vice. Therefore, precise coordination requires more
time.
H2: Hand tremor impairs coordination of pro-
longed pushing movements (Pan). Motor restriction
of the hands is manifested, among other things, by
slower interactions with pointing devices. A mani-
festation of this type of limitation is experienced by
trembling of the finger, thumb, or hand. Interactions
that require a longer pushing movement can, there-
fore, only be performed comparatively slowly.
H3: The hit accuracy can be improved in terms
of response time up to a specific object size. It is as-
sumed that a control element is the optimal size for
individual users when the object can be hit accurately
within the shortest possible period. Because of the
limited space, increasing the size of controls and other
objects beyond this, for which there are neither con-
tent nor aesthetic reasons, should be avoided. From
H3, an individual size for buttons and other touchable
objects is given. Consequently, in the design of an
application, these sizes should not be set the same for
all users but should be adjusted according to individ-
ual capabilities.
H4: If the distance between two objects is too
small, individual objects cannot be hit accurately. For
the design of controls, an individual minimum dis-
tance between controls can result from H4.
H5: People with red-green vision impairment can
be identified by the error rate in Game 2 Level 1.
The user interface can be automatically adjusted for
people with color vision loss by adjusting the color
scheme and increasing the contrast.
H6: The handedness of users can be determined
based on movement patterns. Whether a user is left-
or right-handed is a decisive criterion for placing con-
trols (e.g., navigation menus). In smartphone appli-
cations, the position of control elements is usually
designed for right-handers so that these controls are
out of reach of left-handers’ thumbs. Even for people
with shorter thumbs/fingers, these controls can only
be reached by excessive stretching, bending, or reach-
ing around (cf. (Parhi et al., 2006; Perry and Hour-
cade, 2008)).
H7: Participants’ abilities are at different perfor-
mance levels across all identified metrics. It is as-
sumed that a user’s abilities can be assigned to mul-
tiple levels. If H7 is valid, adaptation must be per-
formed for every ability measure.
4.1 Methods
4.1.1 Participants
Regarding ability-based design, individuals partici-
pating in the study were selected regardless of their
Game-Based Ergonomic Adaptation of User Interfaces for Online Learning Environments
259

Table 1: Measures collected in the three games.
Game Measure Description Range
1 Distance of objects Distance between two close-by objects that the user should
not confuse.
[0,N]
1 Size of objects Area of an object to be clicked on. [1,N]
1 Repetition of clicks Number of clicks on an object. [1,N]
1 Decision between objects Time needed to decide between several objects to be
clicked.
[0,N]
1 Hit accuracy Accuracy at which a click hits an object. [0,1]
1 Object processing rate Number of objects (e.g., moles in game 1) per time. [0,N]
2 Points per second Achieved points per second playtime. [0,N]
2 Tremor rate Amount of tremor measured during drag and drop move-
ments.
[0,1]
2 Green-blue objects Total number of green or blue fruits assigned to a basket. [0,N]
2 Green-blue correct objects Number of correctly assigned green or blue fruits to the
corresponding basket.
[0,N]
2 Red-yellow objects Total number of red or yellow fruits assigned to a basket. [0,N]
2 Red-yellow correct objects Number of correctly assigned red or yellow fruits to the
corresponding basket.
[0,N]
2 Hit accuracy Accuracy at which a click hits an object. [0,1]
3 Right hand used Number of times the right hand was used. [0,N]
3 Left hand used Number of times the left hand was used [0,N]
3 Hit accuracy Accuracy at which a click hits an object. [0,1]
3 Object processing rate Number of objects (e.g., moles in game 1) per time. [0,N]
chronological age, gender, or individual frequency of
use of smartphones, tablets, or computers. In partic-
ular, students and adolescents of a school for physi-
cally impaired people have been asked to participate
voluntarily. Forty-three individuals participated in the
study, of whom 23 were male and 20 were female.
The average age was 31.2 years (SD = 21.0). The dis-
tribution by age and sex, as shown in Fig. 2, rep-
resents the distribution of age and sex at the school.
The participants reported information about gender,
age, and known physical or mental impairments. 14
individuals reported having difficulty operating mo-
bile devices during a personal interview.
0
4
8
12
0 10 20 30 40 50 60 70 80
Age
Frequency
Gender
male
female
Figure 2: Age distribution of participants by gender.
4.1.2 Procedure
For the two-week implementation phase of the study,
the application was made available for the platforms
iOS (TestFlight from the App Store), Android (via
PlayStore and .apk file), Windows, Mac OS X, Linux,
and as a web version using WebGL. Using different
end devices with various input and output options thus
enabled realistic study conditions.
The study participants acted independently and
did not perform specific tasks. Instructions and as-
sistance were not provided. The participants installed
the application on their private computer devices and
played through it once. The execution of the game
took about 10-15 minutes and consisted of the three
games described in section 3.1. The participants
could contact the experimenter via email if they had
any questions or problems. A total of 6 participants
did not complete the game. Their data was not in-
cluded in the evaluation, so in the end, data sets from
43 participants could be evaluated.
Five participants used a computer to complete the
test. Inputs on the desktop computer were made
faster and with a lower variance. Consequently, there
was no need to increase the distance between objects.
Twenty-six participants held their mobile device in
their hand throughout the game, 12 changed position
during the games, and only one participant left the
device on a flat table. Only five mobile devices had
a pressure sensor, so no analysis of this data was per-
formed.
CSEDU 2025 - 17th International Conference on Computer Supported Education
260
4.2 Results
The presentation of the results is structured in accor-
dance to the previously established hypotheses.
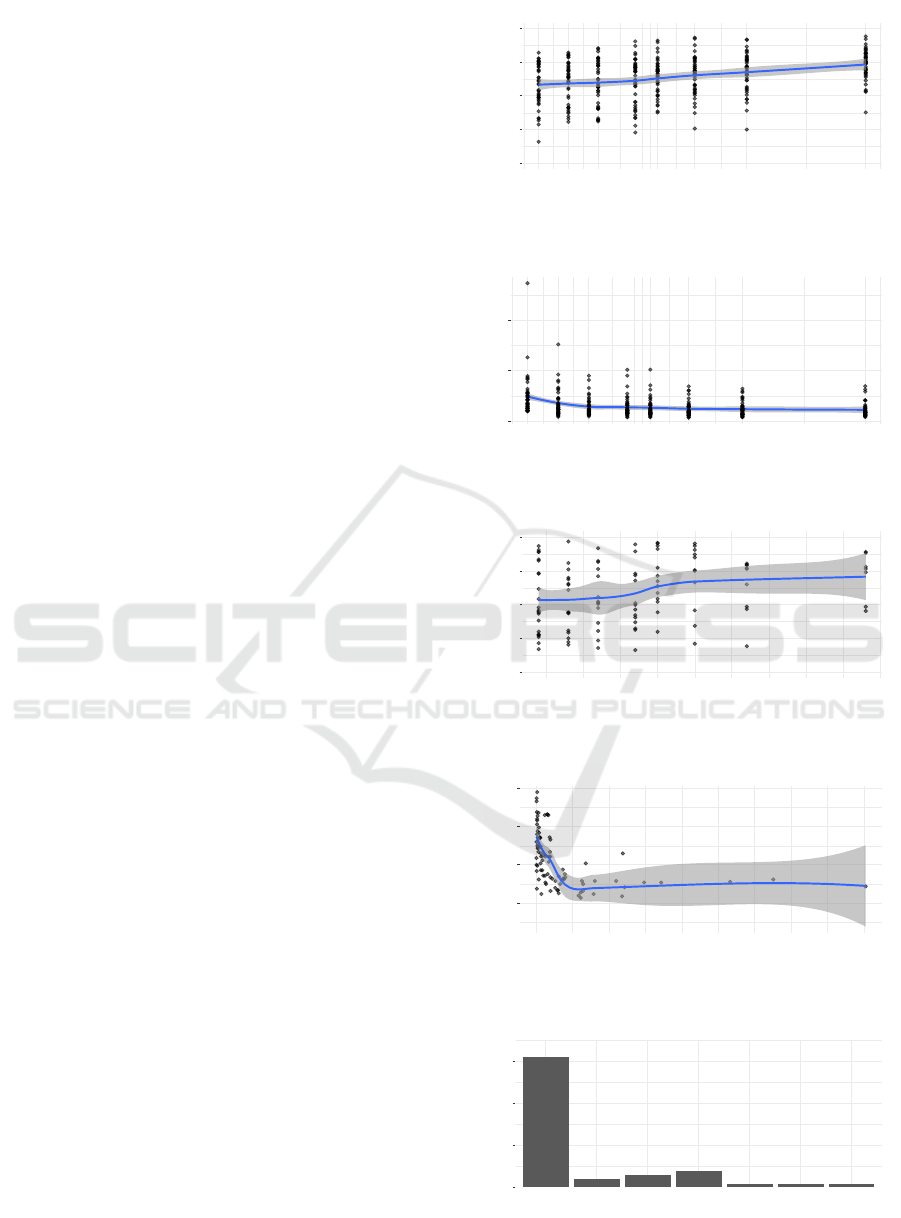
As shown in Fig. 3, the accuracy with which an
object was hit is positively monotonically related to
the size of the objects (r = 0.31, CI 95 % [0.21, 0.40],
p < 1e − 6). The relationship between reaction time
and object size turns out to be smaller and monoton-
ically negative (r = −0.26, CI 95 % [−0.35, −0.15],
p < 1e − 6). Since smaller objects can be hit less ac-
curately and quickly, H1 is confirmed.
The number of apples and plums put down in the
second game was negatively monotonically related
to the Amount of trembling detected while moving
these objects (r = −0.38 CI: 95 %, [−0.55, −0.18],
p < 1e − 3). The more tremulous the hand was while
shifting, the fewer objects could be shifted to the in-
tended position during playtime. This relationship
is shown in Fig. 6. In addition, there was a higher
variance of this value with increasing tremulousness
(r = 0.78 CI: 95 %, [0.68, 0.85], p < 1e − 6). H2 can
thus be considered as confirmed.
However, in Fig. 4, one can see how participants
could hardly improve their reaction time for object
sizes larger than 52 pt. The quotient of mean hit ac-
curacy and reaction time helps determine individual
performance as a function of object size. The more
accurately an object is hit and the less time it takes,
the higher the quotient. For objects between 52 pt,
and 60 pt, the quotient increases the most (Fig. 5).
As depicted in Fig. 7, most participants (31) cope
well with the smallest object size, although for 12 in-
dividuals larger controls should be offered. For these
12 individuals, the quotient could be improved on av-
erage by 74.24 % (SD=14.55) compared to the mini-
mum size of 44 pt. From this, it can be concluded that
the hit accuracy and reaction speed can be individu-
ally determined up to the object sizes considered here
and that H3 is thus fulfilled.
Regarding H4, only a minimal correlation be-
tween the distance between two objects and the hit
rate could be found. H4 is therefore discarded. Thus,
with the help of the applied elicitation method, no re-
quirements for a personalized user interface design
can be found.
Regarding the test of H5, a red-green visual de-
fect was reported by one person without being asked.
This person incorrectly sorted 38.2 % of the red ap-
ples and approximately 10.5 % of the green apples.
In contrast, the other participants correctly assigned
an average of 98.2% (SD=3.9) for the red apples and
97.8% (SD=3.0) for the green apples. After consul-
tation with the participant, it turned out that the lat-
R = 0.31, p = 6.2e−09
0.00
0.25
0.50
0.75
1.00
44 48 52 58 60 65 72 88
Object size (pt)
Average accuracy (%)
Figure 3: Correlation of the accuracy of hits and the size of
controls.
R = −0.26, p = 1.6e−06
0
2
4
44 48 52 58 60 65 72 88
Object size (pt)
Average reaction time (s)
Figure 4: Correlation of the mean response time and the
size of control elements.
R = 0.25, p = 0.0096
0.00
0.25
0.50
0.75
1.00
50 60 70 80 90
Object size (pt)
Accuracy/reaction time
Figure 5: Accuracy per reaction time for different object
sizes.
R = −0.38, p = 0.00031
0
50
100
150
1.00 1.05 1.10 1.15 1.20
Tremor rate
Number of filed objects
Figure 6: Correlation of the mean individual tremor rate and
the number of successfully moved and deposited objects.
31
2
3
4
1 1 1
0
10
20
30
44 48 52 57 60 65 72
Object size (pt)
Frequency
Figure 7: Histogram of optimal object sizes.
Game-Based Ergonomic Adaptation of User Interfaces for Online Learning Environments
261
ter could distinguish the lighter shades better than the
darker ones. For the darker ones, guessing was pre-
dominant. After the colors were changed to blue and
yellow at the next level, the mentioned participant had
no more difficulties sorting the colors. The hypothesis
H5 can be confirmed for this participant but still re-
quires a more comprehensive investigation with more
persons with corresponding color vision deficits.
According to the evaluation of the pan patterns
of the third game, approx. 20 % of the participants
were classified as left-handed. For 30 participants
who used a mobile device and were consulted after-
ward, the handedness of 8 left-handers and 22 right-
handers could be correctly identified. The informa-
tion can be more accurate for mobile devices since the
hands/fingers interact directly with the screen com-
pared to indirect input devices such as a mouse.
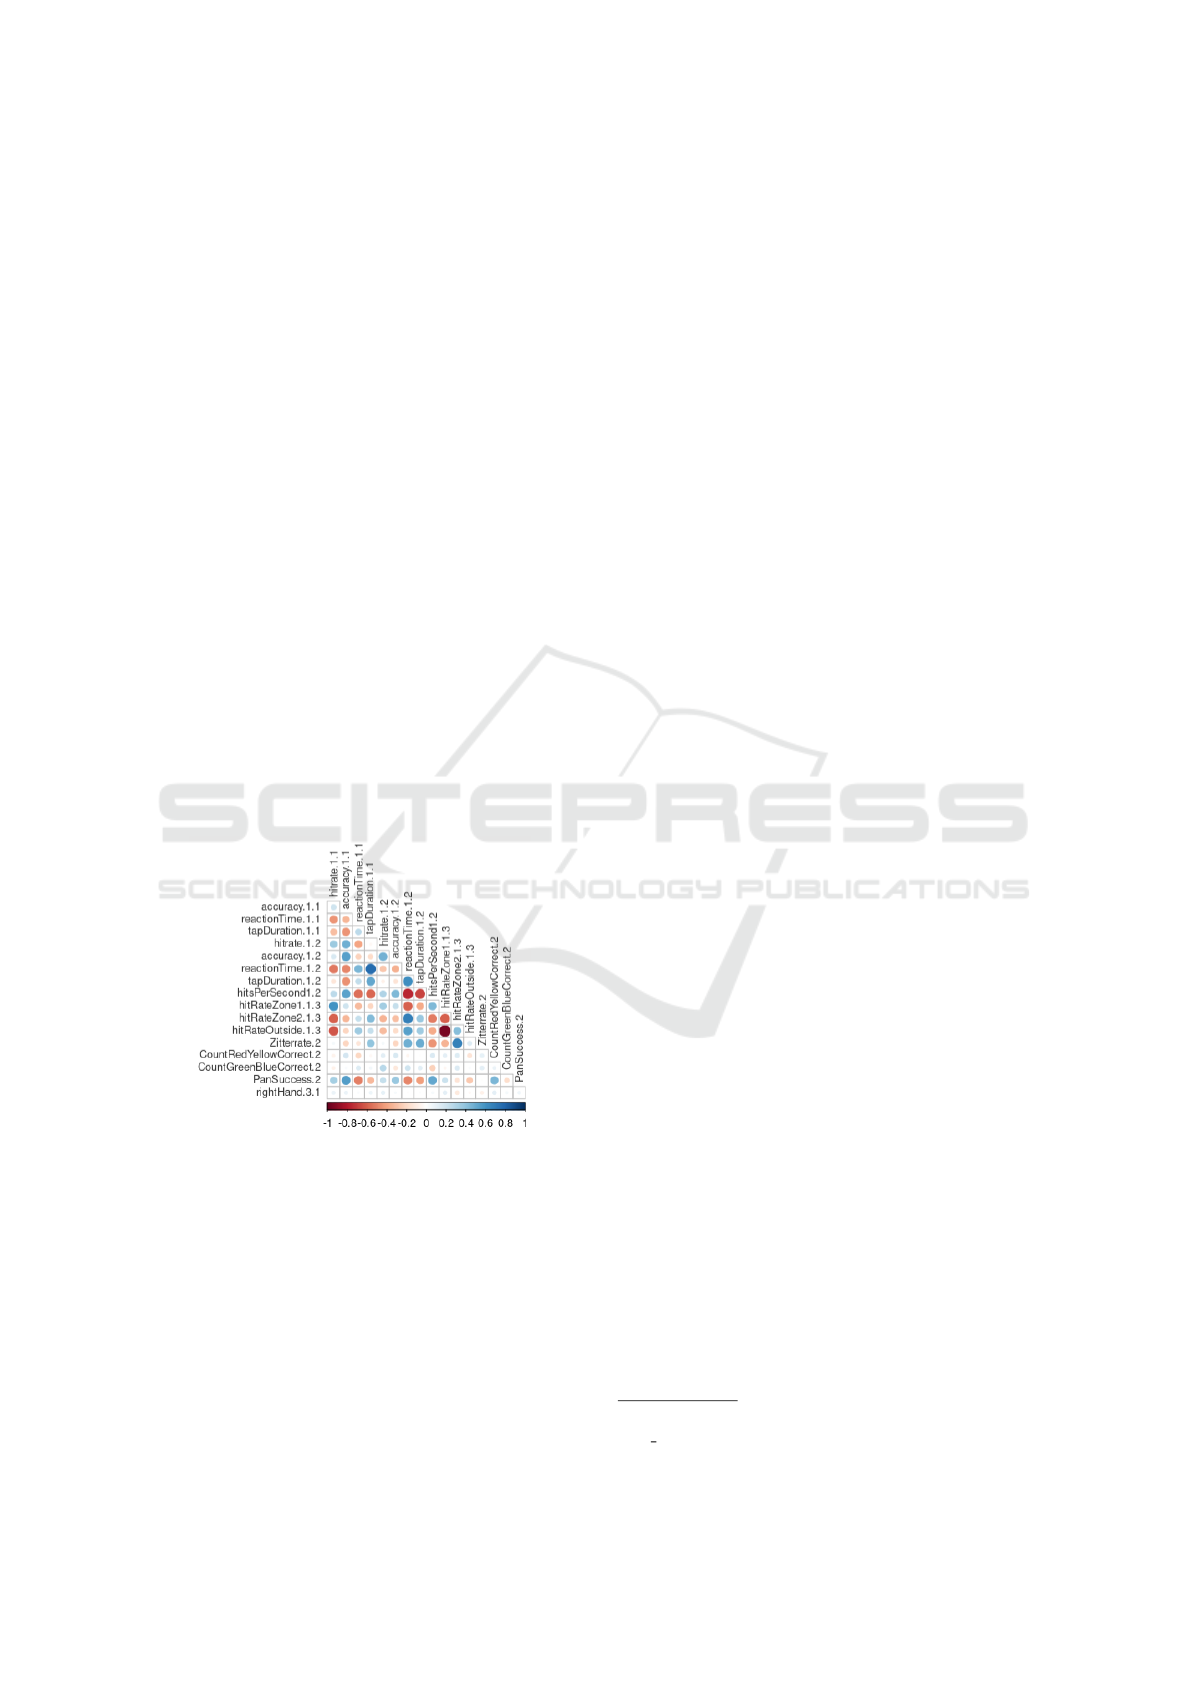
To test H7, the metrics mentioned up to this point
correlated. Fig. 8 shows high positive correlations
for related measures in different game levels. For in-
stance, the hit rate, accuracy, and reaction time corre-
lated between levels 1.1 and 1.2. As expected, color
vision impairment and handedness show a very low or
no correlation with any other measure. A high tremor
affects a higher reaction time and tap duration, while
the hit rate is lower, and the outer areas of an element
are hit more often than the element itself. H7 can be
confirmed.
Figure 8: Correlation matrix of used metrics indication pos-
itive (blue) and negative (red) correlations.
4.3 Discussion
The casual data collection during the games enabled
the creation of meaningful user profiles. The research
design implied the freedom of choosing a hardware
device. This led to a mixture of input data from touch
displays and other unknown input devices, which had
little statistical impact.
The results show a relatively low internal valid-
ity since controlling how the users played the game
was impossible. However, it could be ensured that the
participants could complete the game within a con-
siderable time range. The comparatively small num-
ber of participants and various devices also indicate
a relatively low external validity. This is particularly
evident for testing H5 and H6.
Since participants played the game only once, the
results of the first moves per level are biased by learn-
ing effects. We tried to compensate for this effect by
repeating the moves several times. However, this cor-
responds with a real-world application of the game.
Another limitation of the study is the partial self-
selection of participants. The comparatively high pro-
portion of 20-30 year old is due to the participation of
students, who are an exceptional group in their own
right. The participation of the 14 children and adoles-
cents with demonstrable motor impairments did not
form a representative group of the overall population
of Germany. Nevertheless, the study succeeded in in-
cluding a heterogeneous group of participants based
on their age and ability to use the pointing devices.
5 GAME-BASED USER
INTERFACE ADAPTION IN
MOODLE
The study in sections 4 has shown which motor and
cognitive abilities can be precisely recorded with the
help of a computer game. Taking these results as a
reference, threshold values could be defined for map-
ping adaptive components in a UI. In the next step,
these adaptation sources have been transformed into
concrete adaptation targets so that an application’s de-
sign adapts to its users’ motor and cognitive abilities.
The learning management system Moodle has
been utilized to showcase the functionality of an adap-
tive user interface through a specifically designed plu-
gin. This plugin is committed to supporting both in-
dividual reading and collaborative engagement with
extensive course texts, thereby illustrating the poten-
tial of Moodle to host and enhance such adaptive edu-
cational interventions.
2
. In distance learning at Fern-
Universit
¨
at in Hagen Germany, a nuanced approach
to reading has been employed over two years, lever-
aging a comprehensive suite of tools within Moodle.
This suite encompasses a table of contents, an in-text
search function, text marking facilities, bookmarks,
and the integration of personal annotations and pub-
lic discussions. These features enrich the reading ex-
perience, fostering a more interactive and engaging
2
See https://github.com/CATALPAresearch/
mod longpage/ (accessed 2024/01/23).
CSEDU 2025 - 17th International Conference on Computer Supported Education
262

learning environment. All reading activities in terms
of scrolling text sections into the screen’s visible area
are captured using the intersection observer API of
the web browser.
After entering a page with reading material, the
game was promoted to the users in a modal dialogue.
Referring to the Pomodoro method, after an active
reading time of 25 minutes, we offered students to
take a break and play the game. In addition, the game
could be started on demand from the side menu.
As the main target of the UI adaptations, the size
of the font and control elements have been chosen
(Tab. 2). Tab. 2 shows the metrics and targets with
their respective value ranges. The individual average
measures from the game were stored in the Moodle
database. The client processes the adaptation of the
user interface based on this data. Using Vue.js, in-
cluding the VUEX design pattern, the adaptations be-
come immediately visible to the user. Examples of
resulting UI changes are shown in Fig. 9 and 10. Con-
tinuous adjustments in the target system were neces-
sary to keep the metrics current even after the game
was finished. For this purpose, similar to the game,
the object hit rate, click time, and shakiness were cap-
tured throughout the Moodle system. This data was
calculated using the game data. In this way, intra-
subject differences could be compensated. Short-term
health limitations, for instance, could be considered in
the adaptive design.
Moodle usage involves significantly fewer clicks
per unit of time than the game presented here. This
lower frequency of click interactions is insufficient
for continuously and reliably adjusting metrics, high-
lighting the effectiveness of our approach: utilizing
an alternative application, such as a game, to capture
motor and cognitive abilities.
One of the most challenging aspects was redesign-
ing the text highlighting method. The current solu-
tion, which involves setting the start point of the high-
light with a click and then extending it using keyboard
arrow keys, is only functional on devices equipped
with a keyboard.
The adaptation of the UI presented here consti-
tutes a minor modification within Moodle, specifi-
cally limited to a single plugin. To entirely reshape
the UI of the entire LMS, a significantly greater effort
is required to ensure consistent display across vari-
ous devices. This exploration into UI adaptability
within Moodle presents a foundational step in enhanc-
ing user interaction, particularly in learning environ-
ments where cognitive and motor skills measurement
is crucial.
The adaptive UI was tested in a think-aloud test
with five volunteer students: two younger persons
without known impairments and three older students
who generally reported mild cognitive impairment
when accessing Moodle web content, mainly because
of visual impairment and/or tremors. All participants
liked to play the game and were able to complete
it. While two younger participants did not perceive
any differences in the (unchanged) Moodle UI, the re-
maining participants appreciated the increased size of
icons and fonts in the adapted version.
6 CONCLUSION AND OUTLOOK
In this paper, we have shown a way to measure the
motor and cognitive skills of users using a computer
game and to be used to adapt the user interface of ar-
bitrary applications. The suitability of measures of hit
rate, reaction time, hits per second, tremor, movement
speed, color vision ability, and handedness was eval-
uated in a study with 43 participants. The analysis
of the recorded data and the testing of the hypothe-
ses made clear that each user is an individual and,
therefore, personal abilities should be considered in
the design. In a case study, the ability-based design
approach was implemented for the adaptive design of
a Moodle plugin.
A game-based adaptation has several advantages
and disadvantages. For example, skills can be deter-
mined in a time-saving and more precise way com-
pared to sometimes one-time or infrequent user inter-
actions with controls that may be too small. Repe-
titions cannot level outliers in measurements in ap-
plications like Moodle if the natural user interactions
do not allow repetitions to occur. Handedness and
color vision usually cannot be captured through or-
dinary user interactions but only through artifactual
interventions such as CAPTCHA
3
tests. Continuous
data collection can also affect the application’s per-
formance. Realizing the principle of data sparsity is
an open question of which capabilities require contin-
uous or at least regular adjustment.
Nevertheless, a collection of properties through a
game represents a media break to the target applica-
tion to which the user interface is to be adapted. It
may not seem appropriate to integrate a game in ev-
ery type of application. Since the capabilities are not
measured in the target application, the measured val-
ues must be converted from the game to the target ap-
plication’s UI. For this conversion, the game’s values
can serve as a baseline, but they do not replace a cal-
ibration. To better account for intra-subjective fluc-
3
Abbreviation for Completely Automated Public Turing
Game-Based Ergonomic Adaptation of User Interfaces for Online Learning Environments
263

Table 2: List of UI elements that have been adapted based on initial measures from the game.
Element Adaptation Range Measure
Control elements The size of control elements and the
font size of the text change adaptively.
{44, 48,52, 58,
60, 65,72, 88} (pt)
Game 1: size of ob-
jects, hit accuracy
Object distance For better differentiation of controls
like buttons and links, their margin is
adapted.
{2, 4,6, 8, 10} (px) Game 1: distance of
objects, hit accuracy
Color combinations To address color blindness, the style
sheet of Moodle has been adjusted.
Furthermore, CSS image effects are
used to convert colour-mismatching
images.
{de f ault, red-green,
blue-yellow}
Game 2: red-yellow
correct objects, green-
blue correct objects
Menu For left-handed people, the main menu
is moved from the right to the left side
of the screen.
{le f t, right} Game 3: left hand
used, right hand used
Text marking With shaky mouse movements, text
passages are marked not by point and
expansion but by the keyboard.
– Game 2: Tremor
Figure 9: Baseline without UI adaption.
tuations in adaptation, a continuous, albeit less pre-
cise, measurement of cognitive and motor skills is
needed in addition to the game. However, longer-
lasting investigations in the field are required to in-
vestigate these fluctuations and their influence on an
application’s usability.
Therefore, the adaptive system presented in sec-
tion 5 will be used in teaching in the coming months.
Students should be able to use the game as often as
they want while their input operation is continuously
recorded. In this way, we would like to determine
the effect size in a single-case research design using
nonoverlap techniques (Parker et al., 2011). From a
technical perspective, we see adaptive ability-based
design as a component of our adaptive learning envi-
ronment based on Moodle.
ACKNOWLEDGEMENTS
Many thanks to Ann-Kathrin Sch
¨
ading for design and
data collection. This research was supported by the
Center for Center of Advanced Technology for As-
sisted Learning and Predictive Analytics (CATALPA)
of the FernUniversit
¨
at in Hagen, Germany.
tests to tell Computers and Humans Apart.
Figure 10: Adapted UI with larger font size, bigger icons,
and increased margin between the icons.
REFERENCES
Bihler, P., M
¨
ugge, H., Schmatz, M., and Cremers, A. B.
(2009). Using semantic descriptions for adaptive mo-
bile games UIs.
Bj
¨
ork, S., Lundgren, S., Grauers, H., and G
¨
oteborg, S.
(2003). Game Design Patterns. In in Level Up: Dig-
ital Games Research Conference 2003, pages 4–6,
Utrecht. Faculty of Arts, Utrecht University.
Bouzit, S., Calvary, G., Ch
ˆ
ene, D., and Vanderdonckt, J.
(2016). A Design Space for Engineering Graphical
Adaptive Menus. In Proceedings of the 8th ACM
SIGCHI Symposium on Engineering Interactive Com-
puting Systems, EICS ’16, pages 239–244, New York,
NY, USA. ACM.
Caldwell, B., Cooper, M., Reid, L. G., Vanderheiden, G.,
Chisholm, W., Slatin, J., and White, J. (2008). Web
Content Accessibility Guidelines (WCAG) 2.0. Tech-
nical report, W3C.
Castilla, D., Suso-Ribera, C., Zaragoza, I., Garcia-Palacios,
A., and Botella, C. (2020). Designing icts for users
with mild cognitive impairment: A usability study.
International Journal of Environmental Research and
Public Health, 17(14).
De Clercq, M., Galand, B., and Frenay, M. (2020). One
goal, different pathways: Capturing diversity in pro-
cesses leading to first-year students’ achievement.
Learning and Individual Differences, 81:101908.
CSEDU 2025 - 17th International Conference on Computer Supported Education
264

de Santana, V. F. and Silva, F. E. F. (2019). An Easy to Use
Data Logger for Local User Studies. In Proceedings of
the 16th International Web for All Conference, W4A
’19, New York, NY, USA. Association for Computing
Machinery.
Fullerton, T. (2008). Game design workshop: a playcentric
approach to creating innovative games. CRC press.
Gajos, K. Z. and Chauncey, K. (2017). The influence of per-
sonality traits and cognitive load on the use of adaptive
user interfaces. In Proceedings of the 22Nd Interna-
tional Conference on Intelligent User Interfaces, IUI
’17, pages 301–306, New York, NY, USA. ACM.
Gajos, K. Z., Weld, D. S., and Wobbrock, J. O. (2010).
Automatically generating personalized user interfaces
with Supple. Artificial Intelligence.
Galindo, J. A., Dupuy-Chessa, S., and C
´
eret, E. (2018). To-
ward a generic architecture for ui adaptation to emo-
tions. In Proceedings of the 29th Conference on
L’Interaction Homme-Machine, IHM ’17, pages 263–
272, New York, NY, USA. ACM.
Henze, N., Rukzio, E., and Boll, S. (2011). 100,000,000
taps: analysis and improvement of touch performance
in the large. In Proceedings of the 13th Interna-
tional Conference on Human Computer Interaction
with Mobile Devices and Services, MobileHCI ’11,
page 133–142, New York, NY, USA. Association for
Computing Machinery.
Inkpen, K., Dearman, D., Argue, R., Comeau, M., Fu, C.-
L., Kolli, S., Moses, J., Pilon, N., and Wallace, J.
(2006). Left-handed scrolling for pen-based devices.
International Journal of Human–Computer Interac-
tion, 21(1):91–108.
Kane, S. K., Wobbrock, J. O., Harniss, M., and Johnson,
K. L. (2008). TrueKeys: Identifying and Correcting
Typing Errors for People with Motor Impairments. In
Proceedings of the 13th International Conference on
Intelligent User Interfaces, IUI ’08, pages 349–352,
New York, NY, USA. ACM.
Kurschl, W., Augstein, M., and Stitz, H. (2012). Adap-
tive User Interfaces on Tablets to Support People with
Disabilities. In Mensch & Computer 2012 – Work-
shopband - 12. fach
¨
ubergreifende Konferenz f
¨
ur inter-
aktive und kooperative Medien.
Lee, H. and Choi, Y. S. (2011). Fit your hand: Personal-
ized user interface considering physical attributes of
mobile device users. In Proceedings of the 24th An-
nual ACM Symposium Adjunct on User Interface Soft-
ware and Technology, UIST ’11 Adjunct, pages 59–
60, New York, NY, USA. ACM.
Martin, F., Chen, Y., Moore, R. L., and Westine, C. D.
(2020). Systematic review of adaptive learning re-
search designs, context, strategies, and technologies
from 2009 to 2018. Educational Technology Research
and Development, 68(4):1903–1929.
Moon, J., Kum, S., and Lee, S. (2017). Introduction to
the design of personalized user interface platform with
recommended contents. In Proceedings of the 3rd In-
ternational Conference on Communication and Infor-
mation Processing, ICCIP ’17, pages 104–107, New
York, NY, USA. ACM.
Moured, O., Baumgarten-Egemole, M., M
¨
uller, K., Roit-
berg, A., Schwarz, T., and Stiefelhagen, R. (2024).
Chart4blind: An intelligent interface for chart accessi-
bility conversion. In Proceedings of the 29th Interna-
tional Conference on Intelligent User Interfaces, IUI
’24, page 504–514, New York, NY, USA. Association
for Computing Machinery.
Naughton, J. E. (2017). Nothing About Us Without Us.
Technical report, EDF European Disability Forum.
Parhi, P., Karlson, A. K., and Bederson, B. B. (2006). Target
size study for one-handed thumb use on small touch-
screen devices.
Parker, R. I., Vannest, K. J., and Davis, J. L. (2011). Effect
size in single-case research: a review of nine nonover-
lap techniques. Behavior modification, 35(4):303–
322.
Paymans, T. F., Lindenberg, J., and Neerincx, M. (2004).
Usability trade-offs for adaptive user interfaces: Ease
of use and learnability. In Proceedings of the 9th In-
ternational Conference on Intelligent User Interfaces,
IUI ’04, pages 301–303, New York, NY, USA. ACM.
Perry, K. B. and Hourcade, J. P. (2008). Evaluating one
handed thumb tapping on mobile touchscreen devices.
In Proceedings of Graphics Interface 2008.
Riddell, S. and Weedon, E. (2014). Disabled students in
higher education: Discourses of disability and the ne-
gotiation of identity. International Journal of Educa-
tional Research, 63:38–46. Special Issues: Represent-
ing Diversity in Education: Student identities in con-
texts of learning and instruction & Classroom-Based
Talk.
Schmidtmann, H. and Preusse, J. (2015). Soziode-
mografie, studienmotive und studienerfolg beruflich
qualifizierter studierender: Befunde an der fern-
universit
¨
at in hagen. Beruflich Qualifizierte im
Studium, 101.
Silfverberg, M., MacKenzie, I. S., and Korhonen, P. (2000).
Predicting Text Entry Speed on Mobile Phones. In
Proceedings of the SIGCHI Conference on Human
Factors in Computing Systems, CHI ’00, pages 9–16,
New York, NY, USA. ACM.
The National Eye Institute (NEI) (2015). Facts About Color
Blindness.
W3C (2011). Accessible Rich Internet Applications (WAI-
ARIA) 1.0 W3C Candidate Recommendation 18 Jan-
uary 2011.
Wang, W., Khalajzadeh, H., Grundy, J., Madugalla, A., and
Obie, H. O. (2024). Adaptive user interfaces for soft-
ware supporting chronic disease. In Proceedings of
the 46th International Conference on Software En-
gineering: Software Engineering in Society, ICSE-
SEIS’24, page 118–129, New York, NY, USA. Asso-
ciation for Computing Machinery.
Wobbrock, J. O., Gajos, K. Z., Kane, S. K., and Vanderhei-
den, G. C. (2018). Ability-based design. Commun.
ACM, 61(6):62–71.
Wobbrock, J. O., Kane, S. K., Gajos, K. Z., Harada, S.,
and Froehlich, J. (2011). Ability-Based Design. ACM
Transactions on Accessible Computing.
Game-Based Ergonomic Adaptation of User Interfaces for Online Learning Environments
265
