
Dynamic Reading Comprehension Visualization in Digital Course Texts
Dennis Menze
a
, Niels Seidel
b
and Slavisa Radovic
c
CATALPA – Center of Advanced Technology for Assisted Learning and Predictive Analytics,
Fernuniversit
¨
at Hagen, Universit
¨
atsstr. 27, 58097 Hagen, Germany
{dennis.menze, niels.seidel, slavisa.radovic}@fernuni-hagen.de
Keywords:
Reading Comprehension, Reading Analytics, Learning Analytics.
Abstract:
Both reading textbooks and answering quizzes lead to better recall of learning content and better learning
outcomes, especially when both forms are combined interactively. Nevertheless, existing solutions in learn-
ing management systems usually offer reading and quizzes separately. This work aims to improve this by
measuring and visualizing students’ reading progress and reading comprehension based on their answers to
automatically displayed questions about the text sections they have just read. In this paper, we present an
adaptive system for supporting reading comprehension. A randomized trial with 57 students showed high
engagement with both the reading material and embedded questions, demonstrating the technical feasibility of
integrating comprehension support into digital course texts. Finally, possible extensions to improve adaptivity,
interventions, automation, and measurement of reading comprehension are discussed.
1 INTRODUCTION
Textbook reading has been shown to be an impor-
tant factor in student test scores, both print and elec-
tronic (Daniel and Woody, 2013). While Landrum
et al. (2012) confirmed that quiz score and final grade
are significantly positively correlated with the self-
reported percentage of completed reading of text-
books, Yang et al. (2021) suggested that repeated
testing could improve reading skills, reading engage-
ment, and reading comprehension (RC), leading to an
enhanced recall of learning content and key concepts.
Studies from educational science have shown that ad-
junct questions are a form of active learning that in-
creases attention to essential parts of the text, and ac-
tive processing of the topic leads to better learning
outcomes (Syed et al., 2020). RC is a complex pro-
cess with as many interpretations as there are of read-
ing because it is often viewed as its essence, essen-
tial for academic and lifelong learning, getting sci-
entific attention as a cognitive process despite this
fundamental importance only since the 1970s. Fur-
thermore, comprehension monitoring is an important
strategy to improve text understanding and is unlikely
to develop spontaneously (Panel, 2000).
So, both reading textbooks and answering quizzes
a
https://orcid.org/0000-0003-0002-868X
b
https://orcid.org/0000-0003-1209-5038
c
https://orcid.org/0000-0001-8840-6053
lead to better recall of learning content and bet-
ter learning outcomes, especially when both forms
are combined interactively (e.g., Peverly and Wood
(2001); Callender and McDaniel (2007); Panel
(2000); Yang et al. (2021)). Nevertheless, exist-
ing solutions in learning management systems, e.g.,
Moodle, usually offer reading and quizzes separately.
Moreover, previous research has focused on enriching
digital texts or visualizing concept maps or summary
learner metrics in dashboards but rarely on real-time
visualization of personal RC in the text itself.
In their study, Christhilf et al. (2022) implemented
per-paragraph reading strategy detection using man-
ual scoring of Constructed Response Protocols (self-
explanations of the text just read) approximately ev-
ery 35 words. Although RC is measured at this level
of detail, the study’s goal was to potentially provide
general feedback on ineffective strategy patterns, not
to visualize per-paragraph RC. For real-time analysis,
they suggested combining their approach with an au-
tomated system.
This work aims to address this gap by investigat-
ing how to measure individual students’ RC in learn-
ing management systems and how it can be visualized
adaptively to the learning progress and the individual
comprehension level. Thus, this study examines and
answers the following research question:
RQ1: How can digital learning management sys-
tems effectively integrate and visualize RC?
266
Menze, D., Seidel, N. and Radovic, S.
Dynamic Reading Comprehension Visualization in Digital Course Texts.
DOI: 10.5220/0013216100003932
Paper published under CC license (CC BY-NC-ND 4.0)
In Proceedings of the 17th International Conference on Computer Supported Education (CSEDU 2025) - Volume 1, pages 266-273
ISBN: 978-989-758-746-7; ISSN: 2184-5026
Proceedings Copyright © 2025 by SCITEPRESS – Science and Technology Publications, Lda.

To answer this question, we developed and com-
pared several design variants for displaying RC based
on findings from the literature review. The most
promising variant was then implemented in a proto-
type and evaluated in an experiment to answer the
second research question:
RQ2: Does displaying measured RC lead to more
learning activity (reading duration, question attempts)
or even better learning as measured by multiple-
choice questions?
2 RELATED WORK
Reading comprehension research has evolved from
early skill-based approaches to more nuanced under-
standings of how readers interact with texts. This sec-
tion synthesizes key findings that inform our design
choices, focusing on measurement approaches, exist-
ing solutions, and visualization techniques.
2.1 Understanding and Measuring
Reading Comprehension
Early work by Davis (1944) identified nine hierarchi-
cal mental skills essential for RC, ranging from basic
word recognition to inferring author intent. While this
skills-based perspective has been questioned, subse-
quent research has confirmed that RC involves mul-
tiple interacting abilities (Panel, 2000). The simple
model proposed by Gough and Tunmer (1986) char-
acterizes RC as the product of decoding and listen-
ing comprehension, combining bottom-up word iden-
tification with top-down semantic processing (Cutting
and Scarborough, 2006).
Modern approaches emphasize reading as an ac-
tive, constructive process requiring prior knowledge
and engagement with the text (Panel, 2000). Perfetti
et al. (2005) highlighted that deeper comprehension
involves building a mental model of the text’s mes-
sage through processes at word, sentence, and text
levels. Effective comprehension instruction methods
include comprehension monitoring and awareness,
visualization of relationships between ideas, question
answering with feedback, and reader-generated ques-
tions and summaries.
For measuring RC, traditional methods primar-
ily use multiple-choice questions that test different
levels of understanding, as defined by Alonzo et al.
(2009): literal comprehension focusing on surface-
level understanding, inferential comprehension re-
quiring conclusions about author intent, and evalua-
tive comprehension connecting text to prior knowl-
edge. Fletcher (2006) emphasized that readability
significantly influences both the inferences readers
can make and researchers’ comprehension assess-
ment. Recent research has expanded measurement
approaches to include analysis of gaze tracking data
(Caruso et al., 2022), linguistic features and readabil-
ity metrics (Crossley et al., 2017), and scrolling be-
haviour analysis (Gooding et al., 2021).
2.2 Digital Reading Support Systems
While existing learning management systems like
Moodle typically separate reading and quiz activities,
multiple studies have shown that combining reading
and quizzes leads to better learning outcomes (Pev-
erly and Wood, 2001; Callender and McDaniel, 2007;
Yang et al., 2021). Several approaches have emerged
to enhance digital reading experiences. Sun et al.
(2004) focused on visualizing book structure and nar-
rative threads, while Guerra et al. (2013) explored
social comparison of reading progress. Milliner and
Cote (2015) studied student engagement in a special-
ized, extensive reading system, finding high satisfac-
tion despite lower than expected reading completion.
Boticki et al. (2019) identified reading styles from
learning log data, distinguishing between receptive
reading (sequential and steady) and response reading
(active engagement with varying pace).
More recent approaches have explored automated
analysis methods. Bravo-Marquez et al. (2011)
used machine learning to classify text comprehen-
sion based on student-generated documents, while
Christhilf et al. (2022) implemented paragraph-level
reading strategy detection. Work by Thaker et al.
(2020) developed methods for automated identifi-
cation of personalized content based on knowledge
gaps, and both Kim et al. (2020) and Wang and
Walker (2021) investigated concept mapping with ex-
pert comparison.
Particularly relevant to our work, Syed et al.
(2020) studied how adjunct questions displayed dur-
ing reading affect learning outcomes, combining gaze
tracking with questions during reading. While they
also placed questions in a side panel to avoid disrupt-
ing the reading flow, they used short free-response
questions that required manual grading. Sun et al.
(2018) demonstrated that online reading duration
strongly indicates reading motivation, which is cru-
cial for enhancing intensive reading behaviors. Their
study showed that groups with high reading duration
also had higher motivation and more phases of inten-
sive reading. However, these approaches require spe-
cialized equipment like eye trackers or manual grad-
ing effort or focus on broader aspects like reading
progress and engagement patterns rather than provid-
Dynamic Reading Comprehension Visualization in Digital Course Texts
267
ing immediate, automated section-level feedback on
comprehension.
Our work addresses this gap by developing and
testing a system that directly integrates questions
with reading material, provides real-time comprehen-
sion visualization, and adapts to individual reading
progress. This synthesis of prior work directly in-
forms our design choices: We adopt multiple-choice
questions as a proven, scalable assessment method,
place questions in a side panel to maintain reading
flow, provide immediate section-specific comprehen-
sion feedback, and support individual progress mon-
itoring. These design decisions combine the most
effective elements from previous research while ad-
dressing the identified gap in immediate comprehen-
sion feedback.
3 DESIGN AND REALIZATION
Referring to RQ1, we aim to design and realize a pro-
totype of an adaptive system for supporting RC. In de-
signing our system, we drew on several key findings
from prior research to address three key questions:
(1) How can questions be displayed without disrupt-
ing the reading flow? (2) How can reading compre-
hension be measured and visualized in real-time? (3)
How can the system adapt to different reading inten-
tions and comprehension levels?
Studies have shown that comprehension monitor-
ing is most effective when it occurs during reading
rather than afterwards (Panel, 2000). Following this
insight and research by Syed et al. (2020) showing
that interrupting the reading flow can be detrimental
to comprehension, we implemented a system where
questions are displayed adaptively based on reading
progress in a side panel rather than embedding them
directly in the text.
While Moodle’s quiz activity already provides
functionality for displaying questions and answers,
the key design decision was how to integrate these
seamlessly with the reading experience. We consid-
ered three possible approaches for embedding ques-
tions: directly in the text under each section, in a
side panel, or as an overlay similar to chatbots. We
chose the side panel approach, following Syed et al.
(2020), as direct embedding would interrupt the read-
ing flow—which is detrimental to RC (Foroughi et al.,
2015)—and an overlay might be perceived negatively
by students due to its association with marketing
tools. The side panel solution maintains a clean read-
ing experience while keeping questions readily acces-
sible.
Regarding the timing of the question display, we
considered different reading intentions identified by
Peckham and McCalla (2012): thorough reading for
comprehension, quick skimming for an overview, or
targeted searching for specific information. While
ideally, questions would only be shown during thor-
ough reading, distinguishing between these intentions
proved unnecessary in practice. When skimming,
questions fade too quickly and are distracting, and
students can actively control their engagement by
opening or closing the side panel.
RC is calculated as the ratio of correct answers to
questions after a section or to all questions on the cur-
rent page, a metric validated in multiple studies (Cal-
lender and McDaniel, 2007; Foroughi et al., 2015;
Panel, 2000). Real-time visualization through color-
coded progress bars was implemented following evi-
dence that immediate feedback supports comprehen-
sion monitoring (Panel, 2000). The distinction be-
tween comprehension levels is left to the teacher as
a recommendation when creating and assigning ques-
tions. Ideally, when the instructor fills a text with
many questions for each section, it results in a kind of
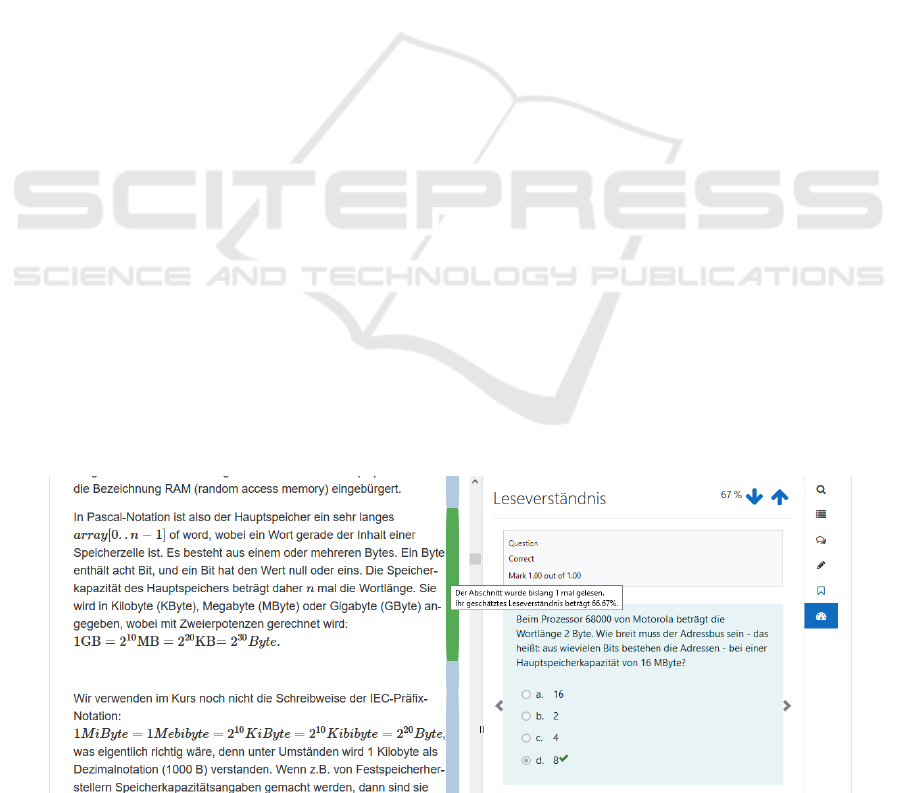
Figure 1: Screenshot of prototype: text (left), reading progress bar (middle), questions (right)
CSEDU 2025 - 17th International Conference on Computer Supported Education
268

text coverage for the students to monitor their learning
progress.
This was approached and implemented in a Moo-
dle environment for a study that collected data about
reading behavior and RC. The prototype extends an
existing Moodle plugin called Longpage (Seidel et al.,
2024), which provides functionalities that simplify
reading on screen or provide advantages that are not
available when reading printed works or PDF files:
students can annotate texts, mark and comment sec-
tions, and share this information with others.
The integration of a RC estimation into Longpage
breaks down into three main parts: an option for the
teacher to create and edit questions and assign them
to parts of the text, the display of the embedded ques-
tions for the student with the option to answer them,
and the display of the estimated RC for each text sec-
tion. Figure 1 shows a screenshot of the implemented
prototype.
Moodle already provides the functionality to cre-
ate, preview, and edit questions and their answer op-
tions with the so-called question bank.
1
For the as-
signment of these questions to text sections, a collec-
tion of third-party plugins was installed: Embed ques-
tion atto button
2
makes it possible to assign questions
to sections. After putting the cursor at a specific posi-
tion in the text, the teacher can select a question from
the question bank. Then, a cryptic code will be in-
serted inside the text to identify the question. Embed
question filter
3
is a Moodle text filter plugin that con-
verts this cryptic code into HTML for rendering the
question inside of Longpage like in a quiz. Multi-
ple questions must be added sequentially without line
breaks so that the script can correctly associate sec-
tions and questions. The questions are hidden by de-
fault.
Using the Intersection Observer API
4
available in
a modern web browser, a custom script clones the
HTML code of a hidden question when the student
scrolls over it, pastes it to the side panel, and sets it
to visible. When the original hidden question inside
the text is scrolled outside the view, the cloned ques-
tion in the side panel will be removed. This way, for
the student, the question appears in the side panel as
long as the corresponding text section is visible. If
there are multiple questions per section, they can be
1
https://docs.moodle.org/311/en/question bank
(accessed 2025/01/10).
2
https://moodle.org/plugins/atto embedquestion
(accessed 2025/01/10).
3
https://moodle.org/plugins/filter embedquestion
(accessed 2025/01/10).
4
https://www.w3.org/TR/intersection-observer
(accessed 2025/01/10).
clicked through in a carousel by clicking on the left
and right arrows. Thus, students can answer as many
questions as they like until the contingent on ques-
tions is exhausted. With two arrows, up and down, it
is possible to jump to the next section with questions
available.
The reading progress indicator available in Long-
page is shown immediately on the right side of the
text as a bar. Its width signifies how often fellow stu-
dents have read certain text sections. The prototype
displays RC by coloring this existing reading progress
bar according to the estimated comprehension level.
Hovering the mouse cursor over the bar displays the
estimated value.
When the student submits an answer, an AJAX
call is triggered so that the PHP function on the server
is executed to calculate the comprehension values for
the whole page. This is necessary because a question
can be referenced several times on the same page, so
a new answer could potentially change the estimated
RC in multiple sections. This function iterates over all
questions on the page, fetches the student’s last five
attempts no older than three months for each ques-
tion (to implement a moving average and knowledge
decay), and calculates the average scores. Finally,
all scores are returned to the client, which changes
the color and tooltip text of all reading progress bars
accordingly. An overall RC estimate for the page is
added to the sidebar.
4 EVALUATION
The prototype resulting from answering RQ1 in the
previous section was put to the test in an experiment
described in this section to answer RQ2, i.e., whether
displaying measured RC does lead to more learning
activity or even better learning.
4.1 Methods
4.1.1 Participants
To determine the number of participants needed to
evaluate the prototype, a statistical power analysis
was performed with a significance level of α=0.05,
a power of 1-β=0.80. This resulted in a requirement
of n=128 participants to measure medium effects (Co-
hen’s d=0.50) and n=51 participants for large effects
(Cohen’s d=0.80). Subjects were recruited through
the FernUniversit
¨
at Hagen survey pool, a mailing list
to which students can subscribe if they wish to partic-
ipate in university studies. An overview of the exper-
iment with an estimated duration of 30 minutes was
Dynamic Reading Comprehension Visualization in Digital Course Texts
269
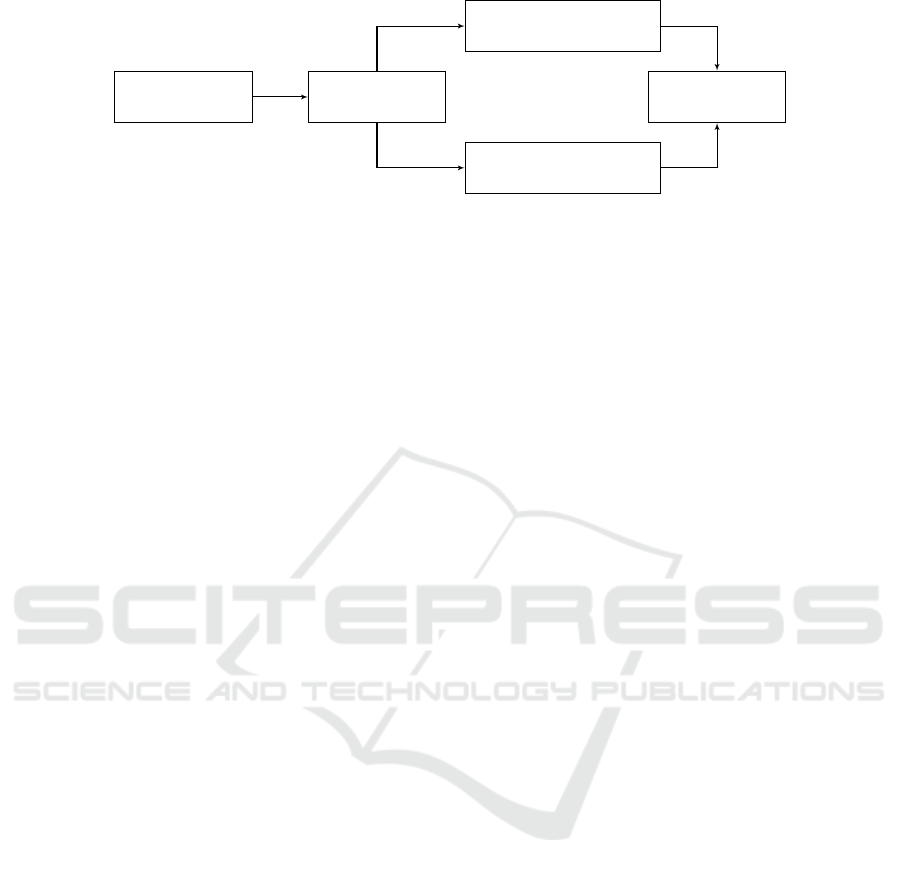
Questionnaire
Pretest
Experimental group (n=28):
Read text with RC display
Control group (n=29):
Read text without RC display
Posttest
Figure 2: Flowchart of participants’ progress through the phases of the trial in a horizontal layout with centered elements.
provided in the recruitment email and on the study
homepage. Participation was open for one week in
October 2022. Participants were informed about pri-
vacy, content, objectives, data collected, their rights
as subjects, and the study duration and provided writ-
ten consent to participate per the EU General Data
Protection Regulation, the research ethics guidelines
of the American Psychological Association and the
German Psychological Association. The 57 partici-
pants were between 19 and 65 years old (M=46.79,
SD=12.99). 40 were female, 17 were male, and 0
was diverse. The highest level of education was fairly
evenly distributed and ranged from a completed ap-
prenticeship to a high school diploma to a university
degree.
4.1.2 Procedure
In this study, a randomized controlled trial with a
between-subjects design was conducted. Block ran-
domization (Suresh, 2011) with a block size of two
was used to ensure equal sample sizes in the experi-
mental and control groups (see Figure 2). A course
was set up in a Moodle learning environment for the
experiment.
First, a short demographic questionnaire had to be
completed, asking for age, gender, and highest level
of education. Then, 8 multiple-choice questions were
posed in a pretest to determine prior knowledge on
the topic of learning analytics. Participants were then
asked to read a text about ethical issues and dilem-
mas in learning analytics, an excerpt from Slade and
Prinsloo (2013), translated into German (Flesch read-
ing ease: 61.0, medium readability). The specific
topic of the text was chosen because, on the one hand,
students themselves are affected by learning analytics
and can, therefore, benefit from the reflection during
the study. On the other hand, it was assumed that eth-
ical texts would be more accessible across subjects.
The text had an estimated reading time of 12–17 min-
utes and was presented using the Longpage plugin,
with most of the secondary features (comments, an-
notations, etc.) disabled.
The functions described in Section 3 for measur-
ing RC were activated. However, only the experi-
mental group had RC visualization enabled. On the
other hand, the control group did not even see read-
ing progress bars next to the text but were still shown
the multiple-choice questions per section as the ex-
perimental group and could answer them in the same
way. Both were given questions because, as men-
tioned, studies have already shown that additional
questions lead to higher RC. So, this should not be
studied again; it should be assumed. The 20 questions
were the 8 questions from the pretest plus 12 more. In
the posttest, the same 20 questions are asked again.
4.1.3 Data Collection and Pre-Processing
User interactions within the Moodle environment
were captured in the database, including quiz and
reading activities. The latter were real usage data
on users’ reading behavior from the Intersection Ob-
server (see Section 3), which fires log events as soon
as a text section becomes visible within the viewport
of the users’ display. Text sections had a unique iden-
tifier and contained individual paragraphs and head-
lines. The dataset consisted of about 440.000 log
entries from reading and question attempts. Partici-
pants who spent less than 10 minutes, and thus about
three standard deviations below the minimum esti-
mated reading time of 14 minutes (and more than
three standard deviations below the mean estimated
reading time of 15.5 minutes) on the text page were
excluded from the study, as it was assumed that a sub-
stantive engagement with the text, questions, and RC
estimation was not possible in this short time. In the
actual experiment, there were n=57 participants, 28 in
the experimental group and 29 in the control group.
To analyze potential differences between the
groups, the following confounding variables were
controlled by the questionnaire: age, gender, and
highest level of education; by the pretest: prior knowl-
edge of ethical topics in learning analytics; and by the
data analysis: time of day and day of week, maximum
time spent per participant on the text page, maximum
text section reached, number of scroll events (see Fig-
CSEDU 2025 - 17th International Conference on Computer Supported Education
270

Table 1: Reading and question statistics per participant.
Experimental group (N=28) Control group (N=29)
Mean SD Mean SD
Reading time (min) 27.95 12.41 27.94 11.85
Sections read (%) 100.00 0.00 98.10 10.21
No. of scroll events 117.50 77.01 122.10 69.91
Time per scroll event (s) 23.24 22.78 22.10 24.17
Question attempts 15.61 12.88 16.62 9.58
Figure 3: Total number of scroll events per section with positions of adjunct questions marked.
ure 3), time per scroll event, and number of response
attempts during reading.
From the knowledge tests, pretest scores, posttest
scores, and RC scores were determined for each
group. Pretest scores were calculated from the 8
pretest questions, posttest scores from the same 8
questions, and RC scores from the 12 additional ques-
tions asked in the posttest.
4.2 Results
The anonymized data and analysis scripts used are
publicly available
5
.
The differences in reading and question statistics
per participant can be seen in Table 1. These were
not significant in each case. All participants read an
average of about 99.04 % (SD=7.28 %) of the text, in
an average of 27.94 minutes (SD=12.02 minutes), and
answered an average of 80.61 % (SD=56.16 %) of the
questions.
The confounding variables identified through the
questionnaire and data analysis revealed no statisti-
cally significant differences between the two groups,
indicating successful randomization.
The differences in pretest, posttest, and RC, all
of which were not statistically significant, are shown
in Table 2. While the experimental group showed
slightly higher scores across all measures, these dif-
ferences did not reach statistical significance.
4.3 Discussion
While the study showed no statistically significant
differences in learning outcomes between groups,
several important insights were gained. First, the
5
https://osf.io/ftx7h/?view only=0e6a854ddb4845bf
8fdde4228021647d (accessed 2025/01/10).
high completion rates of both reading (98-100 %) and
question-answering (81 %) suggest strong engage-
ment with the system across both conditions. This
indicates that the basic design principles of the pro-
totype - integrating questions with text and provid-
ing an unobtrusive interface - successfully maintained
student engagement.
The lack of significant differences between groups
may be attributed to several factors. First, the rela-
tively short exposure time (less than one hour) and
limited content (one medium-length text with twenty
questions) may have been insufficient to demonstrate
the potential benefits of comprehension visualization.
In a real educational setting, students would interact
with the system over an entire semester across mul-
tiple texts, allowing for repeated exposure and prac-
tice effects. However, the unobservable differences
between the two groups may also be due to the fact
that learning analytics instruments do not have such a
decisive influence on learning activities and learning
success (Hellings and Haelermans, 2022).
Additionally, both groups received embedded
questions during reading, which prior research has
shown to be beneficial for comprehension (Peverly
and Wood, 2001; Callender and McDaniel, 2007).
This design choice may have reduced the potential
impact of the comprehension visualization, as both
groups benefited from active engagement with the
content through questioning. Future studies might
consider comparing the current system against a con-
trol condition with no embedded questions to isolate
the effects of comprehension visualization better.
Despite these limitations, the study provided valu-
able validation of the technical implementation. The
prototype demonstrated robust performance across
multiple platforms with minimal user guidance, effec-
tively serving as a validation prior to potential longer-
term deployment in educational settings. The suc-
Dynamic Reading Comprehension Visualization in Digital Course Texts
271

Table 2: Test statistics.
Experimental group (N=28) Control group (N=29)
Mean SD Mean SD
Pretest grades (%) 59.00 14.61 57.79 13.44
Posttest grades (%) 69.11 14.43 68.04 14.81
RC grades (%) 72.70 15.71 71.24 11.71
cessful implementation of the logging system and ex-
perimental framework also provides a foundation for
future studies as the tool evolves.
5 CONCLUSION AND OUTLOOK
This work demonstrated how reading comprehen-
sion can be modeled and visualized in digital texts
(RQ1). The developed prototype successfully in-
tegrated questions that were adaptive to reading
progress and provided real-time visualization of com-
prehension scores. Ideally, when the instructor fills a
text with many questions for each section, it results
in a kind of text coverage for the students to monitor
their learning progress. This was approached and im-
plemented in a Moodle environment for a study that
collected data about reading behavior and RC. While
our experimental evaluation (RQ2) did not show sig-
nificant differences in learning outcomes, it validated
the approach’s technical feasibility and user accep-
tance, with high engagement rates across both exper-
imental conditions.
The study’s findings suggest several promising di-
rections for future research. First, a longer-term field
study is needed to evaluate the system’s impact over
an entire semester, where the cumulative effects of
comprehension visualization might become more ap-
parent. This would also allow for investigating how
students’ interaction patterns with the system evolve
over time.
The prototype could be enhanced in several ways
to provide more personalized and adaptive support.
Questions could be preselected based on individual
comprehension levels (Alonzo et al., 2009), ques-
tion difficulty, broader learning profiles (Yang et al.,
2021), and temporal engagement patterns. The sys-
tem could implement intelligent fading of questions
when comprehension is high, provide targeted help
when performance is low, and suggest specific sec-
tions for review based on answer patterns (Thaker
et al., 2020). Future versions could incorporate au-
tomated question generation and semantic matching
of content to reduce instructor workload while main-
taining pedagogical quality. RC measurement could
be enhanced by incorporating additional factors such
as text-marking patterns (Yang et al., 2021), reading
frequency, and broader course activities (Hoppe et al.,
2021).
A dashboard showing individual student compre-
hension patterns could enable more targeted interven-
tions for instructors. This could be particularly valu-
able in identifying struggling students early in the
semester. The current prototype is a foundation for
these enhancements, demonstrating robust technical
performance and strong user engagement.
While our initial results did not show significant
learning gains, they provide valuable insights for de-
signing digital reading support systems and highlight
important considerations for future research. The
high engagement rates suggest that students are re-
ceptive to integrated RC support, warranting further
investigation of how such systems can be optimized
to maximize their educational impact.
ACKNOWLEDGEMENTS
This research was supported by the Research Clus-
ter “CATALPA – Center of Advanced Technology for
Assisted Learning and Predictive Analytics” of the
FernUniversit
¨
at in Hagen, Germany.
REFERENCES
Alonzo, J., Basaraba, D., Tindal, G., and Carriveau, R. S.
(2009). They read, but how well do they understand?:
An empirical look at the nuances of measuring read-
ing comprehension. Assessment for Effective Inter-
vention, 35:34–44.
Boticki, I., Ogata, H., Tomiek, K., Akcapinar, G., Flanagan,
B., Majumdar, R., and Hasnine, N. (2019). Identifying
reading styles from e-book log data. pages 312–317.
Asia-Pacific Society for Computers in Education.
Bravo-Marquez, F., L’Huillier, G., Moya, P., R
´
ıos, S. A.,
and Vel
´
asquez, J. D. (2011). An automatic text com-
prehension classifier based on mental models and la-
tent semantic features.
Callender, A. A. and McDaniel, M. A. (2007). The benefits
of embedded question adjuncts for low and high struc-
ture builders. Journal of Educational Psychology, 99.
Caruso, M., Peacock, C., Southwell, R., Zhou, G., and
D’Mello, S. (2022). Going deep and far: Gaze-based
CSEDU 2025 - 17th International Conference on Computer Supported Education
272

models predict multiple depths of comprehension dur-
ing and one week following reading. Intl. EDM Soci-
ety.
Christhilf, K., Newton, N., Butterfuss, R., McCarthy, K. S.,
Allen, L. K., Magliano, J. P., and McNamara, D. S.
(2022). Using markov models and random walks to
examine strategy use of more or less successful com-
prehenders. International Educational Data Mining
Society.
Crossley, S. A., Skalicky, S., Dascalu, M., McNamara,
D. S., and Kyle, K. (2017). Predicting text compre-
hension, processing, and familiarity in adult readers:
New approaches to readability formulas. Discourse
Processes, 54:340–359.
Cutting, L. E. and Scarborough, H. S. (2006). Predic-
tion of reading comprehension: Relative contributions
of word recognition, language proficiency, and other
cognitive skills can depend on how comprehension is
measured. Scientific Studies of Reading, 10:277–299.
Daniel, D. B. and Woody, W. D. (2013). E-textbooks at
what cost? Performance and use of electronic v. print
texts. Computers and Education, 62:18–23.
Davis, F. B. (1944). Fundamental factors of comprehension
in reading. Psychometrika, 9:185–197.
Fletcher, J. M. (2006). Measuring reading comprehension.
Scientific Studies of Reading, 10:323–330.
Foroughi, C. K., Werner, N. E., Barrag
´
an, D., and Boehm-
Davis, D. A. (2015). Interruptions disrupt reading
comprehension. Journal of Experimental Psychology,
144.
Gooding, S., Berzak, Y., Mak, T., and Sharifi, M. (2021).
Predicting text readability from scrolling interactions.
Association for Computational Linguistics.
Gough, P. B. and Tunmer, W. E. (1986). Decoding, reading,
and reading disability. Remedial and Special Educa-
tion, 7:6–10.
Guerra, J., Parra, D., and Brusilovsky, P. (2013). Encour-
aging online student reading with social visualization
support. Proceedings of the Workshops at the 16th
International Conference on Artificial Intelligence in
Education AIED, pages 47–50.
Hellings, J. and Haelermans, C. (2022). The effect of pro-
viding learning analytics on student behaviour and
performance in programming: a randomised con-
trolled experiment. Higher Education, 83:1–18.
Hoppe, H. U., Doberstein, D., and Hecking, T. (2021).
Using sequence analysis to determine the well-
functioning of small groups in large online courses.
International Journal of Artificial Intelligence in Edu-
cation, 31:680–699.
Kim, M. K., Gaul, C. J., Bundrage, C. N., and Madathany,
R. J. (2020). Technology supported reading com-
prehension: a design research of the student mental
model analyzer for research and teaching (smart) tech-
nology. Interact. Learn. Environ.
Landrum, R. E., Gurung, R. A., and Spann, N. (2012).
Assessments of textbook usage and the relationship
to student course performance. College Teaching,
60:17–24.
Milliner, B. and Cote, T. (2015). One year of extensive read-
ing on mobile devices: engagement and impressions.
pages 404–409. Research-publishing.net.
Panel, N. R. (2000). Teaching children to read: An
evidence-based assessment of the scientific research
literature on reading and its implications for reading
instruction. NIH Publication No. 00-4769, 7.
Peckham, T. and McCalla, G. (2012). Mining student be-
havior patterns in reading comprehension tasks.
Perfetti, C. A., Landi, N., and Oakhill, J. (2005). The acqui-
sition of reading comprehension skill. pages 227–247.
Peverly, S. T. and Wood, R. (2001). The effects of ad-
junct questions and feedback on improving the read-
ing comprehension skills of learning-disabled adoles-
cents. Contemporary Educational Psychology, 26:25–
43.
Seidel, N., Stritzinger, A., Menze, D., and Friedrich, K.
(2024). Longpage - A Moodle activity plugin de-
signed to assist learners with reading extended texts.
Slade, S. and Prinsloo, P. (2013). Learning analytics: Ethi-
cal issues and dilemmas. American Behavioral Scien-
tist, 57:1510–1529.
Sun, J. C. Y., Lin, C. T., and Chou, C. (2018). Applying
learning analytics to explore the effects of motivation
on online students’ reading behavioral patterns. In-
ternational Review of Research in Open and Distance
Learning, 19:209–227.
Sun, Y., Harper, D. J., and Watt, S. N. K. (2004). De-
sign of an e-book user interface and visualizations to
support reading for comprehension. pages 510–511.
ACM Press.
Suresh, K. (2011). An overview of randomization tech-
niques: An unbiased assessment of outcome in clin-
ical research. Journal of Human Reproductive Sci-
ences, 4:8.
Syed, R., Collins-Thompson, K., Bennett, P. N., Teng, M.,
Williams, S., Tay, D. W. W., and Iqbal, S. (2020). Im-
proving learning outcomes with gaze tracking and au-
tomatic question generation. pages 1693–1703. ACM.
Thaker, K. M., Zhang, L., He, D., and Brusilovsky, P.
(2020). Recommending remedial readings using stu-
dent knowledge state. International Conference on
Education Data Mining.
Wang, S. and Walker, E. (2021). Providing adaptive feed-
back in concept mapping to improve reading compre-
hension. Conference on Human Factors in Computing
Systems - Proceedings.
Yang, A. C., Chen, I. Y., Flanagan, B., and Ogata, H. (2021).
Automatic generation of cloze items for repeated test-
ing to improve reading comprehension. Educational
Technology and Society, 24:147–158.
Dynamic Reading Comprehension Visualization in Digital Course Texts
273
