
Synchronized Drone and Truck Routing Problem: A Multi-Stakeholder
Perspective
Maria Elena Bruni
1,3 a
, Sara Khodaparasti
2 b
, Giuseppe Muratore
1
and Vincenzo Gentile
1
1
Department of Mechanical, Energy and Management Engineering, University of Calabria, Rende, Italy
2
Department of Management and Production Engineering, Polytechnic University of Turin, Turin, Italy
3
CIRRELT, Montreal, Canada
Keywords:
Last-Mile Delivery, Synchronized Truck and Drone Delivery, Vehicle Routing Problem, Multi-Objective
Optimization, Meta-Heuristic.
Abstract:
This paper introduces a synchronized truck and drone routing problem consisting a fleet of capacitated trucks
and drones dispatching last-mile deliveries. Each truck, while traveling on its route to serve customers, could
stop and launch drones which perform multiple back and forth trips between the truck and one or more de-
livery destination, serving one customer at a time. The synchronization between trucks and drones moves
is mandatory since the drone is launched and retrieved by the truck, that should wait for delivery comple-
tion and drone retrieval. Following a multi-stakeholder perspective, different customer- and business-oriented
objectives are included to account for the presence of different (public an private) actors and end-users with
conflicting interests and preferences. We formulate the problem as a mixed-integer program to determine the
optimal truck routes and sequence of drone trips under the synchronization assumption. The proposed model
is then solved by a meta-heuristic solution approach.
1 INTRODUCTION
The last few years have seen a sharp increase of the
paradigms of on-demand economy and e-commerce.
New emerging business models are no longer driven
by suppliers, but are more and more influenced by
customers’ preferences and expectations in terms of
time and cost, with a consequent disruptive impact
on the delivery process (Perboli and Rosano, 2019).
To survive in such a competitive market, e-commerce
companies should face the upward trend for fast and
cheap deliveries, optimizing the last-mile process. It
is well-recognized that routing inefficiencies, in the
last leg of of the distribution, may contribute to de-
layed deliveries, loss of revenues and profits and
above all, unsatisfied customers. To catch up with
these trends, in the last decade, new delivery sys-
tems, exploiting the complementary nature of trucks
and drones, have been investigated with the aim of
assessing the value of using drones within logistics
chain. Drones are considered as a potential solu-
tion to the last-mile challenges, because of their high
a
https://orcid.org/0000-0002-3152-5294
b
https://orcid.org/0000-0003-3858-2571
travel speed and ability to access areas regardless of
road infrastructure, to deliver small packages in a fast
and sustainable way, significantly accelerating deliv-
ery times and reducing human intervention. Even
though the speed of drones can offer significant time
savings with respect to the traditional vehicles trav-
eling congested routes, drone-aided delivery systems
are challenged by intrinsic characteristics of aerial ve-
hicles, such as limited payload capacities, battery en-
durance and sensitivity to weather conditions. More-
over, the debate on the regulatory and safety issues
of air control administrations and long-term viabil-
ity, is far to be resolved. Despite all these issues,
the idea of drone-aided delivery is gaining ground
from both practitioners, persuaded to apply sustain-
able, cost- and time-efficient transport alternatives,
and researchers, promoting multi-modal and collab-
orative delivery systems combining terrestrial (such
as trucks) and aerial vehicles (Unmanned Aerial Ve-
hicles (UAVs) or drones).
The design of an efficient multi-modal joint deliv-
ery system is not straightforward for the main chal-
lenges of coordinating and synchronizing trucks and
drones, especially when a set of truck routes needs
to be synchronized with the drones movements. In
328
Bruni, M. E., Khodaparasti, S., Muratore, G. and Gentile, V.
Synchronized Drone and Truck Routing Problem: A Multi-Stakeholder Perspective.
DOI: 10.5220/0013217600003893
In Proceedings of the 14th International Conference on Operations Research and Enterprise Systems (ICORES 2025), pages 328-339
ISBN: 978-989-758-732-0; ISSN: 2184-4372
Copyright © 2025 by Paper published under CC license (CC BY-NC-ND 4.0)

a synchronized multi-truck and multi-drone model, a
mixed fleet of homogeneous capacitated trucks, that
deliver heavy packages, and multiple sidekick drones
that carry out lightweight deliveries are employed.
Each truck dispatched from the depot travels a route
starting from a central depot, visits a subset of cus-
tomers and returns back to the depot after the last de-
livery completion. The truck also serves as a mobile
depot and launch and retrieve platform for the side-
kick drones and moves them to the proximity of the
drone delivery area, where the truck stops, launches
the drone to deliver a single customer order and re-
trieves it back once the delivery mission is completed.
The drone is allowed to perform multiple one-to-one
delivery trips between the stationary truck and cus-
tomer locations as long as its battery is not depleted.
Due to safety regulations and to better monitor the
drone moves, the truck driver awaits at the location
until all scheduled multi-trip deliveries are performed
and the drone is retrieved. This fundamental assump-
tion makes the relative movements non-simultaneous,
however, the synchronization is still relevant since the
truck departure can be scheduled only after the drone
retrieval. Obviously, this joint scheme requires more
complex evaluation and planning models and proce-
dures, compared to those existing in the literature as
not only the operations of each transport mode should
be optimized, but also the interactions between dif-
ferent vehicle types, such as the synchronization and
coordination of the traditional vehicle with the drones
are involved. That is the focus of the present study.
We extend the synchronized drone and truck delivery
with non-simultaneous relative movements between
one truck and drones to the case with multiple trucks.
On the other hand, the complexity of drone-
aided delivery applications goes far beyond the syn-
chronization problem since the social and environ-
mental concerns of the public stakeholder (in terms
of pollution, traffic congestion, and other externali-
ties), the economic interests of the delivery system
owner, and the expectations of customers call for
a multi-stakeholder optimization approach. To ful-
fill this goal, we adopt a multi-objective perspective
and model the synchronized drone and truck rout-
ing problem considering the following four objective
functions of i) total profit, (assuming that each de-
livery brings a profit to the stakeholder that should
decide which customers to serve), ii) total traveling
cost for trucks (it may also represent environmen-
tal costs), iii) sum of arrival times to each customer
visited by a truck or a drone (also called latency)
reflecting the customers’ satisfaction and finally iv)
number of trucks dispatched from the depot (cost-
efficiency of the transport system). Since the fleet
cost –proportional to the fleet size– is a consider-
able contribution to the operating costs, the decision
maker could optimize the number of trucks to be em-
ployed. Except the latency goal, that is a customer-
oriented objective, the other three goals are business-
oriented. In general, not all the delivery requests are
profitable, especially those prolonging the arrival time
of other requests, and therefore, some requests might
be skipped. This imposes a selective structure to the
problem exacerbating its complexity.
The complication of drone-aided deliveries is also
linked to intrinsic drone-related features –such as lim-
ited drone payload, battery capacity, and variable
energy consumption in drone battery due to wind
and weather condition– restricting the drone delivery
range and number of allowed back and forth trips be-
tween the truck and customer locations. The litera-
ture is abundant in contributions that treat the drone-
related issues as those in the traditional terrestrial ve-
hicle routing problems, either by setting a maximum
drone endurance in terms of travel distance/time or
approximating the energy consumption as a linear
function of drone payload and travel time that later
brings the validity and applicability of the obtained
solutions into question. To fill this gap, we model
the energy consumption in drone battery as a non-
linear function of drone payload and travel time and
adopt a distributionally robust optimization approach
to capture the uncertainty of energy consumption due
to variations in drone speed and travel time.
The contributions of this paper are manifold. We
address a novel multi-trip synchronized truck and
drone routing problem, under a multi-criteria set-
ting addressing both business- and customer-oriented
goals where the realistic drone-related features in
terms of load-dependent energy consumption rates
and the fluctuations in weather condition causing
speed and travel time variations are taken into ac-
count. To solve the problem, we apply an evolution-
ary meta-heuristic algorithm that efficiently handles
instances of reasonable size, as shown in the compu-
tational experiments.
The remainder of this paper is organized as fol-
lows. Section 2 presents a detailed review on the
relevant literature. Section 3 describes the prob-
lem setting and the mathematical formulation. Sec-
tion 4 proposes the Non-Dominated Sorting Ge-
netic Algorithm-II (NSGA-II), as a well-known meta-
heuristic for multi-objective problems. Section 5
presents computational results evaluating the validity
of the proposed model and the efficiency of the solu-
tion approach. Finally, Section 6 concludes the paper
and summarizes some directions for future research.
Synchronized Drone and Truck Routing Problem: A Multi-Stakeholder Perspective
329

2 LITERATURE REVIEW
In the last decade, a large body of the operations re-
search literature has focused on routing problems for
drone delivery. Several new challenges, derived from
the multi-modal nature of delivery system combin-
ing the terrestrial and aerial vehicle types with ex-
tremely different characteristics, has stimulated a ris-
ing interest in the optimization community unveiling
different drone integration schemes in the last-mile
delivery context. The flourishing literature on drone
delivery involves different problem variants catego-
rized based on problem features, such as number of
trucks and drones, the number of trips allowed for the
drones and/or trucks, the interrelation between trucks
and drones as independent or sidekick working units
that brings the parallel (unsynchronized) or synchro-
nized movements into question, different launch and
retrieve policies (either at the depot or while the truck
is en-route) simultaneous and non-simultaneous rela-
tive movements.
When the routing problem combines one truck
and one or more drones, it can be view as a variant
of the traditional Traveling Salesman Problem (TSP).
Depending on the synchronization level between the
vehicles, it is referred to as the Flying Sidekick Trav-
eling Salesman Problem (FSTSP) or Parallel Drone
Scheduling TSP (PDSTSP). The fundamental differ-
ence between these two problems is the synchro-
nization issue. While in the FSTSP problem trucks
and drones operations must be coordinated, in the
PDSTSP the synchronisation issue is not relevant as
truck and drones work independently. In the FSTSP,
the truck carries the drone and it can decide to launch
the drone to deliver the orders of a few customers in
the nearby while the truck could continue its route to
serve other customers and finally meet the drone at a
rendezvous location, with the objective of minimizing
the makespan, that is the time required by the truck to
return to the depot. In the PDSTSP, the drones are di-
rectly deployed from the depot, serving one customer
at a time but possibly performing multiple trips.
In this Section, we focus on the literature on
PDSTSP since our contribution essentially belongs to
the class of PDSTSP in which the synchronization is-
sues are also incorporated. Following the research
stream on PDSTSP, Murray and Chu (2015) pro-
posed an MILP formulation and a heuristic method
for PDSTSP, tested on small instances with 10 and 20
customers. The heuristic builds a TSP tour for cus-
tomers visited by the truck and after assigns the re-
maining customers to drones. Mbiadou Saleu et al.
(2018), proposed the first iterative two-step heuristic
for the problem. First, the customer sequence is de-
termined and then, it is decomposed into a tour for
the truck and a set of trips for the drones. DellAm-
ico (2020) presented a simplified mixed integer lin-
ear programming model for the PDSTSP and a set
of matheuristic algorithms tested on instances with
48–229 customers. Several PDSTSP variants have
been also introduced and studied in the literature.
Kim and Moon (2019) considered a variant in which
drones can be deployed from the depot but also from
dedicated drone stations to address the limitations of
the drone flight range. Ham (2018) studied a multi-
truck multi-depot pickup and delivery variant of the
PDSTSP where a drone, after the delivery task, can
either fly back to the depot or reach another pickup
customer. Several publications in the literature have
investigated the objective function of minimizing the
total transportation cost in routing problems using
the truck-drone combination for delivery. Moshref-
Javadi et al. (2020a) extended the PDSTSP, imple-
menting a different operating condition, to better re-
flect the realities associated with the complex nature
of last-mile distribution logistic problems. Specifi-
cally, this variant of the problem considers that drones
can either take off from the depot or to a node reached
by the by the truck (this node could be a customer or
a parking area or a locker point). The drone delivers a
set of packages, servicing one customer at a time per-
forming back and forth trips, and returns to the truck,
waiting for the return of all the drones launched. An
efficient ALNS meta-heuristic was designed to solve
real-world-size instances and tested on several small
instances in the benchmark that found near-optimal
solutions within low computational time. The model
and solution approach were also tested on a real-world
case study of e-commerce deliveries in Sao Paulo,
Brazil. They compare their model with the classi-
cal traveling repairman problem, showing the effec-
tiveness of using a multi-modal system delivery com-
pared to the traditional delivery system with terres-
trial vehicle. Moshref-Javadi et al. (2020b) propose a
hybrid tabu search-simulated annealing algorithm for
solving their variant on real-world-size problem in-
stances.
The present paper extends the PDTSP problem
along several dimensions. First of all, more than
one truck is considered. Secondly, this variant of the
problem considers synchronized shipping operations,
where the drones can be launched at any truck stop.
Different constraints for the trucks and the drones are
also considered. First, the total weight of parcels
loaded into the truck should not exceed the truck ca-
pacity and drones have limited payload. Second, we
impose a restriction on the energy consumed by each
drone during the whole service. We should notice
ICORES 2025 - 14th International Conference on Operations Research and Enterprise Systems
330
that, since drones are faster than trucks, any solu-
tion which ignores the battery endurance, will exten-
sively employ more drones against trucks. We remove
the restrictive (and often unrealistic) assumption that
the drone battery is fully charged/swapped while the
truck is moving, rather considering that the drone bat-
teries will be charged at the end of the service, when
the truck comes back into the depot.
Previous studies do not consider neither truck
capacity constraints nor intrinsic characteristic of
drones.
3 SYNCHRONIZED MULTI-TRIP
DRONE AND TRUCK ROUTING
PROBLEM
3.1 Problem Description
In the Synchronized Multi-Trip Drone and Truck
Routing Problem (SMTDTRP), a fleet of capacitated
trucks, each hosting at least one drone, departs from a
single depot to service a subset of potential customers.
Some customer orders are required to be delivered
only by truck (cases where the order volume and mass
is beyond the drone payload capacity, the travel time
to reach the delivery location by a drone violates the
drone maximum endurance, or the local meteorolog-
ical at the delivery site prevents the use of drone)
while other customers, ordering light packages, can
be served by drones. A profit is associated with each
customer and the vehicles can skip serving some cus-
tomers, depending on the profit rate, thus framing the
problem as a selective one. Clearly, adding the deci-
sion on the selection of customers to be served exac-
erbates the problem complexity. The trucks are able
to dispatch drones from the vehicle roof and, start-
ing from the depot, visit every customer exactly once.
Drones can be dispatched from the truck delivering
light packages to nearby customers while the truck is
servicing a truck-only customer and then waits for the
drone to retrieve it. The drone is allowed to perform
multiple back and forth trips (but can serve only one
customer per operation), and then returns to the truck
from which the drone started its mission. The truck
should wait until the dispatched drones have com-
pleted the delivery operations. The drones, with lim-
ited payload and battery capacity, are fully charged
at the beginning of the service and the battery cannot
be recharged nor swapped until the truck returns to
the depot. The non-simultaneous relative movements
between truck and drone holds in many applications
especially those in which the drone track should be
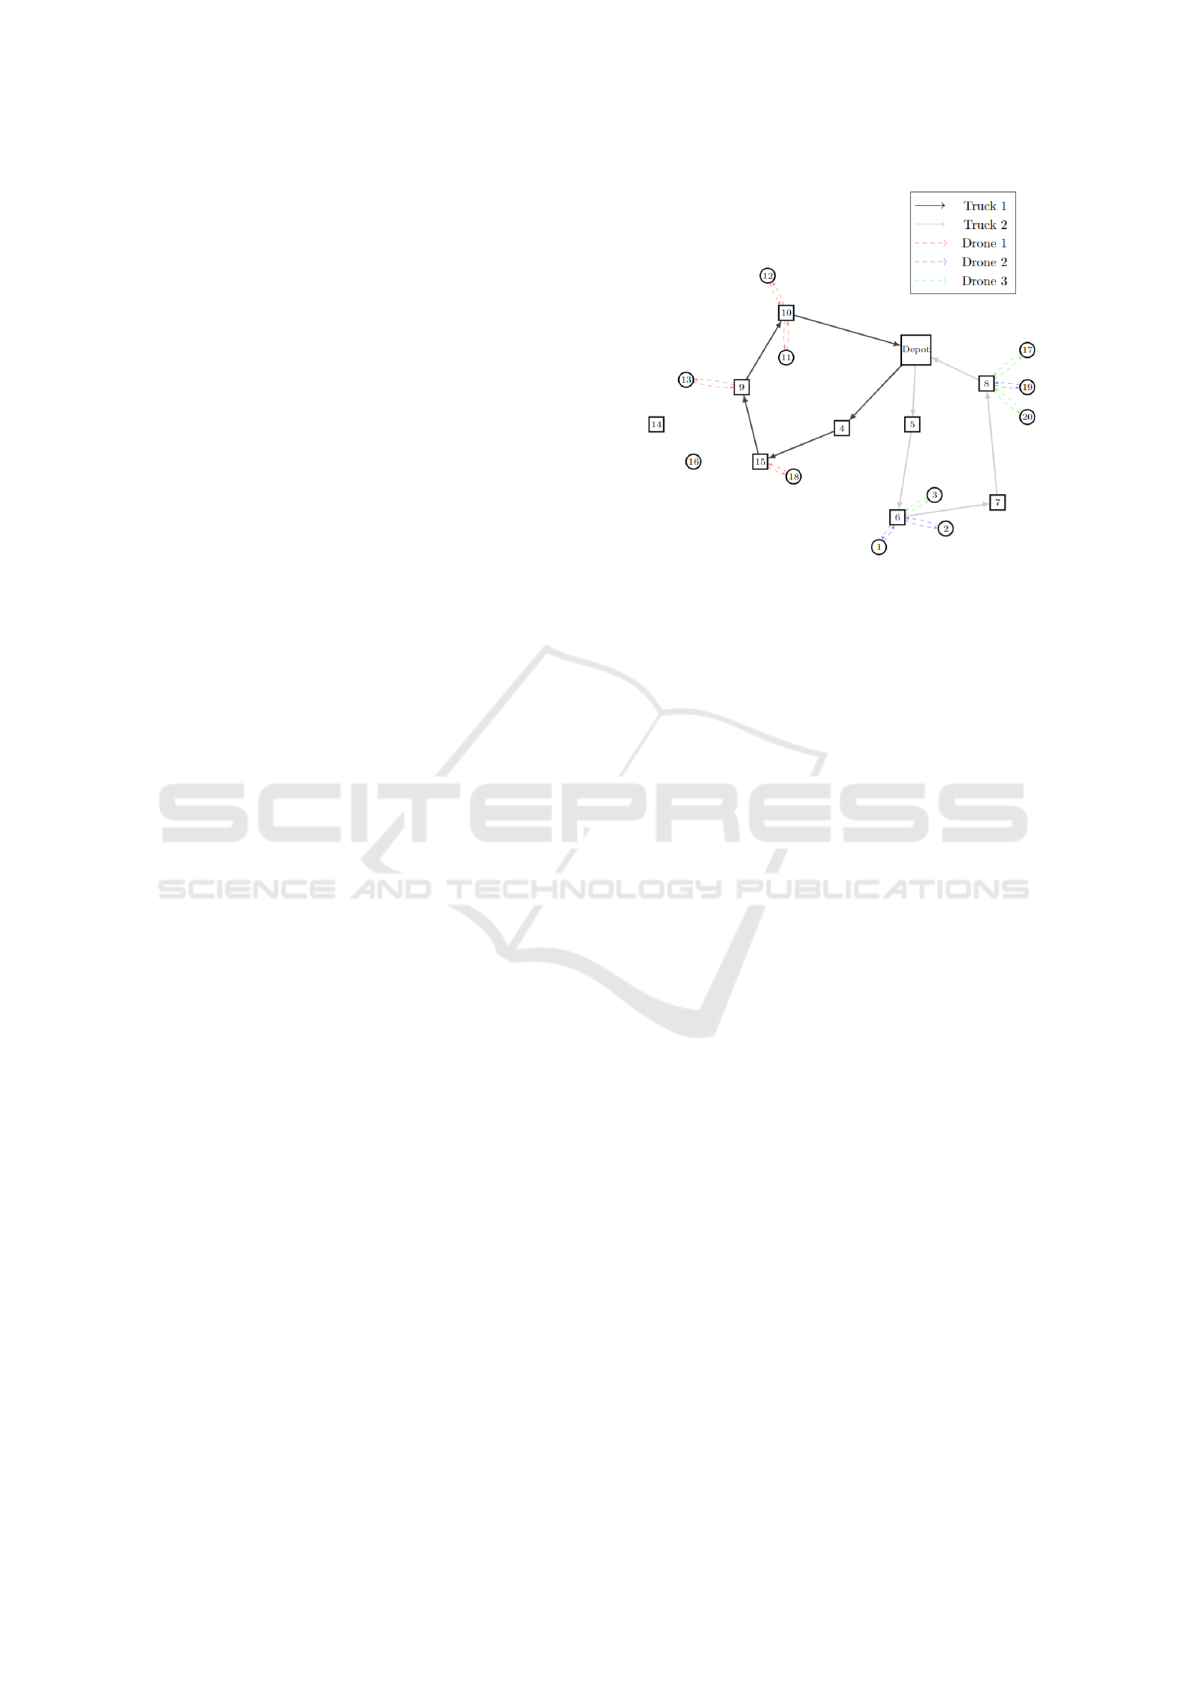
Figure 1: A nominal routing plan.
frequently monitored due to safety regulations. Fig-
ure 1 represents a possible routing plan for an exam-
ple with two trucks. One truck serves customers 4,
15, 9 and 10 and hosts one drone (Drone 1) perform-
ing deliveries to customers 18, 13, 11, and 12. The
other truck (Truck 2) visits customers 5, 6, 7, and 8
and hosts two drones that deliver the orders of cus-
tomers 1, 2, and 19 (by Drone 2) and customers 3, 17,
and 20 (by Drone 3).
The energy consumption in drone battery depends
(linearly) on travel time, and (non-linearly) on drone
frame mass (W ), battery mass (m), and payload (p).
Assuming that the drone battery capacity is denoted
by C , the total drone energy consumption within a trip
r, with travel time d
r
, to deliver a parcel of mass p
r
can be evaluated as follows.
E
r
= k
′
(W + m + p
r
)
3/2
d
r
+ k
′
(W + m)
3/2
d
r
(1)
where k
′
is a constant depending on the air density, the
area of the spinning blade disc and the gravity. The
first term in (1) represents the energy consumption
during the trip towards the customer’s location while
the drone is carrying the order and the second term
denotes the energy consumption during the drone re-
turn trip to the truck when the order is delivered and
thus drone payload is zero.
We assume that drones perform one-to-one de-
livery trips r ∈ R until the battery is depleted, i.e.,
∑
r∈R
E
r
≤ C. Uncertain weather conditions, i.e., wind
speed and direction, could drastically affect the en-
ergy consumption. To guarantee that under different
weather scenarios, the drones operate in a safe and ef-
ficient fashion, we adopt a distributionally robust opti-
mization framework in which we suppose the battery
consumption is uncertain and although its probabil-
ity distribution is not completely specified, we have
Synchronized Drone and Truck Routing Problem: A Multi-Stakeholder Perspective
331

some partial information on its distribution function
knowing that it belongs to a class of distributions
with known mean and covariance. This assumption
of course broadens the applicability of the approach,
that can be applied to different real-life scenarios. It
is worthwhile mentioning that the selection of the ap-
propriate distribution functions for energy consump-
tion is not straightforward (for more information on
energy consumption functions in drone battery see
Zhang et al. (2021)).
Knowing this, we may apply the probabilistic
chance constraint (2) to account for both the uncer-
tainty of energy consumption and limited battery ca-
pacity.
P(
∑
r∈R
E
r
≤ C) ≥ 1 − α (2)
where α ∈ [0,1] is the risk level and thus 1−α denotes
the decision maker’s risk-aversion tendency. Under
this assumption, the distributionally robust counter-
part for constraint (2) can be written as
µ +
r
1 − α
α
σ ≤ C (3)
where µ =
∑
r∈R
µ(E
r
) represents the expected value
corresponding to the total energy consumption and
σ =
∑
r∈R
σ(E
r
) is the total variance (Lam, 2019;
Calafiore and Ghaoui, 2006).
The problem consists in deciding the subset and
the sequence of potential customers that should be
serviced by trucks and drones, as well as possible
assignments of customers to drones performing back
and forth trips. In particular, four objectives are of
our interest: maximizing the total profit assigned to
delivered orders, minimizing the total latency (arrival
time to customers), minimizing the total travel cost,
and minimizing the number of deployed trucks.
3.2 Mathematical Model
The formulation makes use of the notation in Table 1
and the mathematical model is cast as (4)-(27).
max
∑
i∈V
∑
j∈V
′
∑
k∈K
π
j
x
k
i j
+
∑
i∈V
∑
j∈V
′
∑
k∈K
∑
u∈U
∑
r∈R
π
j
f
kur
i j
(4)
min
∑
i∈V
′
∑
k∈K
(t
k
i
+
ˆ
t
k
i
) (5)
min
∑
i∈V
∑
j∈V
′
∑
k∈K
c
i j
x
k
i j
(6)
min
∑
j∈V
′
∑
k∈K
x
k
0 j
(7)
∑
j∈V
x
k
i j
=
∑
j∈V
x
k
ji
i ∈ V, k ∈ K (8)
∑
j∈V
′
x
k
i j
≤ 1 i ∈ V, k ∈ K (9)
∑
j∈V
′
∑
u∈U
∑
r∈R
f
kur
i j
≤ M y
k
i
i ∈ V, k ∈ K (10)
∑
i∈V
x
k
i j
≥ y
k
j
j ∈ V
′
, k ∈ K (11)
t
k
i
+ z
k
i
+ d
i j
− M (1 − x
k
i j
) ≤ t
k
j
i ∈ V, j ∈ V
′
i ̸= j, k ∈ K (12)
∑
j∈V
′
∑
r∈R
(
ˆ
d
i j
+
ˆ
d
ji
) f
kur
i j
≤ z
k
i
i ∈ V, k ∈ K, u ∈ U
(13)
∑
j∈V
′
f
kur
i j
≥
∑
j∈V
′
f
ku(r+1)
i j
i ∈ V, k ∈ K, u ∈ U
r ∈ R (14)
∑
i∈V
∑
u∈U
∑
r∈R
∑
k∈K
f
kur
i j
+
∑
i∈V
∑
k∈K
x
k
i j
≤ 1 j ∈ V
′
(15)
∑
j∈V
′
f
kur
i j
≤ 1 i ∈ V, k ∈ K, u ∈ U, r ∈ R (16)
t
k
i
+
ˆ
d
i j
− M (1 − f
kur
i j
) +
∑
j∈V
′
∑
r
′
∈R
r
′
<r
(
ˆ
d
i j
′
+
ˆ
d
j
′
i
) f
kur
′
i j
′
≤
ˆ
t
k
j
i ∈ V, j ∈ V
′
, i ̸= j, u ∈ U, r ∈ R, k ∈ K (17)
∑
i∈V
∑
j∈V
′
∑
k∈K
∑
r∈R
(e
1
i j
+ e
2
ji
) f
kur
i j
≤ C u ∈ U (18)
∑
i∈V
∑
j∈V
′
q
j
x
k
i j
+
∑
i∈V
∑
j∈V
′
∑
u∈U
∑
r∈R
q
j
f
kur
i j
≤ Q
k
k ∈ K (19)
∑
k∈K
f
kur
i j
≤ 1 i ∈ V, j ∈ V
′
, r ∈ R, u ∈ U (20)
f
kur
i j
≥ M
∑
k
′
∈K
k
′
̸=k
f
k
′
ur
′
i
′
j
′
, i, i
′
∈ V, j, j
′
∈ V
′
,
r, r
′
∈ R, u ∈ U, k ∈ K (21)
f
kur
i j
= 0 i ∈ V, j ∈ V
K
, k ∈ K, u ∈ U, r ∈ R (22)
x
k
i j
= 0 i ∈ V, j ∈ V
D
, k ∈ K (23)
x
k
i j
∈ {0, 1} i ∈ V, j ∈ V
′
, k ∈ K (24)
f
kur
i j
∈ {0, 1} i ∈ V, j ∈ V
′
, k ∈ K, u ∈ U,
r ∈ R (25)
y
k
i
∈ {0, 1} i ∈ V, k ∈ K (26)
z
k
i
, t
k
i
,
ˆ
t
k
i
≥ 0 i ∈ V, k ∈ K (27)
Objective (4) maximizes the total profit of visited cus-
tomers and encompasses two terms corresponding to
the profit of customers visited by trucks and drones;
objective (5) minimizes the total latency, defined as
ICORES 2025 - 14th International Conference on Operations Research and Enterprise Systems
332

Table 1: Notation for the mathematical model.
Sets
V
′
Set of customers
V = V
′
∪ {0} Set of nodes including the depot (0) indexed by i, j, j
′
V
K
⊂ V
′
Set of customers to be visited by trucks
V
D
⊂ V
′
Set of customers to be visited by drones
U Set of drones indexed by u
K Set of trucks indexed by k
R Set of drone trips indexed by r, r
′
Parameters
q
i
Demand of customer i
π
i
Profit associated to customer i
Q
k
Capacity of truck k
c
i j
Time-dependent travel cost (such as environmental cost)
d
i j
Travel time for truck between node i and j
ˆ
d
i j
Travel time for drone between node i and j
e
1
i j
= k
′
(W + m + q
i
)
3/2
ˆ
d
i j
Energy consumption of a drone launched from node i to deliver the order of customer j
e
2
ji
= k
′
(W + m)
3/2
ˆ
d
ji
Energy consumption of a drone on its return trip after delivering order of customer j and coming back to the launch node i
C Drone battery capacity
M A sufficiently large number
Decision variables
x
k
i j
Binary variable that takes 1 if truck k travels from node i to reach node j
f
kur
i j
Binary variable that takes 1 if truck k stops at node i and launches drone u to visit customer j in its rth trip from node i; otherwise, 0
y
k
i
Binary variable takes 1 if truck k stops at node i to launch at least one drone; otherwise, 0.
z
k
i
Waiting time of truck k at node i
t
k
i
Waiting time of customer i served by truck k
ˆ
t
k
i
Waiting time of customer i served by a drone launched by truck k
the sum of customers’ arrival times visited by either
trucks or drones; Objective (6) minimizes the total
truck travel cost, and objective (7) minimizes the total
number of dispatched trucks. Constraints (8) ensure
the continuity of flow for each truck; Constraints (9)
ensure that the each truck can exit each customer at
most once. Constraints (10) relates the variables y
k
i
and f
kur
i j
and ensures that if a customer is supposed
to be visited by a drone, then it is mandatory that the
truck stops at a customer to launch the drone. Con-
straints (11) ensure that a truck can only stop at a
customer location to launch a drone, only if the truck
serves that customer. Constraints (12) define the ar-
rival time of a customer visited by a truck. Constraints
(13) define the waiting time of each truck as the max-
imum delivery time of all drones launched from that
truck. Constraints (14) sets the logical relation be-
tween the order of drone trips; so a drone can oper-
ate its r + 1 tour only if it has already performed r
trips. Constraints (15) show that each customer can
be served at most once either by a truck or a drone.
Constraints (16) indicate that the drones can serve at
most one customer within each trip. Constraints (17)
defines the arrival time of customer j visited by a
drone in terms of arrival time of the customer i that
the drone was launched from, and the time that the
drone spent to serve customers served before j. Con-
straints (18) define the limited drone battery over all
missions. Constraints (19) require that the total pay-
load of each truck over its tour is below the truck
capacity. Constraints (20) ensure that each drone is
assigned to at most one truck. Constraints (21) en-
sure that if a drone is deployed by a truck it cannot be
used by any other truck. Constraints (22) requires that
those customers allowed to be served only by trucks
cannot be visited by drones. In a similar way, Con-
straints (23) ensure that the those customers allowed
to be served by drones cannot be visited by trucks.
Finally, constraints (24)-(27) define the nature of vari-
ables.
4 SOLUTION METHODOLOGY
In this section, we present the sketch of the NSGA-
II solution algorithm that we apply to solve the pro-
posed model. Known as the multi-objective variant of
the genetic algorithm, the NSGA-II is one of the most
popular and promising evolutionary algorithms. The
algorithm efficiency is supported by the low compu-
tational complexity, limited to O(MN
2
), where M and
N are, respectively, the number of objective functions
and the population size. The algorithm is based on
the main idea of finding multiple non-dominated so-
lutions in a single simulation run as common in multi-
objective evolutionary algorithms. The NSGA-II ben-
efits from the elitism concept and does not require
any sharing parameter that significantly contributes to
its credibility (Deb et al., 2002). In a nutshell, the
algorithm main elements are: a fast non-dominated
sorting mechanism and a fast crowded distance es-
timation mechanism acting as intensification and di-
versification tools. The fast non-dominated sorting
mechanism sorts the population individuals into dif-
ferent fronts, where the front index represents the
non-domination level (rank) of the solutions in the
front. All the solutions in the first front are not dom-
inated by any other solution in the population and
Synchronized Drone and Truck Routing Problem: A Multi-Stakeholder Perspective
333
0
5 6
7
8 0
4
15
9
10
(6,1,2, 3) (8, 17,19,20) (15,18) (9,13) (10, 11,12)
Figure 2: Chromosome representation for solution in Figure
1.
dominate all elements in the other fronts; the elements
in the second front are dominated only by the solu-
tions in the first front and dominate all solutions in the
third fronts; in a similar way, the elements in the third
front are dominated only by those in the first and the
second front, and so on. Instead, the crowding dis-
tance estimation mechanism is used to maintain di-
versity in NSGA-II. The crowding distance provides
the density of solutions surrounding a particular solu-
tion in a nondominated set. The solutions in a non-
dominated front are first sorted in an ascending order
of magnitude, according to each normalized objective
function value. Then, for each objective, to the so-
lutions with smallest and largest objective function
values is associated a distance equal to infinity. For
the remaining pairs of adjacent solutions, the distance
value is evaluated as the absolute normalized differ-
ence in the corresponding objective function values.
The overall crowding-distance value is the sum of
distance values corresponding to each objective. In
what follows, we present the details on applying the
NSGA-II algorithm for the SMTDTRP.
4.1 Solution Representation
The population P includes N individuals correspond-
ing to solutions of the problem. Each solution con-
tains a set of tours, one tour for each truck, and each
tour is an ordered list of visited customers. In the so-
lution representation, to each drone is associated an
ordered list of nodes allowed to be visited. Each ele-
ment in the list contains the launch point of the drone
(necessarily a node in set V
K
, a truck-eligible cus-
tomer) followed by the set of customers visited in the
ordered trips.
Figure 2 displays the encoded chromosome corre-
sponding to the solution in Figure 1.
4.2 Initial Population Generation
To generate a population the following steps are fol-
lowed.
Each solution in the initial population is generated
following steps 1-6:
1. Select a random integer number N
k
∈ [1,|K|] rep-
resenting the number of deployed trucks (tours) in
the current solution.
2. To each truck k, assign a random integer value u
k
that specifies the number of drones assigned to the
truck.
3. For each customer in V
K
, repeat i to iii that builds
the truck tours:
• i. select randomly a customer i ∈ V
K
, to be re-
moved from V
K
and update V
K
.
• ii. select randomly a truck with free capacity to
add the order of customer i to.
• iii. Add customer i to the end of tour of truck k.
4. For each customer in V
D
, repeat i’ to vi:
• i’. select randomly a customer i ∈ V
D
, remove
it from set V
D
and update V
D
.
• ii’. select randomly a truck k
o
with residual ca-
pacity greater than payload of the order of cus-
tomer i.
• iii’. Randomly select a customer i
o
within the
tour of truck k
o
as the drone launch point
• v. Select randomly an available drone u
o
as-
signed to truck t
• vi. If the drone energy consumption is not vio-
lated, add customer i to the path of drone u
o
.
5. Update the objective function values and add the
solution to the population.
4.3 Fitness Evaluation
The fitness of the individuals is evaluated based on the
non-dominance rank and the crowding distance mea-
sure.
The crowding distance of a solution sol
i
that be-
longs to front F
l
with rank l is defined as:
cd(sol
i
) =
M
∑
m=1
f
i+1
m
− f
i−1
m
f
max
m
− f
min
m
(28)
where f
i
m
is the objective value of sol
i
with respect
to objective m and f
max
m
= max
sol
i
∈F
l
f
i
m
and f
min
m
=
min
sol
i
∈F
l
f
i
m
, respectively, represent the highest and
the lowest objective function among all individuals in
F
l
.
4.4 Parent Selection
As common in the classical genetic algorithm, a tour-
nament selection procedure is applied that chooses a
pair of individuals (parents) from the population to
be recombined using the crossover operators and later
ICORES 2025 - 14th International Conference on Operations Research and Enterprise Systems
334

modified by the mutation operations. The N new indi-
viduals are then merged into the population: next, this
extended population with size of 2N is sorted thanks
to the non-dominated sorting procedure. To shrink
the size of the population to N individuals, starting
from the first rank, all the solutions in the front are
added in the new population. If the resulting number
of solutions in the front is still less than N, the so-
lutions of the subsequent fronts in the order of their
ranks are inserted to complete the population. In case
the cardinality of a front is above the number of in-
dividuals needed to be added to the population set,
the crowded-comparison feature breaks the tie in fa-
vor of solutions with higher crowding distance. This
procedure respects the elitism as the non-dominance
sorting is applied on both the parents and offsprings.
4.5 Crossover Operators
The Crossover is one of the main operators in the
genetic algorithm that uses the information of two
individuals (current solutions) to produce offsprings,
representing new solutions. Given a crossover prob-
ability p
crossover
, the single truck and multi-truck
crossover operators could be applied. To this end,
we first need to explain the notion of Complementary
truck and complementary map:
Two trucks are complementary iff the truck (indecies)
and the set of visited customer are different (they do
not have any visited node in common).
Let I and I
′
be two individuals, the complementary
map of I is a list that includes all set of trucks from I
′
which are complementary to the trucks in I.
Crossover single truck
Let I and I
′
be two individuals, their offspring is gen-
erated by starting from the tour of one of the two indi-
viduals followed by adding the tour of the second one
skipping the customers already present.
Crossover multi-truck
In this case, one of the individuals is randomly se-
lected as the first parent (p
1
) and the other would be
the second one (p
2
). We create a map M in which
for each truck in the first individual, we store all the
complementary trucks belonging to the second indi-
vidual. We choose a random truck v and we add it to
the solution. From the map M we take the comple-
mentary list relating to vehicle v. If this list is empty,
the crossover ends. Otherwise we choose a random
number nc of complementary vehicles to add to the
solution. This number can range from 1 to NC, where
NC is the size of complementaries. We randomly take
nc vehicles from complementaries and add them to
the solution.
4.6 Mutation
With probability p
mutation
the following mutation op-
erators are applied.
• Intratour swap
This operator swaps the order of two randomly se-
lected customers within the truck tour. The swap
is done at least once and up to L times where L
denotes the length of truck tour.
• Delete nodes
This operator randomly deletes a prespecified
number of customers, let say D, from the tour of
a given truck where 0 ≤ D ≤ L − 2
5 COMPUTATIONAL RESULTS
In this Section, we report the the computational ex-
periments carried out on a set of benchmark instances
adapted from the literature in order to investigate the
efficiency of NSGA-II algorithm for the proposed
mathematical model.
All the experiments were executed on an Intel Core
i7-4700HQ, with 2.40 GHz CPU, 16 GB RAM and
the NSGA-II algorithm was coded in Java language
Arnold et al. (2005). In the following, we describe
the adopted test beds and present the computational
results.
5.1 Data Sets and Parameter Settings
As the benchmark, we used the set of instances from
Dewilde et al. (2013) originally designed for the trav-
eling repairman problem with profits. In particular,
we considered four classes of instances with 50, 100,
200, and 500 customers and selected the first two
instances of each class. We modified the instances
appropriately to account for the presence of drones
and variations in travel speed. In our setting, it is
assumed that up to 75% of customers can be vis-
ited by trucks and the remaining ones by the drones
(|V
K
| = ⌊0.75V
′
⌋, |V
D
| = |V
′
| − |V
K
|). Regarding the
uncertainty of drone energy consumption, we ran-
domly generated the variance of the energy consump-
tion in each drone trip as σ
2
= χ µ where µ is the ex-
pected energy consumption and χ is a randomly gen-
erated value where χ ∈ [0.1, 0.3]. To reflect the highly
risk-averse attitude of the decision-maker, parameter
α was set to 0.1. We considered a homogeneous fleet
of drones with a fully charged battery of 0.27 KW /h,
payload capacity of 1 kg, where the drone speed is set
to 43.2 km/h (12 m/s). Other drone-related features
are as follows:
Synchronized Drone and Truck Routing Problem: A Multi-Stakeholder Perspective
335
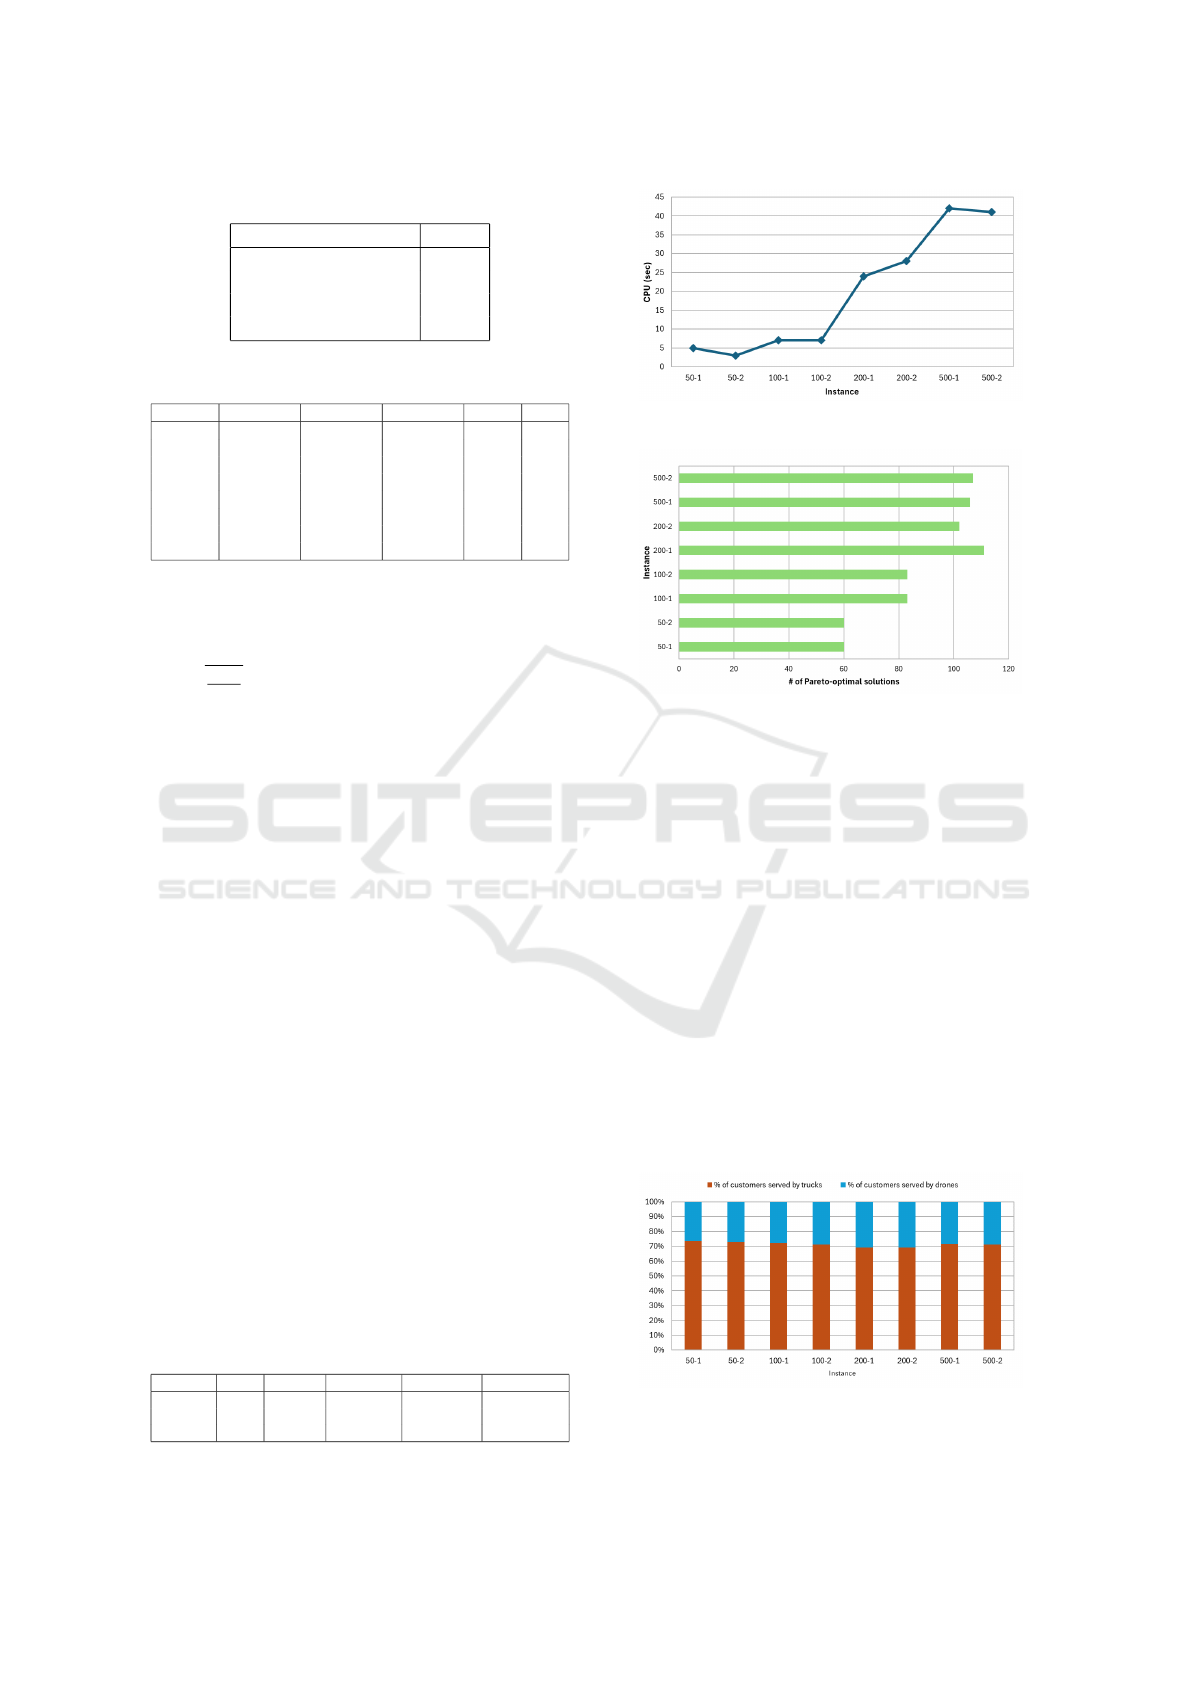
Table 2: Parameter settings.
Parameter Value
Population size N 200
Number of iterations 250
p
crossover
0.8
p
mutation
0.5
Table 3: Computational results.
Instance TP TL TTD TNDT CPU
50-1 28931.9 80008.2 184046.9 3.5 5
50-2 32039.7 96638.0 209477.7 3.6 3
100-1 89579.3 165380.7 325997.0 5.2 7
100-2 74263.8 159259.4 299150.4 4.4 7
200-1 316691.3 363168.8 634370.7 8.5 24
200-2 330863.0 429824.7 701401.6 8.2 28
500-1 1484141.8 2525309.0 3915138.7 11.2 42
500-2 1573664.9 2388172.2 4185311.2 12.9 41
TP: Total Profit, TL: Total Latency, TTD: Total Traveled
Distance, TNDT: Total Number of Dispatched Trucks.
The drone frame and battery mass are both equal to
1.5 kg, constant k
′
was calculated as a function of
k
′
=
q
g
3
2ρξ h
where the gravity g is set to 9.81 (N/kg),
the fluid density of air ρ is set to 1.204kg/m
3
; the area
of spinning blade disc ξ is 0.0064 m
2
and each drone
has eight rotors h = 8. For all instances, we set a fleet
of five trucks and two drones. The truck speed was
set to 29.88 km/h and the capacity of trucks depen-
dent on the instance were set as the eighty percent of
total demands divided by the size of terrestrial fleet.
Also, the travel distance between nodes i and j across
arc (i, j) is calculated following the Euclidean norm.
Other algorithm-related parameter settings are as re-
ported in Table 2.
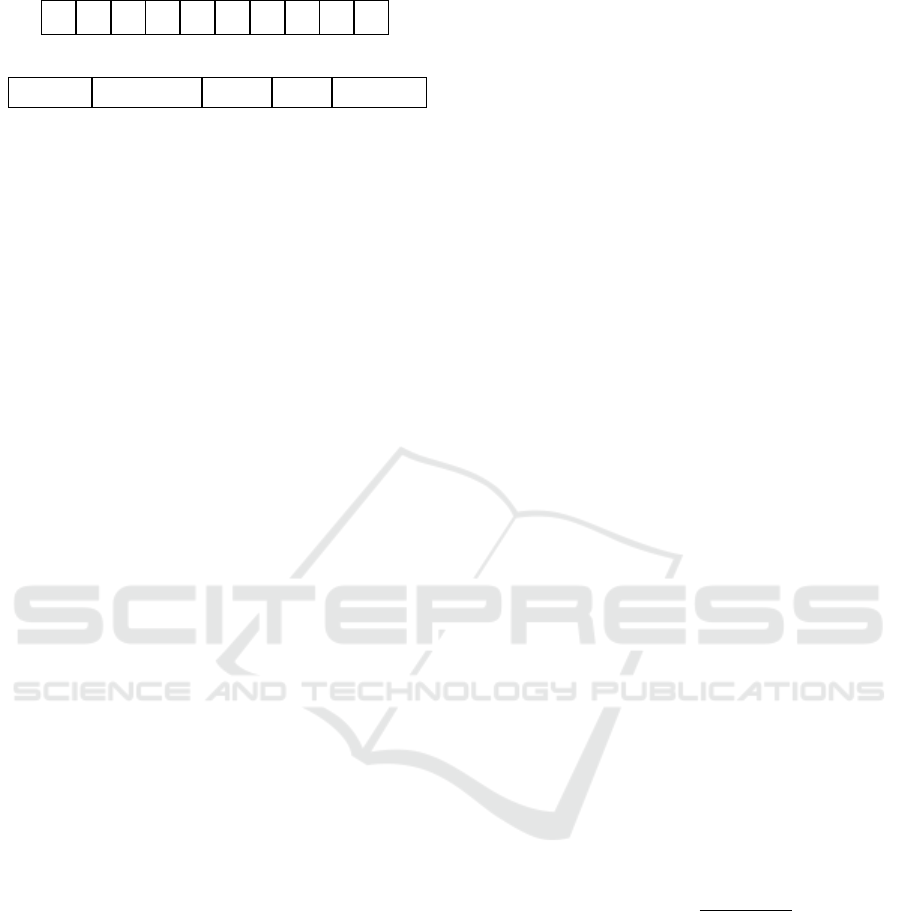
Table 3 reports the average of best results within
three random executions for each objective (Columns
2-5). Column 6 presents the algorithm CPU time
in seconds. Figure 3 displays the algorithm compu-
tational time in seconds confirming the high perfor-
mance of NSGA-II. Also, as expected, with the in-
crease in problem size, the computational time also
increases. Figure 4 illustrates the number of Pareto-
optimal solutions found by the algorithm for each
instance. We observe that the size of approximate
Pareto-optimal set increases with the increase in the
number of customers. This also justifies the increase
in the computational time since provides the decision-
maker with more choices.
In order to present some insights on the impact
Table 4: Sensitivity analysis with respect to the problem
size.
Instance ∆|V
′
| ∆ Profit ∆ Latency ∆ Distance ∆ Fleet Size
100 2.0 2.7 -1.9 -1.6 -1.4
200 4.0 10.6 -4.5 -3.4 -2.4
500 10.0 50.2 -28.1 -20.6 -3.4
Figure 3: NSGA-II: Computational time.
Figure 4: NSGA-II: Number of Pareto-optimal solutions.
of problem size (in terms of number of customers)
on the problem objectives, we consider the two cases
with 50 customers as the baseline and report the ratio
of change (depicted by ∆. in Table 4) with respect to
each criterion for cases with more than 50 customers.
For example, the value of 50.2 in the last row indi-
cates that the total profit of the logistics manager is
multiplied 50 times as the size of customers increase
from 50 to 500. The ratio of changes in the fleet size
in also low while the increase in total traveled dis-
tance and latency criteria remains acceptable. This
shows that it is beneficial for the logistics stakeholder
to enlarge the business size and service area.
Figure 5 illustrates the percentage of customers
served by drones and trucks for each instance, verify-
ing that no matter what the problem size is, on average
around 70% of customers are served by the trucks.
In order to better understand the relation among
Figure 5: Percentage of customers served by trucks and
drones.
ICORES 2025 - 14th International Conference on Operations Research and Enterprise Systems
336
different criteria (in terms of harmony or conflict),
Figure 6 visualizes the trade-off among the Pareto-
optimal solutions for all cases, thanks to the chord
chord diagram Koochaksaraei et al. (2017). We
should clarify that ob j0, ob j1,ob j2, ob j3, respec-
tively, correspond to the profit, total traveled distance,
latency, and the fleet size objectives. Our first obser-
vation is on the conflict of the profit criterion with the
latency and travel distance objectives supported by
links in the end (first) point of the Ob j0 connected to
the first (end) points of Ob j1, Ob j2, and ob j3 and that
makes sense since higher profit gains require, serv-
ing more customers, and this requires traveling more
distance, increasing the waiting time of customers,
and of course more vehicles. In addition, the pres-
ence of many links between the end (first) points of
the Ob j0 and Ob j2 shows that there is a strong con-
flict with the profit and traveled distance. In general,
we observe a harmony among the all objectives, but
the profit. Fortunately, there are links connecting the
middle middle bound of each objective and such area
is dense enough confirming the possibility to find a
trade-off among all objectives. Last but not least, we
observe that the chord diagrams gets denser with the
increase of the number of customers that is quite rea-
sonable since in general we expected with the increase
of problem size, the number of Pareto-optimal solu-
tions increase. This means that the decision-maker
has more choices to select among. We should em-
phasize that in all cases, almost all the points on red
arches are fully covered and connected by some links
to other points in other arches. This also confirms the
diversity of solutions and the fact that the objective
range (feasible region) is covered appropriately.
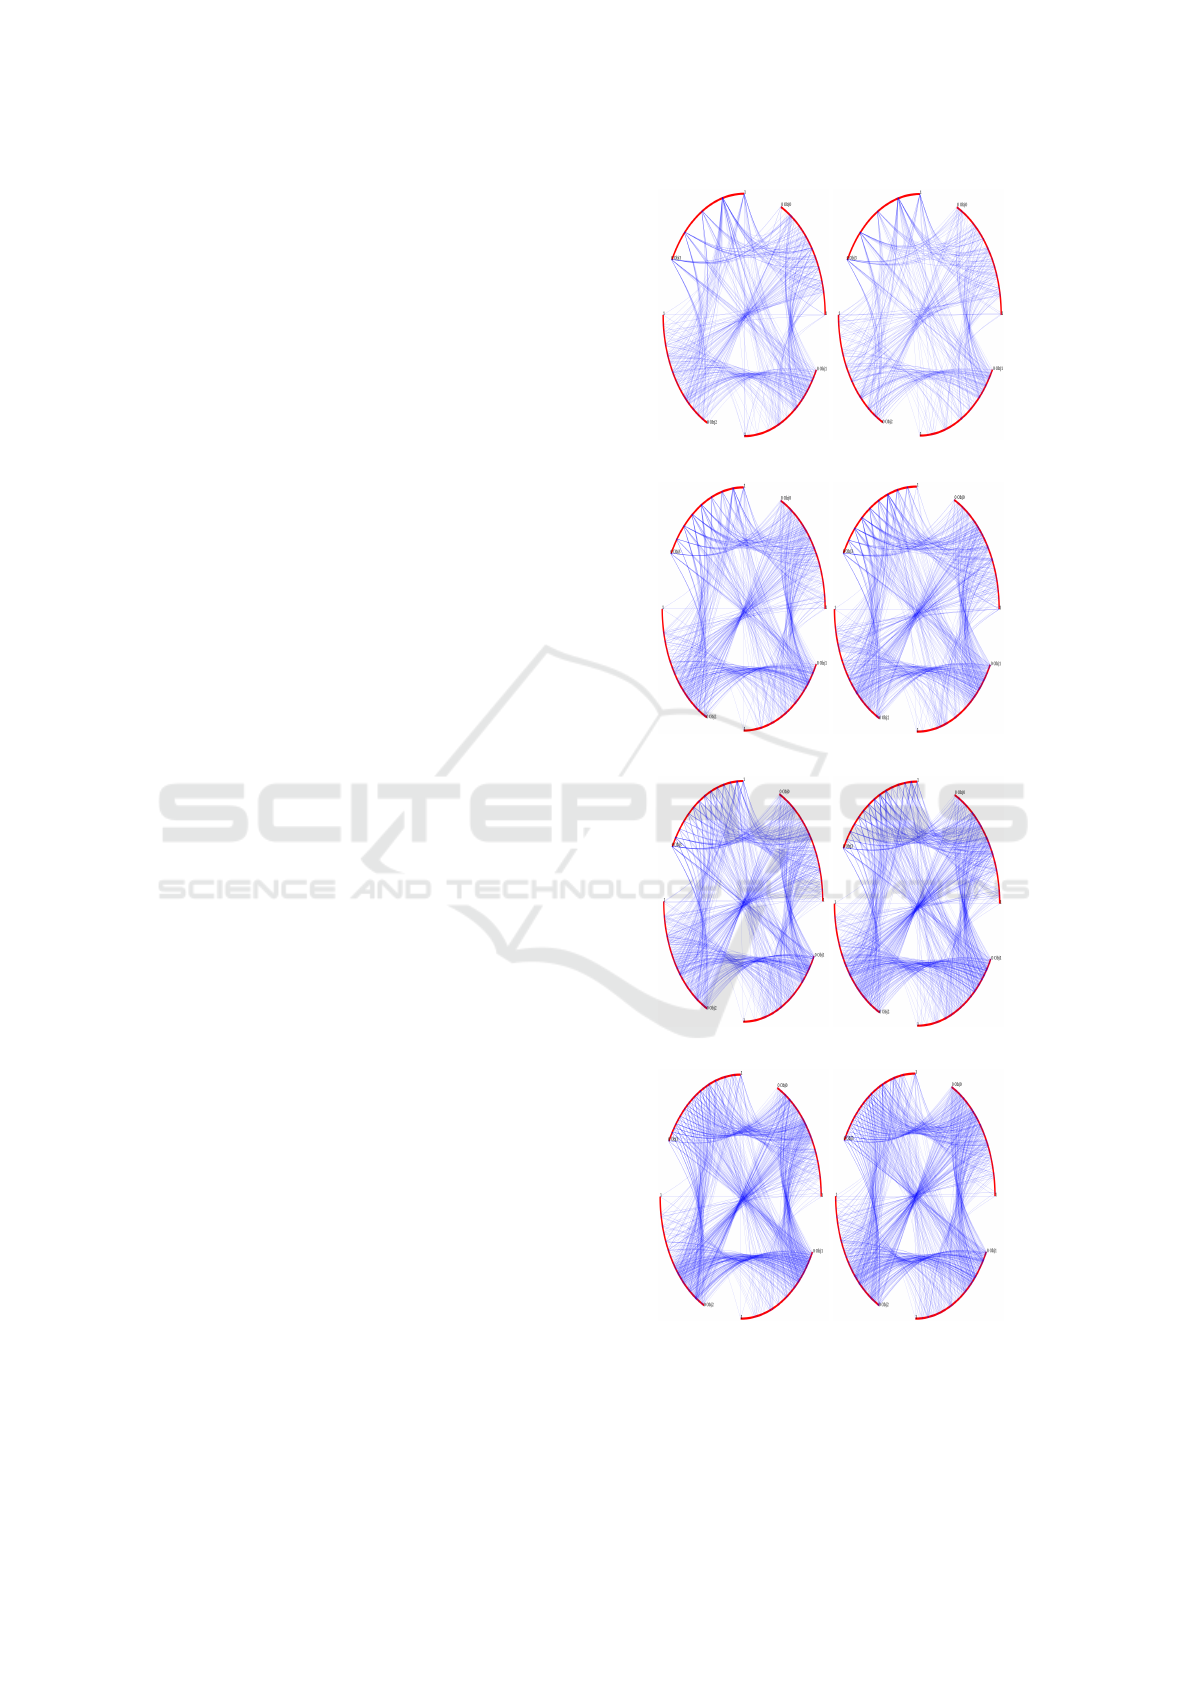
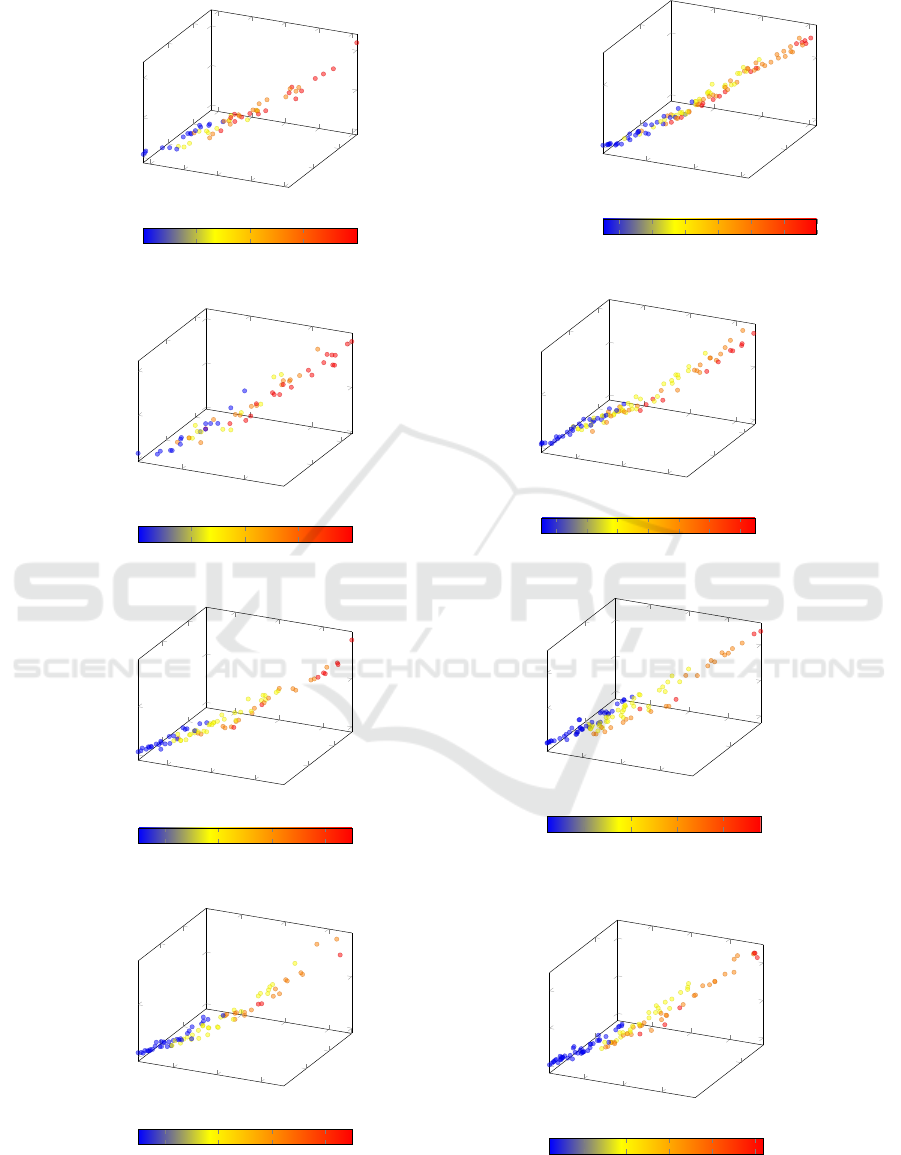
In Figure 7, we illustrate the Pareto-optimal fron-
tier as a three-dimensional scatter plot, where the
color of each point, mapped into the color bar, refers
to the forth objective. We can see that there are plenty
of solutions in the middle of the three-dimensional
plot which are colored in Yellow and Orange that cor-
respond to those solutions in which all objectives are
more or less balanced. The density of the solutions
and its wide coverage are promising results, confirm-
ing the efficiency and validity of the NSGA-II for the
proposed model.
6 CONCLUSIONS
In this paper, we studied the synchronized last-mile
delivery problem under a joint and collaborative sys-
tem consisting of terrestrial and sidekick aerial vehi-
cles. This novel variant, requiring the timing synchro-
nization between drone and truck, can be classified as
(a) 50-1 (b) 50-2
(c) 100-1 (d) 100-2
(e) 200-1 (f) 200-2
(g) 500-1 (h) 500-2
Figure 6: Visualization of the relation among objectives:
chord diagram.
Synchronized Drone and Truck Routing Problem: A Multi-Stakeholder Perspective
337
1
2
3
4
5
·10
4
1
2
·10
5
0
2
4
·10
5
Ob j0
Ob j 1
Ob j 2
Ob j 3
1 2 3 4
5
(a) Instance 50-1
2
4
·10
4
·10
5
0
2
4
·10
5
Ob j0
Ob j 1
Ob j 2
Ob j3
1 2 3 4
5
(b) Instance 50-2
0.5
1
1.5
·10
5
2
4
·10
5
0
5
·10
5
Ob j0
Ob j 1
Ob j 2
Ob j3
2 4
6
8
(c) Instance 100-1
0.5
1
1.5
·10
5
2
4
6
·10
5
0
5
·10
5
Ob j0
Ob j 1
Ob j 2
Ob j3
2 4
6
8
(d) Instance 100-2
2
4
6
·10
5
5
·10
5
0
1
·10
6
Ob j0
Ob j 1
Ob j 2
Ob j3
2 4
6
8 10 12 14
(e) Instance 200-1
2
4
6
·10
5
0.5
1
·10
6
0
1
·10
6
Ob j0
Ob j 1
Ob j 2
Ob j3
2 4
6
8 10 12 14
(f) Instance 200-2
1
2
3
·10
6
5
·10
6
0
0.5
1
·10
7
Ob j0
Ob j 1
Ob j 2
Ob j3
5
10
15
20
(g) Instance 500-1
1
2
3
·10
6
5
·10
6
0
0.5
1
·10
7
Ob j0
Ob j 1
Ob j 2
Ob j3
5
10
15
20
25
(h) Instance 500-2
Figure 7: Scatter plot representing the Pareto-optimal frontier in 4D.
ICORES 2025 - 14th International Conference on Operations Research and Enterprise Systems
338

a synchronized version of parallel drone scheduling
vehicle routing problem. We formulated the prob-
lem as a multi-objective model involving both busi-
ness and customer-oriented goals and developed an
evolutionary-based meta-heuristic approach to solve
the model. The efficiency of the solution approach
was investigated through computational experiments
carried out on different instances adopted from the
benchmark. Several interesting research avenues are
open for further investigation. One relates to the de-
sign of exact solution methods or matheuristics and
compares the solutions of such methods with those
presented in this study. Another interesting research
topic could be focused on the extension of the present
model to the case where drones can serve more than
one customer per trip or being retrieved at arbitrary
locations besides customer sites.
ACKNOWLEDGEMENTS
The second author is supported by PNRR project
NEST “Network4EnergySustainableTransition”-
PE00000021.
REFERENCES
Arnold, K., Gosling, J., and Holmes, D. (2005). The
Java programming language. Addison Wesley Pro-
fessional.
Calafiore, G. C. and Ghaoui, L. E. (2006). On distribu-
tionally robust chance-constrained linear programs.
Journal of Optimization Theory and Applications,
130(1):1–22.
Deb, K., Pratap, A., Agarwal, S., and Meyarivan, T. (2002).
A fast and elitist multiobjective genetic algorithm:
Nsga-II. IEEE Transactions on Evolutionary Compu-
tation, 6(2):182–197.
DellAmico, M., M. R. . N. S. (2020). Matheuristic al-
gorithms for the parallel drone scheduling traveling
salesman problem. Ann Oper Res, 289:211–22.
Dewilde, T., Cattrysse, D., Coene, S., Spieksma, F., and
Vansteenwegen, P. (2013). Heuristics for the traveling
repairman problem with profits. Computers & Opera-
tions Research, 40(7):1700–1707.
Ham, A. M. (2018). Integrated scheduling of m-truck,
m-drone, and m-depot constrained by time-window,
drop-pickup, and m-visit using constraint program-
ming. Transportation Research Part C: Emerging
Technologies, 91:1–14.
Kim, S. and Moon, I. (2019). Traveling salesman problem
with a drone station. IEEE Transactions on Systems,
Man, and Cybernetics: Systems, 49(1):42–52.
Koochaksaraei, R. H., Meneghini, I. R., Coelho, V. N.,
and Guimar
˜
aes, F. G. (2017). A new visualization
method in many-objective optimization with chord di-
agram and angular mapping. Knowledge-Based Sys-
tems, 138:134–154.
Lam, H. (2019). Recovering best statistical guarantees
via the empirical divergence-based distributionally ro-
bust optimization. Operations Research, 67(4):1090–
1105.
Mbiadou Saleu, R. G., Deroussi, L., Feillet, D., Grangeon,
N., and Quilliot, A. (2018). An iterative two-step
heuristic for the parallel drone scheduling traveling
salesman problem. Networks, 72(4):459–474.
Moshref-Javadi, M., Hemmati, A., and Winkenbach, M.
(2020a). A truck and drones model for last-mile de-
livery: A mathematical model and heuristic approach.
Applied Mathematical Modelling, 80:290–318.
Moshref-Javadi, M., Lee, S., and Winkenbach, M. (2020b).
Design and evaluation of a multi-trip delivery model
with truck and drones. Transportation Research Part
E: Logistics and Transportation Review, 136:101887.
Murray, C. C. and Chu, A. G. (2015). The flying sidekick
traveling salesman problem: Optimization of drone-
assisted parcel delivery. Transportation Research Part
C: Emerging Technologies, 54:86–109.
Perboli, G. and Rosano, M. (2019). Parcel delivery in ur-
ban areas: Opportunities and threats for the mix of
traditional and green business models. Transportation
Research Part C: Emerging Technologies, 99:19–36.
Zhang, J., Campbell, J. F., Sweeney II, D. C., and Hupman,
A. C. (2021). Energy consumption models for deliv-
ery drones: A comparison and assessment. Trans-
portation Research Part D: Transport and Environ-
ment, 90:102668.
Synchronized Drone and Truck Routing Problem: A Multi-Stakeholder Perspective
339
