
Using LMS Records to Track Student Performance:
A Case of a Blended Course
Marko Matus
a
, Josipa Bađari
b
and Igor Balaban
c
Faculty of Organization and Informatics, University of Zagreb, Pavlinska 2, 42000 Varaždin, Croatia
Keywords: LMS Logs, Student Performance, Educational Data Analysis, Blended Course.
Abstract: This paper explores the use of Learning Management System (LMS) logs to analyse student performance in
a blended course. The study aims to identify how LMS data can inform teaching strategies and intervention,
focusing on which variables most influence students’ performances. The course was designed using Moodle,
incorporating programmed learning, conditional activities, and assessments like quizzes, flash tests, and self-
assessments.
Data on students' activities, including access logs, quiz scores, and final grades, were collected and analysed.
The results show that students with higher LMS activity, particularly those who completed more self-
assessments and engaged consistently, tended to perform better. However, while self-assessment activities
increased engagement, they had a weaker correlation with final grades compared to midterm exams and flash
tests. A strong positive correlation was found between midterm exam performance and final grades,
highlighting the importance of these assessments for course success. The study suggests that LMS logs can
be a useful tool for teachers to monitor student behaviour and to implement timely interventions to support
struggling students.
1 INTRODUCTION
The extensive adoption of Learning Management
Systems (LMS) in educational institutions has
generated vast amounts of data regarding student
interactions and behaviors during online and blended
courses. These systems record logs of various aspects
of student activities, such as the specific resources
accessed, the timing of these interactions, and in
general, the duration of their engagement with the
variety of resources and activities within LMS. As
teachers increasingly rely on these systems, the
imperative to harness this data for enhancing student
learning outcomes becomes very important in
teaching practice.
The necessity of using LMS data is underscored
by research exploring a deeper understanding of
students' learning contexts and behaviors. Ferguson
(2012) emphasizes the importance of analyzing these
data to optimize learning environments and
processes. Ryabov (2012) demonstrates a positive
a
https://orcid.org/0009-0009-1254-4957
b
https://orcid.org/0009-0003-1289-6748
c
https://orcid.org/0000-0002-4367-9629
correlation between the overall time logged within an
LMS and final academic performance, while Nguyen
(2017) finds significant associations between student
engagement metrics, such as page views and
discussion posts, and learning outcomes.
Furthermore, Wei et al. (2015) explored the impact of
various online activities on academic success,
highlighting the need for teachers to engage with
LMS analytics to foster improved student
performance. The potential of using such data is also
highlighted by studies emphasizing their role in
improving retention rates, predicting performance,
and identifying students at risk of underachievement
(Wong, 2017).
In general, there is a growing need to further
contribute to the field of educational data analytics,
particularly within the higher education sector, where
the effective measurement and improvement of
student performance remains a pressing concern (Jha
et al., 2019). With that respect, this paper aims to
further explore how data recorded in LMS can
Matus, M., BaÄ
´
Sari, J. and Balaban, I.
Using LMS Records to Track Student Performance: A Case of a Blended Course.
DOI: 10.5220/0013217800003932
Paper published under CC license (CC BY-NC-ND 4.0)
In Proceedings of the 17th International Conference on Computer Supported Education (CSEDU 2025) - Volume 1, pages 283-290
ISBN: 978-989-758-746-7; ISSN: 2184-5026
Proceedings Copyright © 2025 by SCITEPRESS – Science and Technology Publications, Lda.
283

explain student performance by utilizing student logs
to pinpoint areas of struggle and help teachers to
implement targeted interventions.
2 BACKGROUND
Modern educational institutions use different
Learning Management Systems (LMS) to support
their teaching and learning activities. In recent years,
especially in the COVID and post-COVID era the
researchers and teachers started to realize the
importance of the analysis and use of the LMS
generated logs of teachers and students. Since data in
log files describe how its users interact and
interrelate, the information has been used to create
predictive models for different purposes such as
foreseeing student performance (Conijn et al., 2017),
detecting procrastination (Tuckman, 2005) and
clustering students (Cerezo et al., 2016).
According to Gašević et al. (2016) the prediction
of students at risk of failing a course and the
prediction of students' grades have been based on the
data stored in institutional student information
systems, trace data recorded by LMSs and other
online learning environments; and combinations of
different data sources.
Although the LMS logs have emerged as power
tools for capturing and analysing student behaviour
and the data from LMS has contributed to insights
into student learning paths and to predictions about
student performance, the use of LMS data for early
prediction of student performance is still limited (see
Rotelli, Fiorentino & Monreale; 2021; and Baginda,
Santoso & Janus; 2022). Tamada et al. (2022) used
Machine Learning techniques based on logs from the
LMS (Moodle) due to the fact that all interactions in
the LMS generate a log, which stores information in
a database, the amount of data collected is rapidly
increasing in volume and complexity, but also
allowing statistical analysis, data mining, and
building predictive models of school performance
that helps to detect students at risk.
Researching LMS student logs Kadoić & Oreški
(2018) found in their study the correlation between
the number of logs in the Moodle e-course and the
final grades and Felix et al. (2019) found that the
number of interactions with the system, attendance,
and time spent on the platform were essential
variables in predicting student outcomes. Also,
Kaensar & Wongnin (2023) study supports the idea
that student behaviour in online learning platforms
like Moodle affected student performance.
Based on the previous findings this research tries
to provide teachers with further analysis of how to use
LMS logs to identify possibilities to improve learning
design of their blended courses enabling best student
performance.
3 RESEARCH AIMS AND
METHODOLOGY
The main aim of the paper is to explore different ways
of using LMS logs to analyse students’ activities and
describe their behaviour in a blended course.
With that sense, the following research questions
are outlined:
1. In what way can student logs be used to analyse
students’ performance?
2. Which are the variables derived from the LMS
records that most influence student performance?
3. How can teachers use LMS analytics/student logs
as a predictive techniques/tools (e.g. a teacher can
identify areas where students may be struggling
and implement targeted interventions to improve
student outcomes.)
In the initial phase, the online part of the blended
course was developed based on the principles of
programmed learning within the LMS Moodle. A
range of online resources and knowledge assessments
were incorporated, along with conditional activities,
to establish a clear learning pathway for students.
Additional details regarding the programmed
learning principles, conditional activities, and the
course overall can be found in the next section.
Data on students, including their final grades were
gathered from Moodle by exporting student scores
from all quiz activities, including midterms, flash
tests, and self-assessment quizzes. Students'
engagement was obtained from course activity logs.
A Moodle log consists of the time and date it was
accessed, the Internet Protocol (IP) address from
which it was accessed, the name of the student, each
action completed (i.e., view, add, update, or delete),
the activities performed in different modules (e.g., the
forum, resources, or assignment sections), and
additional information about the action.
Following this, descriptive statistics were
employed to analyse and interpret the data.
Additionally, correlation analysis was conducted
among the main components of the dataset to identify
which variables most significantly impact student
performance.
CSEDU 2025 - 17th International Conference on Computer Supported Education
284
4 COURSE DESCRIPTION AND
PARTICIPANTS
The course "Business Informatics" is a first-semester
bachelor course of the specialist study program
"Information Technology in Business Applications"
offered at the University of Zagreb, Faculty of
Organization and Informatics in Varaždin, Croatia.
The course syllabus covers several key topics,
including an introduction to information systems and
their applications in business, a detailed exploration
of computer hardware and software (the fundamental
components of information systems), and
foundational principles of information system
security.
Delivered as a blended course, all teaching
materials and methods have been designed for such
delivery within Moodle. The topics covered in
lectures are supplemented with various online
resources, such as videos and quizzes integrated into
the Moodle. The course content is organized into a
sequence of lessons, prepared as asynchronous
materials for the online component, serving as both a
primary source of information and a mean of
reviewing topics discussed in onsite and in online
lectures.
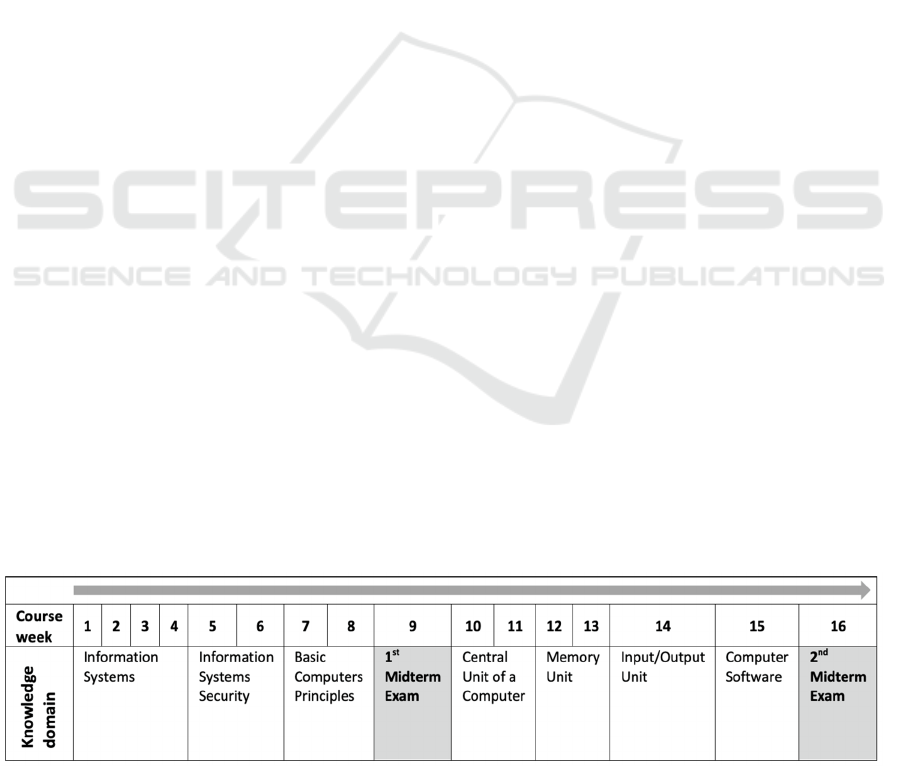
The structure of the course includes seven
knowledge domains, as shown in Figure 1, while each
knowledge domain consists of several lessons.
Each lesson ends with a short test, which students
must solve successfully to progress to the next lesson
(a part of conditional activities). Achieving the
required result in all lessons within a knowledge
domain is a prerequisite to access the final self-
assessment quiz at the end of each knowledge
domain. Such a learning path was implemented as a
completion tracking and conditional activities feature
in Moodle. It enables teachers to specify when a
certain activity shall be hidden or enabled for students
according to the planned course design.
Since the students took the self-assessments
outside the class as an optional activity, those results
are not included in their final grade. They are
designed as a student self-monitoring activity
opposite to the formal online midterm exams which
are obligatory and conducted within the Moodle
course. A total of two midterms are performed: the
first in the middle of the semester (Week 8) including
knowledge domains 1 and 2 and the second in the
final week (Week 16) including all knowledge
domains.
Besides the formal tests and self-assessments,
students are also given short flash-tests during
lectures, as warm-up activities covering the content
from the previous domain knowledge. In total, 4-5
flash-tests are provided during the semester.
Students’ final grades are created based on their
results from flash tests, 1st midterm and the 2nd
midterm exam.
During the 2023/2024 academic year, a total of
117 students were enrolled in the course. At the end
of the 16th week a total of 99 students (84.6%)
finished the course out of which 31 were female
students (31.3%) and 68 male students (68.7%).
To analyse students' performance and identify
areas where they may be struggling during the course,
as well as to implement targeted interventions with
the goal of improving student outcomes, the student
activity logs and their scores were exported and
processed
.
5 RESULTS
The dataset used in this paper was collected during
the first semester of academic year 2023/2024. Since
the course was delivered in blended mode, students
were required to complete part of the activities (e.g.,
view, add, update…) off campus - through LMS (e.g.,
forum posts, self-assessments, lessons completed…).
Since the LMS automatically stored a lot of activity
logs during the course about every student enrolled,
they were exported as a datasheet after the course had
ended. More than 330000 activity logs were exported
Figure 1: Organization of the course across knowledge domains and weeks.
Using LMS Records to Track Student Performance: A Case of a Blended Course
285
for all students enrolled. After the data wash, a total
of 277899 activity logs were prepared for further
analysis within a pivot table including the columns
“Student ID”, “Date and time”, “LMS Module
(Lesson, Forum, Test…)”, “Final Grade Course”,
“Week of the Course” and “Class attendance” that
were analysed.
Furthermore, to analyse the relationship between
monitored activities/objectives, data on the results for
each individual student (based on “Student ID”) were
exported to the new datasheet and later processed in
SPSS Statistics (version 29.0.0.0). The monitored
activities/objectives included: “1st Midterm Exam”,
“2nd Midterm Exam”, “Flash tests”, “Self-
assessment quiz”, “Class attendance”, “Number of
logs” and “Final grade”.
The analysis was started by reviewing the
distribution of logs per week which include access to
lessons, self-assessment attempts, flash tests and
forum views (see Figure 2).
Figure 2: Distribution of logs per week.
It can be noted that the peaks in the graph occur in
four stages of the course: the 5th, 8th, 13th, and 15th
week, when course activity is particularly intensive.
The increases in activities during the 5th and 13th
weeks are linked to the assessments of practical
assignments. Notably, student activities rise steadily
until the 5th week, when their knowledge from the
practical assignments is assessed, before dropping
sharply in the 6th week.
Additionally, there is a noticeable increase in
student preparation between the 7th and 8th week,
coinciding with the schedule of the midterm exam. In
the 13th week, students face a second assessment for
the practical assignments, but this time, there is no
significant drop in activity. In fact, student
engagement is higher during these second practical
assignments compared to the first. A significant
increase in student activity is also noted in the 13th
week, as students prepare for the second midterm
exam and complete any remaining course tasks.
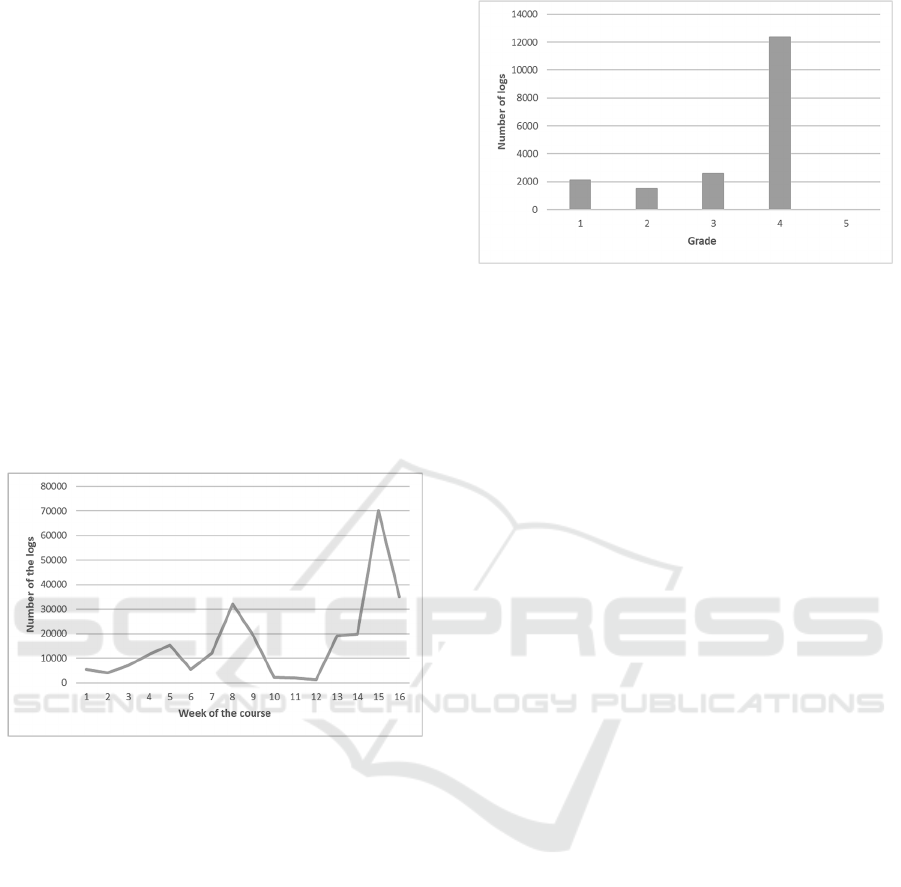
Figure 3: Frequency of logs by grade.
Regarding online activity and final grades, Figure
3 which indicates overall number of logs per grade,
reveals that students with the highest grades were also
the most active in the LMS, recording over 12,000
logs - significantly more than students with lower
grades In Croatia, the grading system ranges from 1
(lowest/fail) to 5 (highest/excellent), but there were
no students in the analysed semester achieving the
highest grade within LMS (chart displays grades 1
and 4, with the size of the populations 29 (1)-42 (2)–
24 (3)–5 (4). It is important to note that in this blended
course, the activity levels of students with lower
grades (1-3) do not differ significantly. This suggests
that, based on their access to resources, it is not
possible to predict their final results, except for the
most active ones. Students who did not meet the
requirements for a grade continuously throughout the
semester were not taken into account.
However, a different conclusion can be made if
we take a closer look at the distribution of activities
related to self-assessment quizzes for each course
week presented in Figure 4. Over the 16-week period,
the activity levels of all students are generally low for
the most weeks, with increased activity around weeks
8 and 15 when midterms are taking place. It is evident
that students with lowest grades exhibited minimal
activity in the early weeks, with a slight increase in
week 8 and in week 15, reaching an average of 3.5
self-assessment tests completed per student (out of 7).
Students with grade 2 demonstrated somewhat better
activity, particularly around week 8, and significantly
increased their self-assessment completion by week
15, similar to students with a grade of 3 (averaging 6
out of 7).
Interestingly, students with grade 3 had similar
activity levels to those with grade 4 around week 8,
indicating that they have completed both self-
assessment quizzes covering the material for the first
midterm exam. However, the most notable difference
among the grades appears in week 15, when grade 4
CSEDU 2025 - 17th International Conference on Computer Supported Education
286
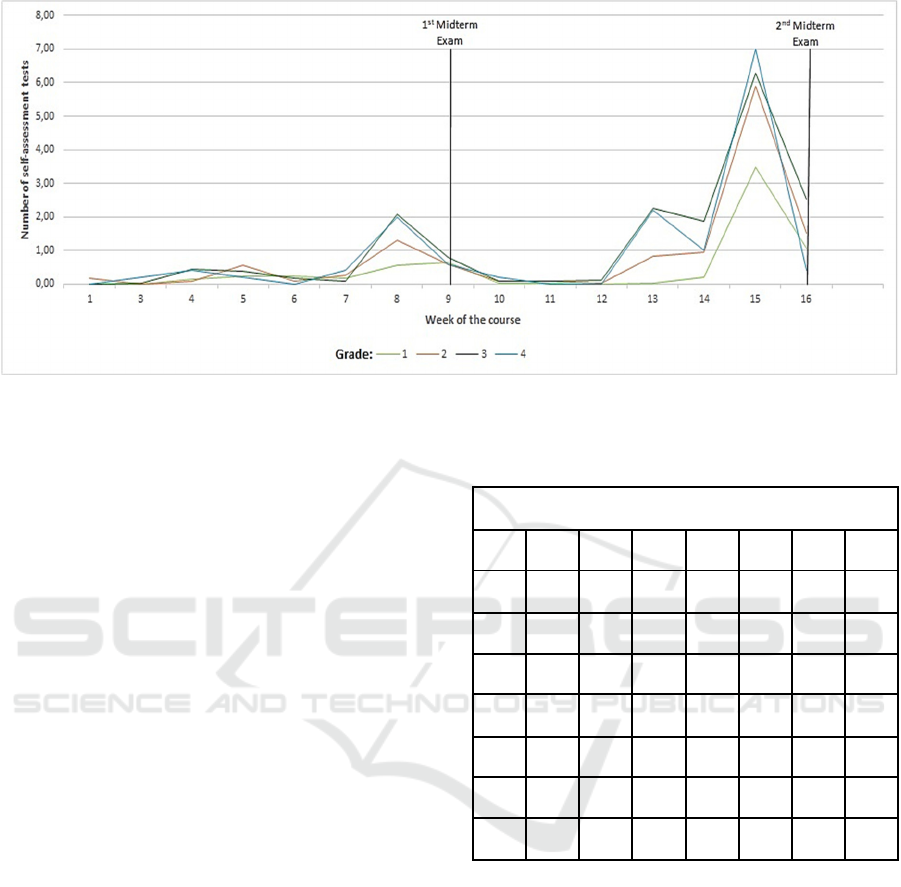
Figure 4: Self-assessment test activity based on student grades.
students completed all 7 self-assessments, while
grade 3 students averaged around 6, suggesting that
most grade 3 students did not complete all of the self-
assessments.
During the course, a total of 7 self-assessment
quizzes were available as shown in Figure 5. As
mentioned earlier, the first midterm exam included
domains 1 and 2, "Information systems” and
“Information Systems Security” respectively.
Students have started completing the first self-
assessment quiz in the 3rd week, with the highest
number of attempts in the 8th week, during the
preparation for the midterm exam.
It can also be observed that students continued
working on the first two self-assessments until the
end of the semester, particularly as preparation for the
second midterm exam, basically since the second
midterm exam included some questions from the first
two knowledge domains. Although the first of the
remaining self-assessments was available from the
7th week, it can be noted that students learned
“periodically”, having activity peaks only around
midterm periods. This is also supported by the fact
that students started accessing self-assessments in the
13th week as a way of preparation for the second
midterm.
Finally, the last part of analysis refers to
reviewing the correlations between the monitored
activities/objects. The correlation matrix in Table 1
shows several significant relationships between
various factors that contribute to monitoring student
performance.
Since the Final grade is calculated as the sum of
the points earned on the 1st and 2nd Midterm exams,
Flash tests, and the Self-assessment quiz, a strong
Table 1: Correlation matrix between factors that contribute
to monitor student success.
Correlations
1ME 2ME FT SAQ CA NL FG
1ME 1 0,396
1
0,274
1
0,275
1
-0,063
0,366
1
0,709
1
2ME 0,396
1
1 0,283
1
0,040 -0,040 0,128 0,773
1
FT 0,274
1
0,283
1
1 0,160 -0,068 0,211
2
0,311
1
SAQ 0,275
1
0,040 0,160 1 -0,068
0,595
1
0,241
2
CA -0,063 -0,040 -0,068 -0,068 1 0,042 -0,021
NL 0,366
1
0,128 0,211
2
0,595
1
0,042 1 0,352
1
FG 0,709
1
0,773
1
0,311
1
0,241
2
0,021
0,352
2
1
1
Correlation is significant at the 0.01 level,
2
Correlation is
significant at the 0.05 level
Explanation: 1st Midterm exam (1ME), 2nd Midterm exam
(2ME), Flash tests (FT), Self-assessment quiz (SAQ),
Class attendance (CA), Number of logs (NL), Final grade
(FG)
positive correlation between the 2nd midterm exam
and the final grade (r = 0,773, p=0,01), predicting that
the performance on the 2nd midterm exam is the key
predictor in achieving success in the course. Also, the
midterm exams show strong positive correlation with
final grade, which indicates the importance of the 2
major assessments as a key component in achieving
overall success in the course. Moderate positive
correlation was found between flash tests and the
Using LMS Records to Track Student Performance: A Case of a Blended Course
287
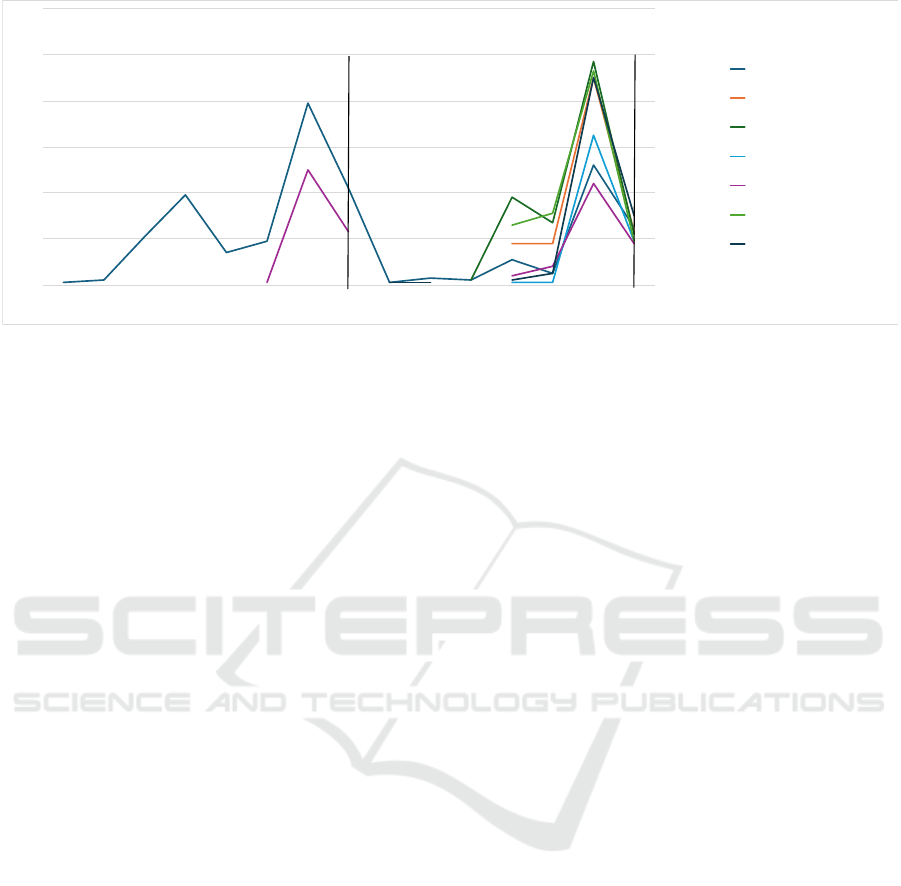
Figure 5: Self-assessment quiz attempts per week of the course.
final grade (r=0,311, p=0,01) which indicates that
active student engagement (flash tests were solved
during lessons) have a moderate impact in achieving
positive final grade. Also, the number of logs which
indicates an overall number of logs per student, and
final grade have a moderate positive correlation
(r=0,352, p=0,01). Although the self-assessment quiz
demonstrated a strong correlation with the number of
logs (r = 0,595, p = 0,01), correlation to the final grade
was weaker (r = 0,241, p = 0,05). This suggests that
although the self-assessment activities may
encourage higher levels of engagement, they do not
necessarily lead to improved final grades directly.
6 DISCUSSION
Re RQ1 discussing in what way can student logs be
used to analyse students’ performance it is evident
that in a blended environment, where students
alternate between face-to-face and online teaching
and learning, LMS logs can help teachers to identify
how well students are balancing both delivery modes.
These logs capture activities like lesson access, quiz
attempts, participation in forums, and interactions
with learning materials, providing a comprehensive
view of students’ online learning behaviour.
However, some additional tracking elements are
needed to capture their face-to-face activity, as in this
case we used class attendance and flash-tests written
during face-to-face lectures. Besides these
information, the teacher gets clear insight about the
student time management (when do students usually
approach specific resources) and after the 1st midterm
they are able to identify potentially at-risk students.
They are also able to note which parts of the course
content are visited more frequently than others, and
which ones might not be visited at all, leading them
to revise those materials or the course requirements.
The analysis of LMS logs allows teachers to track
student progress and intervene early to support
students in need. In the case of a blended course, it is
important to note that the number of logs may not
reflect real student engagement and knowledge. The
data in this example showed a very slight difference
in the number of logs between students with final
grades 1 to 3. However, the self-assessment activity
is notably different for students with different final
scores/grades, which is fully in line with study from
Schön (2022) who has also shown that completion
rates of online quizzes can predict final exam
performance.
Re RQ2 aimed at identifying the variables that
most influence the students’ performance using
course-agnostic LMS log data, the correlation matrix
in the results reveals that midterm exam performance
and the number of logs are significant predictors of
final grades, highlighting research that demonstrates
the predictive power of LMS data in early
identification of students at risk of underperformance
(Gašević et al., 2016; Tamada et al., 2022).
Based on the analysis of correlations, several
variables have been identified as influential on
student performance:
1. Number of Logs: The overall number of
interactions in the LMS has been shown to correlate
with higher grades. This is also supported by Kadoić
& Oreški (2018) who found a positive relationship
between the number of Moodle log entries and final
grades, indicating that students who frequently
engage with course content tend to perform better.
Such finding is also supported by other studies (e.g.
Conijn et al., 2017; Baginda et al. 2022) where LMS
log frequency was shown to be a common indicator
of performance.
0
20
40
60
80
100
120
1345678910111213141516
Number of self-assessment quiz attempts
Week of the course
Knowledge Domain: Information
Systems
Knowledge Domain: Memory
Unit
Knowledge Domain: Basic
Computers Principles
Knowledge Domain: Computer
Software
Knowledge Domain: Information
Systems Security
Knowledge Domain: Central Unit
of a Computer
Knowledge Domain:
Input/Output Software
1
st
Midterm
Exam
2
nd
Midterm
Exam
CSEDU 2025 - 17th International Conference on Computer Supported Education
288

2. Engagement in Self-Assessment Quizzes:
In the given study, students with higher grades
consistently completed more self-assessment quizzes,
especially around midterm periods. Although self-
assessment quizzes were highly correlated with
overall activity (r = 0,595), they had a lower direct
correlation with final grades, suggesting that while
they might boost engagement, they may only
indirectly influence performance.
3. Participation in Flash Tests: Flash tests,
as mandatory, but brief in-course assessments, have a
positive relationship with final grades (r = 0,311),
highlighting the impact of frequent, low-stakes
testing on learning outcomes. Rotelli, Fiorentino &
Monreale (2021) suggested that these micro-
assessment engagements are valuable for reinforcing
material and maintaining consistent engagement,
which contributes to better academic outcomes.
4. Midterm scores: The scores from
structured assessments showed the strongest
correlation with final grades, especially the 2nd
midterm (r = 0,773). This aligns with Gašević et al.
(2016), who found that scores on significant
assessments derived from LMS logs are critical
predictors of final performance. This variable acts as
a summative reflection of students’ knowledge and
learning throughout the course, meaning that based
on the 1st midterm the teachers could detect failing
students.
5. Course Material Access and Forum
Participation: This research has found a moderate
correlation between access to materials and forums
and the final grade. That might be related to the fact
that some students had printed materials and were not
assessing LMS. A positive relationship between
access to materials and final grade was also supported
by Baginda et al. (2022) who identified that accessing
core LMS features, such as course materials,
assignments, and forums, was strongly associated
with higher grades. Regular interaction with these
resources suggests proactive learning and
engagement with course content. This is consistent
with the findings of Li et al. (2018), who emphasized
that students who frequently interact with learning
resources and engage in forums demonstrate higher
levels of comprehension and academic performance.
The last interesting finding in respect to RQ2 in
this research revealed that course participation does
not affect student performance, which is probably
related to the fact that students were required to attend
at least 65% of face to face lectures.
Re RQ3 aimed at identifying areas where teachers
can use LMS logs to enable better student
performance this research highlights that students
with higher activity levels, such as frequent self-
assessment attempts and access to resources,
generally achieved better grades. By monitoring these
logs, teachers can detect early signs of
underperformance, such as a lack of engagement
before assessments, and intervene accordingly. This
is supported by research from Gašević et al. (2016)
and Tamada et al. (2022), which emphasize the use of
LMS data for predicting at-risk students. Predictive
models based on these logs can enable teachers to
offer timely support, such as additional resources or
feedback, improving students’ chances of success. As
seen, more interactive materials (self-assessments,
flash-tests…) could provide students with more
opportunities to self-test and perform better and
teachers with more data for analytics and prompt
reaction and course redesign.
Within the context of this course, where around
30% of students fail the course during the continuous
monitoring, the conclusions provide teachers with the
clear guidelines on how to redesign and when to react
and provide students with more stimuli to
successfully conclude the course. Further analysis of
the student feedback on course delivery, content and
available (self-)assessment options will enable deeper
analysis and improvements of the course.
7 CONCLUSION
This study, conducted in an institution with limited
resources, sought to identify patterns in student
engagement and performance using LMS log data.
The results demonstrate the viability of using
accessible and affordable methods for monitoring
student progress in a blended learning environment.
Key findings show that the majority of student
activity is concentrated around major assessments, as
well as support the fact that the students who engage
more consistently within LMS are also generally
performing better. However, while self-assessment
activities correlated with higher levels of
engagement, they did not strongly predict final
grades.
Importantly, this study confirms the potential for
institutions to leverage existing data to provide timely
feedback for students at risk of underperforming,
allowing for interventions such as adjusted teaching
methods or additional assignments tailored to both
advanced and struggling students. These findings can
help teachers make predictions for upcoming
semesters, offering live recognition of both at-risk
and high-achieving students. Since this was one of the
first courses where students interacted with LMS
Using LMS Records to Track Student Performance: A Case of a Blended Course
289

since entering higher education, the implications of
this research can be beneficial to other teachers,
potentially yielding long-term positive effects for
students across the study programme.
To further support educators in applying these
findings, we recommend the integration of automated
alerts within the LMS platforms to identify and notify
students at risk based on engagement metrics.
Future research could explore student
perspectives by incorporating surveys,
complementing the log data with qualitative insights
into student experiences and engagement. Analysing
students’ perceptions of course components,
perceived workload, and their reasons for
engagement patterns could provide insights to refine
predictive models and develop more effective
teaching interventions.
ACKNOWLEDGEMENTS
This work has been fully supported by the Croatian
Science Foundation under the project IP-2020-02-
5071.
REFERENCES
Cenka, B. A. N., Santoso, H. B., & Junus, K. (2022).
Analysing student behaviour in a learning management
system using a process mining approach. Knowledge
Management & E-Learning, 14(1), 62-80.
Cerezo, R., Sánchez-Santillán, M., Paule-Ruiz, M. P., &
Núñez, J. C. (2016). Students' LMS interaction patterns
and their relationship with achievement: A case study
in higher education. Computers & Education, 96, 42-
54.
Conijn, R., Snijders, C., Kleingeld, A., & Matzat, U.
(2016). Predicting student performance from LMS data:
A comparison of 17 blended courses using Moodle
LMS. IEEE Transactions on Learning Technologies,
10(1), 17-29.
Felix, I., Ambrosio, A., Duilio, J., & Simões, E. (2019,
February). Predicting student outcome in moodle. In
Proceedings of the Conference: Academic Success in
Higher Education, Porto, Portugal (pp. 14-15).
Ferguson, R. (2012). Learning analytics: drivers,
developments and challenges. International Journal of
Technology Enhanced Learning, 4, 304–317.
Gašević, D., Dawson, S., Rogers, T., & Gasevic, D. (2016).
Learning analytics should not promote one size fits all:
The effects of instructional conditions in predicting
academic success. The Internet and Higher Education,
28, 68-84.
Jha, S., Jha, M., & O’Brien, L. (2019, December).
Analysing Computer Science Course Using Learning
Analytics Techniques. In 2019 IEEE Asia-Pacific
Conference on Computer Science and Data
Engineering (CSDE) (pp. 1-6). IEEE.
Kadoić, N., & Oreški, D. (2018, May). Analysis of student
behavior and success based on logs in Moodle. In 2018
41st International Convention on Information and
Communication Technology, Electronics and
Microelectronics (MIPRO) (pp. 0654-0659). IEEE.
Kaensar, C., & Wongnin, W. (2023). Analysis and
Prediction of Student Performance Based on Moodle
Log Data using Machine Learning Techniques. Int. J.
Emerg. Technol. Learn., 18(10), 184-203.
Nguyen, V. A. (2017). The impact of online learning
activities on student learning outcome in blended
learning course. Journal of Information & Knowledge
Management, 16, 1750040.
Panigrahi, R., Srivastava, P. R., & Sharma, D. (2018).
Online learning: Adoption, continuance, and learning
outcome—A review of literature. International Journal
of Information Management, 43, 1-14.
Rotelli, Daniela & Fiorentino, Giuseppe & Monreale,
Anna. (2021). Making Sense of Moodle Log Data.
10.48550/arXiv.2106.11071.
Ryabov, I. (2012). The efect of time online on grades in
online sociology courses. MERLOT Journal of Online
Learning and Teaching, 8, 13–23
Schön, S., Leitner, P., Ebner, M., Edelsbrunner, S., &
Hohla, K. (2021, September). Quiz feedback in massive
open online courses from the perspective of learning
analytics: role of first quiz attempts. In International
Conference on Interactive Collaborative Learning (pp.
972-983). Cham: Springer International Publishing.
Tamada, M. M., Giusti, R., & de Magalhães Netto, J. F.
(2021, October). Predicting student performance based
on logs in moodle LMS. In 2021 IEEE Frontiers in
Education Conference (FIE) (pp. 1-8). IEEE.
Tuckman, B. W. (2005). Relations of academic
procrastination, rationalizations, and performance in a
web course with deadlines. Psychological reports,
96(3_suppl), 1015-1021.
Wei, H. C., Peng, H., & Chou, C. (2015). Can more
interactivity improve learning achievement in an online
course? Effects of college students’ perception and
actual use of a course-management system on their
learning achievement. Computers & Education, 83, 10–
21.
Wong, B. T. M. (2017). Learning analytics in higher
education: an analysis of case studies. Asian
Association of Open Universities Journal, 12(1), 21-40.
CSEDU 2025 - 17th International Conference on Computer Supported Education
290
