
The Impact of Live Polling Quizzes on Student Engagement and
Performance in Computer Science Lectures: A Post-COVID19 Study
Xingyu Zhao
a
WMG, University of Warwick, Coventry, U.K.
Department of Computer Science, University of Liverpool, Liverpool, U.K.
Keywords:
Active Learning, Live Polling Quiz, Formative Assessment, Classroom Interactivity, Post COVID19
Education, Real-Time Feedback, Survey Analysis in Education, Behavioural Shift in Learning.
Abstract:
Before COVID19, live polling and real-time feedback tools gained popularity in higher education for enhanc-
ing student engagement, boosting attention, participation, and understanding of course materials. However,
recent changes in learning behaviours due to the pandemic necessitate a reevaluation of these active learn-
ing technologies. In this context, our study focuses on the Computer Science (CS) domain, investigating the
impact of Live Polling Quizzes (LPQs) in undergraduate CS lectures. These quizzes comprise fact-based,
formally defined questions with clear answers, aiming to enhance engagement, learning outcomes, and overall
perceptions of the course module. A survey was conducted among 70 undergraduate CS students, attending
CS modules with and without LPQs. The results revealed that, while LPQs contribute to lecture attendance,
additional factors likely play a larger role in attendance rates. Students generally find LPQs beneficial for
understanding content, maintaining attention, and fostering motivation, but also viewing them as essential for
re-establishing peer and instructor connections post-pandemic. Students prefer a balanced LPQ frequency and
clear, accessible instructions, reflecting a reliance on digital tools and self-paced engagement habits developed
during remote learning.
1 INTRODUCTION
Before the COVID19, live polling and real-time feed-
back tools were popular in higher education class-
rooms as a way to boost student engagement and
performance in learning (Lim, 2017; Serrano et al.,
2019; Voelkel and Bennett, 2014; Lantz and Stawiski,
2014; DeSouza and Fleming, 2003; Salas-Morera
et al., 2012; Hennig et al., 2019). However, state-
of-the-art research works on the impact of using live
polling systems in in-person lectures were mostly per-
formed based on data collected before the COVID19.
Arguably, students’ learning behaviours may have
changed after the pandemic, following nearly 3 years
without in-person teaching (Rapanta et al., 2021).
The shift to remote learning during COVID19 may
have already altered student engagement and expec-
tations (Cicha et al., 2021). For instance, changes
and new trends regarding the learning environment
are identified in (Al Ansi and Al-Ansi, 2020), the
new engagement behaviours in hybrid-classrooms is
a
https://orcid.org/0000-0002-3474-349X
discussed in (Hjersman et al., 2022), and technology
used in blended learning will likely play a critical role
(Imran et al., 2023). In this regard, there is a need
to re-examine student perceptions of active learning
technologies, like live polling and real-time feedback
tools, in light of these changes (Phelps and Moro,
2022; Reimers, 2021), which motivates this work.
Focusing on the Computer Science (CS) domain,
we have undertaken a survey-based investigation to
reevaluate the effects of integrating Live Polling
Quizzes (LPQs) into undergraduate (UG) CS lectures,
where the questions are all based on factual infor-
mation and are formally defined, having clear an-
swers, as opposed to open-ended or opinion-based
questions that lack definitive answers. Our study re-
volves around several research questions that delve
into aspects such as student engagement, learning out-
comes, ideal frequency and usability, as well as poten-
tial correlations with overall perceptions of the course
module. More specifically, a survey of 14 questions
(12 multiple choices with Likert scale answers and 2
fill-in-the-blank questions) was distributed to 70 UG
students who have been attending UG CS modules
Zhao, X.
The Impact of Live Polling Quizzes on Student Engagement and Performance in Computer Science Lectures: A Post-COVID19 Study.
DOI: 10.5220/0013218700003932
In Proceedings of the 17th International Conference on Computer Supported Education (CSEDU 2025) - Volume 1, pages 291-298
ISBN: 978-989-758-746-7; ISSN: 2184-5026
Copyright © 2025 by Paper published under CC license (CC BY-NC-ND 4.0)
291

with and without using LPQs. 30 responses (in which
28 are valid) were collected and analysed both quan-
titatively and qualitatively. Finally, the threats to va-
lidity are discussed.
The new data shows some insights as follows:
i) Although LPQs may have contributed to higher
attendance, they alone do not completely account for
the higher lecture attendance rates. Other factors may
have contributed more than LPQs.
ii) LPQs were broadly viewed as beneficial for
comprehending lecture content, effective at keeping
students’ attention, motivation and participation.
iii) Post-pandemic, students view LPQs as critical
for rebuilding social connections with peers and in-
structors, filling a gap left by remote learning. LPQs
help students readjust to live, in-person engagement
and sustained focus, challenging the passive habits
developed during remote, self-paced learning.
iv) Students after COVID19 prioritize clear, ac-
cessible instructions and intuitive technology inter-
faces, reflecting their reliance on digital tools during
remote learning.
v) Students prefer a balanced LPQ frequency,
finding overly frequent quizzes disruptive rather than
engaging—likely influenced by their autonomy in re-
mote learning during the pandemic.
2 METHOD
Aim. The aim of this study is to assess student per-
ceptions and self-reported behaviours related to the
use of LPQs during CS lectures. Specifically, the
study seeks to understand if the inclusion of LPQs in-
creases student motivation, engagement, and sense of
understanding and connection in the classroom. Ad-
ditionally, we aim to examine if attendance and par-
ticipation in lectures with LPQs is associated with
students reporting more positive benefits compared to
traditional lectures without these interactive features.
Context. The University of Liverpool (for double-
blind review) is a public research university located in
Liverpool, UK. It is a member of the Russell Group
of leading research-intensive universities in the UK.
Students in their third year of an UG CS programme
at the University of Liverpool are typically working
towards a Bachelor of Science (BSc) degree in CS.
The programme provides students with core computer
science knowledge and skills such as programming,
algorithms, data structures, databases, operating sys-
tems, and more. In their third year, students take ad-
vanced courses like formal methods, machine learn-
ing, and often work on a final year project where they
apply what they’ve learned to develop a computing
system or conduct research. The programme prepares
students for careers in software engineering, data sci-
ence, and other technology fields upon graduation.
Design. A survey with 14 questions (12 multiple-
choice questions and 2 fill-in-the-blank questions),
about 10 minutes in length, was designed to be com-
pleted online in the CANVAS web-based teaching
management system. It was distributed, via links in
emails and notifications from CANVAS, to the 70 CS
UG students. The student may answer those questions
anonymously and without any time limit in a three
months time window after the mid-term.
Sample. The survey was distributed to a cohort of
70 final year CS UG students in my own module, in
which there are 3 lectures per week for 12 weeks. The
general teaching practice around LPQs is shown in
Figure 1. Before each lecture, pre-recorded videos
and slides with the quizzes (without answers) were
sent to the students for pre-study. During the lectures,
2-3 LPQs were conducted every 15-20 minutes fol-
lowed by live explanations and discussions of the an-
swers. After the mid term when the students have suf-
ficient experience of learning with my teaching prac-
tice with LPQs, the survey was distributed. Out of the
70 invited surveys, 30 responses were collected but
with 2 invalid ones without any answers. That said,
the later analysis is based on a sample of 28 valid re-
sponses, which was deemed statistically adequate.
Figure 1: The teaching practice using LPQs in the CS mod-
ule where students were surveyed.
Overview of Analysis Approaches. For the 12
multiple-choice questions, we perform the following
quantitative analysis:
• Summarise and presenting the answer distribution
of each question, showing the central tendency
and spread of responses.
• Investigate correlations between questions using
a correlation matrix of Pearson correlation coeffi-
cient, and understand which questions have strong
positive or negative correlations.
CSEDU 2025 - 17th International Conference on Computer Supported Education
292

For the 2 fill-in-the-blank questions, not all re-
spondents provide informative answers. Thus, a sim-
ple qualitative analysis are conducted and reported in
the next section.
3 RESULTS AND DISCUSSIONS
All survey data and quantitative analysis code are
publicly available at our project repository
1
.
3.1 Data with Basic Statistics
For the 12 multiple-choice questions, the Q1-Q4 are
about general feedback regarding the module, while
the last 8 questions (Q5-Q12) are more specifically
designed to assess perspectives on LPQs. This divi-
sion of question types may later reveal correlations
between students’ overall perceptions of the module
and their specific reflections on the use of LPQs.
Q1: I Am Confident I Can Succeed in this Module.
The majority of respondents (about 71.4%) expressed
agreement or strong agreement with this statement,
cf. Figure 2. This suggests most students feel confi-
dent in their ability to succeed in the module. How-
ever, about 28.6% were neutral or expressed disagree-
ment. This indicates a substantial minority may have
lower self-efficacy. This distribution suggests that
while most students are confident, we should be aware
that some may need more support in developing self-
efficacy. Targeted interventions could identify and as-
sist students with lower confidence levels. More im-
portantly, regarding LPQs, we will later exam if the
level of confidence correlated with how student per-
ceive the use of LPQs.
Q2: I Feel Connected with Other Students and
Teaching Staff on this Module. Responses were
more positive on this question compared to Q1.
Around 85.7% agreed or strongly agreed they felt
connected. A small portion (10.8%) were neutral on
their feelings of connection. This suggests they did
not perceive a strong sense of connection, but did not
actively feel disconnected either. Only 1 respondent
disagreed to some extent, signalling they felt discon-
nected from peers and the lecturer. Again, it would be
very useful to later exam if the feeling of connected
correlated with how student perceive the use of LPQs.
1
https://github.com/x-y-zhao/LPQ survey study
Q3: I Believe I Am Contributing to and Engaging
Effectively with the Module (e.g., Participating in
Discussions and Other Learning Activities). As
shown in Figure 2, a majority of respondents, 75%,
agreed or strongly agreed that they were actively con-
tributing and engaging with the module. The remain-
ing 25% were neutral, neither agreeing nor disagree-
ing about their participation. So in fact, most stu-
dents responding to the survey did perceive that they
were actively involved and participating in the mod-
ule learning activities. This might hint the positive
outcome of using LPQs, which needs more investiga-
tion later.
Q4: at this Stage in the Module I Understand How
My Learning Will Be Assessed on this Module.
Almost every respondent (27 out of 28) agreed or
strongly agreed that they understand how their learn-
ing will be assessed in the module. Only 1 respondent
was neutral, neither agreeing nor disagreeing with the
statement. This indicates that, despite the extensive
use of LPQs in lectures, it did not confuse students
about how the module would be assessed at the end
of the term. As long as clear statements about as-
sessment are provided in the module specification and
reiterated verbally during lectures, the inclusion of
LPQs throughout the course does not appear to ob-
scure the end-of-term evaluation methods.
Q5: How Often Did You Attend this Module with
LPQs? And How Often Did You Attend Other
Modules Without LPQs? As shown in Figure 2,
the majority (64.3%) are neutral in terms of if the use
pf LPQs helps the attendance. A substantial propor-
tion (32.1%) suggests the LPQs may have increased
motivation and engagement, leading to higher lecture
attendance rates. That said, 1 respondent attended
other lectures more frequently without LPQs. So,
while LPQs may have encouraged attendance, they
do not fully explain the variation in lecture attendance
rates. Other factors are likely also at play.
Q6: Did the LPQs Help You Better Understand the
Lecture Material? The vast majority of respon-
dents (approximately 93%) answered “Yes” that the
LPQs helped them better understand the lecture mate-
rial. Only a very small number answered “Not sure”,
indicating they were uncertain about the impact. The
overwhelmingly positive response suggests the LPQs
were broadly viewed as beneficial for comprehend-
ing the lecture content. This aligns with the intent of
using active learning techniques like polling (Arthurs
and Kreager, 2017) to check understanding and clar-
ify knowledge gaps during lectures.
The Impact of Live Polling Quizzes on Student Engagement and Performance in Computer Science Lectures: A Post-COVID19 Study
293
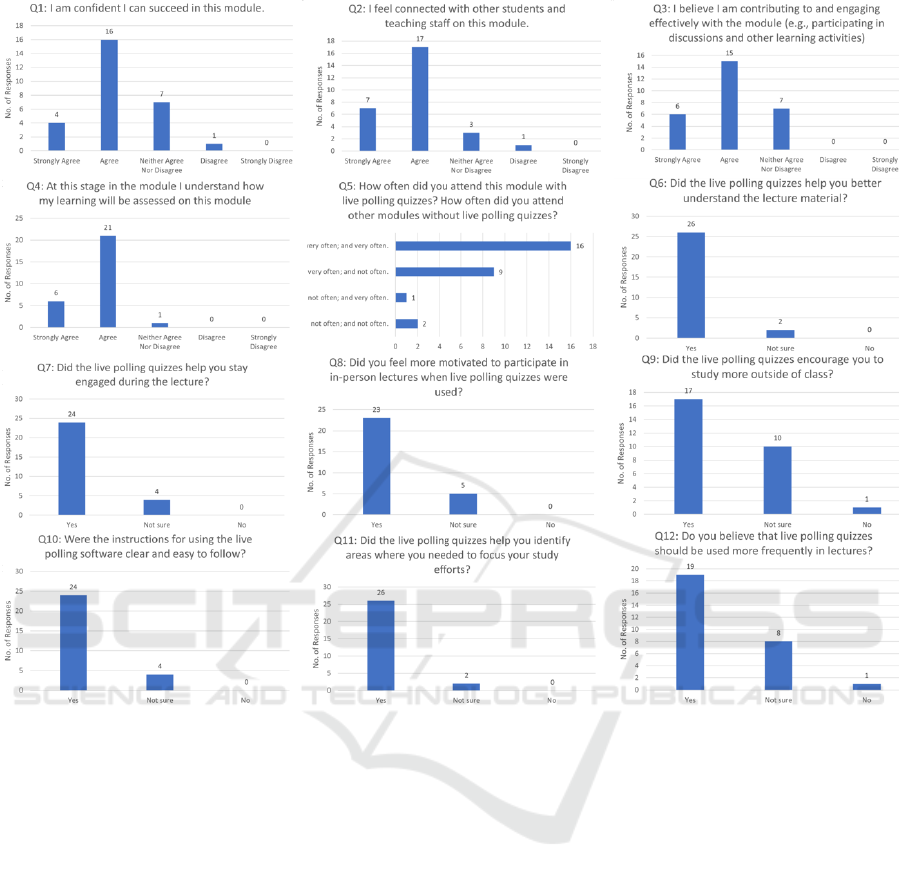
Figure 2: Survey results of Q1-Q12.
Q7: Did the LPQs Help You Stay Engaged During
the Lecture? The majority of respondents (around
85.7%) answered “Yes” that the LPQs helped them
stay engaged during lectures. However, the rest were
uncertain. Overall, the responses indicate LPQs were
broadly effective at keeping most students’ attention
and participation during lectures.
Q8: Did You Feel More Motivated to Participate in
in-person Lectures when LPQs Were Used? Sim-
ilarly to Q7, the use of LPQs motivated participation
for most students, a few were uncertain on their moti-
vation levels, as shown in Figure 2.
Q9: Did the LPQs Encourage You to Study More
Outside of Class? Compared to the very positive
feedbacks in Q7 and Q8, there is a clear drop in the
number of responses with a positive “Yes”, cf. Figure
2. Responses to this question were relatively mixed—
60% answered “Yes”, indicating the quizzes encour-
aged them to study more outside of class, while 40%
were uncertain or feel LPQs did not affect their study
habits outside classes which indicates LPQs have lim-
ited positive impact on study habits outside classes.
Q10: Were the Instructions for Using the Live
Polling Software Clear and Easy to Follow?
Analysing the responses, the majority (∼86%) an-
swered “Yes” that the instructions for using the
polling software were clear and easy to follow. How-
ever, ∼24% were “Not sure”. This suggests that while
the instructions seem adequately clear overall, there is
room for improvement to make them more universally
understandable. Moreover, we exam how this corre-
lates answers to other questions to understand the im-
portance of a clear instruction of using the software.
Q11: Did the LPQs Help You Identify Areas
Where You Needed to Focus Your Study Efforts?
As presented in Figure 2, we got very positive out-
come of this question—93% respondents feel LPQs
helped identify areas needing further study, while
CSEDU 2025 - 17th International Conference on Computer Supported Education
294

only 7% are uncertain. We may confidently conclude
that the majority of students found LPQs useful for
highlighting areas to concentrate their studying on.
Q12: Do You Believe that LPQs Should Be Used
More Frequently in Lectures? The responses
were relatively mixed compared to previous ques-
tions, despite those positive aspects of using LPQs.
Approximately 68% of students answered “Yes” that
LPQs should be used more frequently. Around 29%
were “Not sure” if increased usage was beneficial,
and 1 answered “No”. This suggests that increased
LPQs frequency may benefit some students but risks
overuse for others if not managed carefully.
3.2 Correlation Analysis
To perform quantitative correlation analysis between
the 12 multi-choice questions, we first encode the an-
swers into numerical values:
• Strongly Agree =1; Agree=0.5; Neither Agree nor
Disagree = 0; Disagree = −0.5; Strongly Disagree
= −1
• Very often and very often = 0; No often and not
often = 0; Very often and not often = 1; Not often
and very often = −1;
• Yes = 1; Not Sure = 0; No = −1
Intuitively, we encode answers in favour of using
LPQs as positive numbers, neutral answers as 0, and
otherwise negative numbers.
Figure 3 shows the correlation matrix, in which
each correlation coefficient ranges from -1 to +1. A
positive value indicates a positive correlation, a nega-
tive value indicates a negative correlation, and a value
close to 0 indicates little to no linear correlation (Carl-
son and Herdman, 2012). Although there are several
correlation coefficients we can use, we present the
most common Pearson correlation coefficient (Cohen
et al., 2009) in the matrix.
We first highlight those positively correlated ques-
tions/answers with sufficiently high degree (> 0.3).
As expected, the answers of the first 4 questions (Q1–
Q4) regarding general feedbacks of the module are all
strongly correlated, indicating the validity of the re-
sponses collected. The answers to Q1 and Q6, as well
as Q2 and Q6, show a positive correlation. This cor-
relation implies that the extent to which students use
LPQs to understand learning material is positively as-
sociated with both their confidence in being success-
ful and their sense of connection with others in the
lectures. In other words, the more students effectively
utilise LPQs, the more likely they are to feel confident
Figure 3: The correlation matrix of the 12 multi-choice
questions, showing the Pearson correlation coefficients.
about succeeding and connected with their peers dur-
ing lectures. Q7 and Q8 show a positive correlation,
indicating that if LPQs help a student stay engaged
during lectures, then they are also more likely to moti-
vate that student to attend lectures in person. The pos-
itive correlations between Q8 and Q9, as well as be-
tween Q8 and Q10, indicate that feeling motivated by
LPQs to attend lectures is positively associated with
both being encouraged to study more outside of class
and quickly adapting to using learning software. The
positive correlation between Q11 and Q6 says when
LPQs help the student better understand the learn-
ing material, it also identify the area where the stu-
dent need to focus. Very significantly, Q11 and Q10
are positively correlated, showing the clear instruction
on using software positively correlates LPQs help in
identifying areas to focus. Q12 shows positive corre-
lations with Q3, Q4, and Q11 respectively. This says
that students who are in favour of using LPQs more
frequently also tend to report higher engagement in
the module, better understanding of how the module
will be assessed, and that LPQs helped them iden-
tify areas to focus on. In other words, students who
want more regular use of LPQs believe they lead to
greater engagement, clarity on assessments, and abil-
ity to pinpoint knowledge gaps.
While generally all negative correlations among
those 12 questions/answers are not very significant,
we highlight two pairs that have correlations smaller
than -0.2—Q5 and Q8, and Q5 and Q9. This indi-
cates: i) Students who attend lectures with LPQs rel-
atively more often than lecturers without LPQs do not
The Impact of Live Polling Quizzes on Student Engagement and Performance in Computer Science Lectures: A Post-COVID19 Study
295

necessarily feel more motivated because of the use of
LPQs. ii) Students who attend lectures with LPQs
relatively more often than lecturers without LPQs do
not feel LPQs encourage them to study more outside
of class. While a rigorous study with more data is
needed to draw accurate conclusions, for now, we can
interpret them as: i) LPQs might have encouraged at-
tendance, but there are likely other relevant factors
that contribute more than LPQs in this regard. ii) Stu-
dents who attend in-person lectures with LPQs more
often may rely too much on them, which diminishes
their motivation to study outside of class.
3.3 Qualitative Analysis
To prevent respondent fatigue and ensure data quality,
limited number of fill-in-the-bank questions should be
used in the survey (Galesic and Bosnjak, 2009). That
said, we included the following two open questions.
Q13: What One Thing Can We Do to Better to
Improve Your Experience on this Module? This
is a question regarding how the students perceive the
module. In-total 9 answers were given out of 28 valid
respondents, covering the points of asking for more
exercises/tutorials, and more interesting examples.
Q14: What Suggestions Do You Have for Improv-
ing the Use of LPQs in Lectures? This question
targeted LPQs, with 10 answers from 28 valid respon-
dents. Notably, all 9 respondents who answered Q13
also answered Q14. Key points include the need for
more accessible web-based LPQs and an increased
number of LPQs per lecture.
Qualitative results suggest that LPQs can influ-
ence student behaviour and engagement. Making
web-based LPQs more accessible with clear instruc-
tions, as highlighted by (Kay and LeSage, 2009), and
increasing their frequency during lectures could en-
hance engagement and learning for some students.
4 DISCUSSION ON USING LPQs
PRE- AND POST-COVID19
Pre-COVID Use of LPQs. Before the COVID19
pandemic, LPQs were increasingly popular as an ac-
tive learning strategy in higher education settings. Re-
search has shown that integrating live polling activ-
ities, where students respond to questions posed by
the lecturers using digital devices, can increase stu-
dent attention, participation, and understanding of the
course materials (Bode et al., 2009; Kay and LeSage,
2009; Miller et al., 2013). One of the pioneering
studies in this area was conducted by (Draper and
Brown, 2004) in 2004. They examined the use of
personal response systems (clickers) in large univer-
sity lectures across multiple disciplines. Their find-
ings showed that these systems could increase student
engagement and provide valuable feedback to instruc-
tors. A 2009 review paper by (Kay and LeSage, 2009)
synthesized research on classroom response systems
up to that point. They found that these systems gen-
erally had positive effects on classroom environment,
learning, and assessment, while a detailed list of bene-
fits and challenges are also summarised. (Beatty et al.,
2006) explored different pedagogical approaches for
integrating classroom response systems effectively.
They emphasized the importance of question design
and follow-up discussions to maximize learning ben-
efits. The immediate feedback provided through live
polling also allows lecturers to gauge student under-
standing in real-time and adjust their teaching timely
(Voelkel and Bennett, 2014). In (Lantz and Stawiski,
2014), the study tested clickers’ effectiveness in a
controlled lab setting and found that clicker ques-
tions with immediate feedback significantly improved
scores two days later compared to no-clicker controls.
Additionally, the immediate feedback helped partici-
pants not only retain information but also correct lec-
ture misconceptions. The work (Stowell, 2015) com-
pares traditional clickers to mobile-based LPQs and
investigates their impact on student engagement. It
shows that Mobile device polling benefits include dis-
playing questions and class response distributions di-
rectly on students’ screens, lower costs, and suitabil-
ity for open-ended responses. Unlike clickers, some
mobile services also allow “hotspot” questions requir-
ing image-based responses. However, mobile polling
may lead to digital distractions, internet connectivity
issues, and potential costs for students. (Sheng et al.,
2019) finds students are dissatisfied when questions
posed do not stimulate impactful discussions. Caveats
are discussed by (Florenthal, 2019) on the “downside”
of anonymity where some students may find it allows
them to disengage and perhaps disrupt learning. The
recent paper (Wood and Shirazi, 2020) identifies of
the main factors affecting student experience of learn-
ing when using audience response systems in general.
New Perspectives in Post-COVID. While LPQs
continue to help maintain student attention and com-
prehension (e.g., Q12 positively correlates Q3, Q4
and Q11), they now play a more critical role in re-
building sense of connections disrupted by extended
periods of remote learning. That is, post-pandemic
students seem to value LPQs not only as learning
CSEDU 2025 - 17th International Conference on Computer Supported Education
296

tools but also as more essential to re-establishing so-
cial connection with peers and teachers (e.g., cor-
relation analysis around Q2), which were impacted
by the shift to remote and hybrid learning environ-
ments. With remote learning environments offer-
ing more flexibility, many students grew accustomed
to passive engagement modes and self-paced study,
which can make returning to active in-person partic-
ipation more challenging. LPQs thus serve as an es-
sential tool not only for engaging students but also
for re-acclimating them to real-time interaction and
sustained concentration in a physical classroom (e.g.,
correlations between Q7 and Q8).
Additionally, students now place greater empha-
sis on clear instructions and accessibility in digital
tools, reflecting a heightened dependency on technol-
ogy for learning during the pandemic (e.g., the cor-
relation analysis of Q10 and Q11). Furthermore, our
study suggests that students are more sensitive to the
frequency and usability of LPQs, preferring an op-
timal balance that avoids overuse (analysis around
Q12). While LPQs previously functioned as intermit-
tent checkpoints for engagement, the study indicates
that students now feel overwhelmed when quizzes are
overly frequent, potentially viewing them as interrup-
tions rather than engagement aids. This finding im-
plies that students’ tolerance for LPQ frequency has
been influenced by the remote learning environment,
where they had more control over when and how they
interacted with course material.
5 THREATS TO VALIDITY
Construct Validity. It refers to the extent to which a
survey instrument measures the theoretical construct
or concept it claims to be measuring. In this study,
the use of self-reported survey data is subjective and
prone to self-reporting bias that may pose a threat.
Students may have responded more positively due
to wanting to please the lecturer who is also the re-
searcher. To mitigate these two threats, we assure
respondents that their responses will be kept confi-
dential and anonymous. This can reduce the fear of
social judgement and encourage more objective and
accurate reporting. Students who had more positive
views on LPQs may have been more inclined to take
the survey, while others with negative views may be
underrepresented. To mitigate this response bias, we
have sent reminder messages to non-respondents to
encourage their participation during the 3-months sur-
vey period, and tried to clearly communicate the pur-
pose of the survey and its importance to all students
regardless of their views.
Internal Validity. Threats may correspond to bias
in establishing cause-effect relationships in our sur-
vey. When interpreting the results of our correlation
analysis, we are fully aware that “correlation does
not imply causation” is a fundamental principle in re-
search and statistics. Confounding variables, i.e., fac-
tors other than the use of LPQs (e.g., physical learning
environment and teaching material quality) may have
influenced outcomes like attendance and engagement.
To mitigate such threat, we plan to do Randomised
Controlled Trials in the future by carefully consider-
ing and addressing confounding variables in the de-
sign and analysis. In this preliminary study with lim-
ited data, we only draw correlation conclusion.
External Validity. Factors limiting generalisability
threaten external validity. The selection bias (e.g.,
only a group of UG CS student from one University
was study) and small sample size are two threats in
this regard. In addition, only one polling software
(itempool.com) was studied that also poses a threat.
To mitigate them, more sample needs to be collect
with diversified data representing more students and
software tools. In this preliminary study, we have ex-
plicitly discussed the limitations related to our sam-
ple’s representatives.
6 CONCLUSION
After nearly 3 years of remote education, student be-
haviours and preferences may have shifted, neces-
sitating a re-evaluation of LPQs in the context of
COVID-19. This study surveyed CS UG students who
attended lectures with and without LPQs, focusing on
engagement, learning outcomes, polling frequency,
and its correlation with course perceptions. The quiz
questions were factual and objectively answerable.
Preliminary findings show that while live polling
improved attendance and comprehension for most
students, it was not the sole factor. Overuse risks di-
minishing motivation, and clear software instructions
are critical. Although students found polls broadly
beneficial, the pandemic’s impact underscores the
need for renewed investigation.
This study fills a literature gap by examining ac-
tive learning technologies in the post-COVID-19 con-
text, offering insights into the evolving role of LPQs
in CS education. Future work includes ongoing mon-
itoring, mitigating validity threats, and applying ad-
vanced analyses, such as clustering and factor analy-
sis, as more data becomes available.
The Impact of Live Polling Quizzes on Student Engagement and Performance in Computer Science Lectures: A Post-COVID19 Study
297

REFERENCES
Al Ansi, A. M. and Al-Ansi, A. (2020). Future of edu-
cation post covid-19 pandemic: reviewing changes in
learning environments and latest trends. Solid State
Technology, 63(6):201584–201600.
Arthurs, L. A. and Kreager, B. Z. (2017). An integrative
review of in-class activities that enable active learning
in college science classroom settings. International
Journal of Science Education, 39(15):2073–2091.
Beatty, I. D., Gerace, W. J., Leonard, W. J., and Dufresne,
R. J. (2006). Designing effective questions for class-
room response system teaching. American journal of
physics, 74(1):31–39.
Bode, M., Drane, D., Kolikant, Y. B.-D., and Schuller, M.
(2009). A clicker approach to teaching calculus. No-
tices of the AMS, 56(2):253–256.
Carlson, K. D. and Herdman, A. O. (2012). Understanding
the impact of convergent validity on research results.
Organizational Research Methods, 15(1):17–32.
Cicha, K., Rizun, M., Rutecka, P., and Strzelecki, A. (2021).
Covid-19 and higher education: First-year students’
expectations toward distance learning. Sustainability,
13(4):1889.
Cohen, I., Huang, Y., Chen, J., Benesty, J., Benesty, J.,
Chen, J., Huang, Y., and Cohen, I. (2009). Pearson
correlation coefficient. Noise reduction in speech pro-
cessing, pages 1–4.
DeSouza, E. and Fleming, M. (2003). A comparison of
in-class and online quizzes on student exam perfor-
mance. Journal of Computing in Higher Education,
14:121–134.
Draper, S. W. and Brown, M. I. (2004). Increasing inter-
activity in lectures using an electronic voting system.
Journal of computer assisted learning, 20(2):81–94.
Florenthal, B. (2019). Students’ motivation to participate
via mobile technology in the classroom: A uses and
gratifications approach. Journal of Marketing Educa-
tion, 41(3):234–253.
Galesic, M. and Bosnjak, M. (2009). Effects of ques-
tionnaire length on participation and indicators of re-
sponse quality in a web survey. Public opinion quar-
terly, 73(2):349–360.
Hennig, S., Staatz, C. E., Bond, J. A., Leung, D., and Sin-
gleton, J. (2019). Quizzing for success: Evaluation
of the impact of feedback quizzes on the experiences
and academic performance of undergraduate students
in two clinical pharmacokinetics courses. Currents in
Pharmacy Teaching and Learning, 11(7):742–749.
Hjersman, J., Mon, K., Nysak, S., Peng, R., and Freiwirth,
R. (2022). Work-in-progress—post-covid: Adapt-
ing education to a changing educational environment
through immersive technology. In 2022 8th Inter-
national Conference of the Immersive Learning Re-
search Network (iLRN), pages 1–3.
Imran, R., Fatima, A., Elbayoumi Salem, I., and Allil,
K. (2023). Teaching and learning delivery modes
in higher education: Looking back to move forward
post-covid-19 era. The International Journal of Man-
agement Education, 21(2):100805.
Kay, R. H. and LeSage, A. (2009). Examining the benefits
and challenges of using audience response systems:
A review of the literature. Computers & Education,
53(3):819–827.
Lantz, M. E. and Stawiski, A. (2014). Effectiveness of
clickers: Effect of feedback and the timing of ques-
tions on learning. Computers in Human Behavior,
31:280–286.
Lim, W. N. (2017). Improving student engagement
in higher education through mobile-based interac-
tive teaching model using socrative. In 2017
IEEE Global Engineering Education Conference
(EDUCON), pages 404–412. IEEE.
Miller, J., Risser, M., and Griffiths, R. (2013). Stu-
dent choice, instructor flexibility: Moving beyond the
blended instructional model. Issues and trends in ed-
ucational technology, 1(1):8–24.
Phelps, C. and Moro, C. (2022). Using live interactive
polling to enable hands-on learning for both face-
to-face and online students within hybrid-delivered
courses. Journal of University Teaching and Learn-
ing Practice, 19(3):8.
Rapanta, C., Botturi, L., Goodyear, P., Gu
`
ardia, L., and
Koole, M. (2021). Balancing technology, pedagogy
and the new normal: Post-pandemic challenges for
higher education. Postdigital Science and Education,
3(3):715–742.
Reimers, F. M. (2021). In search of a twenty-first century
education renaissance after a global pandemic. Im-
plementing deeper learning and 21st century educa-
tion reforms: building an education renaissance after
a global pandemic, pages 1–37.
Salas-Morera, L., Arauzo-Azofra, A., and Garc
´
ıa-
Hern
´
andez, L. (2012). Analysis of online quizzes as
a teaching and assessment tool. JOTSE: Journal of
technology and science education, 2(1):39–45.
Serrano, D. R., Dea-Ayuela, M. A., Gonzalez-Burgos, E.,
Serrano-Gil, A., and Lalatsa, A. (2019). Technology-
enhanced learning in higher education: How to en-
hance student engagement through blended learning.
European Journal of Education, 54(2):273–286.
Sheng, R., Goldie, C. L., Pulling, C., and Luctkar-Flude,
M. (2019). Evaluating student perceptions of a multi-
platform classroom response system in undergraduate
nursing. Nurse Education Today, 78:25–31.
Stowell, J. R. (2015). Use of clickers vs. mobile devices for
classroom polling. Comp. & Education, 82:329–334.
Voelkel, S. and Bennett, D. (2014). New uses for a famil-
iar technology: introducing mobile phone polling in
large classes. Innovations in Education and Teaching
International, 51(1):46–58.
Wood, R. and Shirazi, S. (2020). A systematic review of au-
dience response systems for teaching and learning in
higher education: The student experience. Computers
& Education, 153:103896.
CSEDU 2025 - 17th International Conference on Computer Supported Education
298
