
DiPACE: Diverse, Plausible and Actionable Counterfactual Explanations
Jacob Sanderson
a
, Hua Mao
b
and Wai Lok Woo
c
Department of Computer and Information Sciences, Northumbria University, Newcastle upon Tyne, U.K.
Keywords:
Explainable Artificial Intelligence (XAI), Counterfactual Explanations, Interpretable Machine Learning.
Abstract:
As Artificial Intelligence (AI) becomes integral to high-stakes applications, the need for interpretable and trust-
worthy decision-making tools is increasingly essential. Counterfactual Explanations (CFX) offer an effective
approach, allowing users to explore “what if?” scenarios that highlight actionable changes for achieving more
desirable outcomes. Existing CFX methods often prioritize select qualities, such as diversity, plausibility,
proximity, or sparsity, but few balance all four in a flexible way. This work introduces DiPACE, a practical
CFX framework that balances these qualities while allowing users to adjust parameters according to specific
application needs. DiPACE also incorporates a penalty-based adjustment to refine results toward user-defined
thresholds. Experimental results on real-world datasets demonstrate that DiPACE consistently outperforms
existing methods Wachter, DiCE and CARE in achieving diverse, realistic, and actionable CFs, with strong
performance across all four characteristics. The findings confirm DiPACE’s utility as a user-adaptable, inter-
pretable CFX tool suitable for diverse AI applications, with a robust balance of qualities that enhances both
feasibility and trustworthiness in decision-making contexts.
1 INTRODUCTION
In recent years, the importance of interpretability in
artificial intelligence (AI) has grown, especially in
critical areas such as healthcare (Yagin et al., 2023;
Shin et al., 2023), finance (Babaei et al., 2023;
El Qadi et al., 2023; Zhu et al., 2023), cyber security
(Kumar et al., 2023; Nadeem et al., 2023), disaster re-
lief (Sanderson et al., 2023a; Sanderson et al., 2023b;
Sanderson et al., 2024), and autonomous vehicles
(Alatabani and Saeed, 2025; Starkey and Ezenkwu,
2023; Rawlley and Gupta, 2023), to name a few.
Explainable AI (XAI) aims to provide transparency
into AI models, fostering trust and supporting well-
informed decisions (Mirzaei et al., 2023). Within
XAI, counterfactual explanations (CFX) have become
essential for exploring “what if?” scenarios, allowing
users to understand how slight modifications to input
features could lead to more desirable outcomes (Jiang
et al., 2024). This approach not only provides insights
into cause-and-effect relationships but also suggests
actionable changes that can help users achieve differ-
ent model outputs.
Effective counterfactual explanations should have
a
https://orcid.org/0009-0002-5724-6637
b
https://orcid.org/0000-0003-3198-6282
c
https://orcid.org/0000-0002-8698-7605
at least four key qualities: diversity, plausibility, prox-
imity, and sparsity (Guidotti, 2022). Diversity of-
fers a range of alternative paths for achieving a de-
sired outcome, providing users with different options
(Mothilal et al., 2020). Plausibility ensures that coun-
terfactuals are realistic and feasible, aligning with
known data distributions and practical constraints
(Del Ser et al., 2024). Proximity and sparsity further
support actionable results by limiting counterfactuals
to minimal, realistic changes that remain close to the
original instance, making them more achievable and
understandable (Wachter et al., 2018; Tsiourvas et al.,
2024). These qualities are crucial for CFX to be prac-
tically valuable and applicable across diverse scenar-
ios.
Despite recent advancements in CFX, most meth-
ods focus on only a subset of these attributes, of-
ten sacrificing one or more qualities. Wachter et al.
(Wachter et al., 2018) introduced counterfactuals fo-
cused on proximity, ensuring minimal changes to the
input but without addressing diversity or plausibil-
ity. DiCE (Mothilal et al., 2020) enhanced diversity
by generating multiple counterfactuals that differ sig-
nificantly from each other, providing users with op-
tions but often at the expense of plausibility and spar-
sity. DECE (Cheng et al., 2021) emphasized spar-
sity by limiting feature changes to the most influen-
Sanderson, J., Mao, H. and Woo, W. L.
DiPACE: Diverse, Plausible and Actionable Counterfactual Explanations.
DOI: 10.5220/0013219100003890
In Proceedings of the 17th International Conference on Agents and Artificial Intelligence (ICAART 2025) - Volume 2, pages 543-554
ISBN: 978-989-758-737-5; ISSN: 2184-433X
Copyright © 2025 by Paper published under CC license (CC BY-NC-ND 4.0)
543

tial ones, but this restriction can hinder diversity and
plausibility. Finally, Tsiourvas et al. (Tsiourvas et al.,
2024) prioritized plausibility by aligning counterfac-
tuals with real-world data, though this approach may
reduce diversity and actionability. These approaches,
while valuable for specific applications, lack a frame-
work to balance all four qualities, limiting their adapt-
ability to different real-world contexts where priori-
ties may vary.
The choice of optimization technique also affects
counterfactual generation. Gradient-based methods
are popular due to their precision, as they can effi-
ciently navigate complex loss landscapes and lever-
age gradient information for fine-tuned adjustments.
However, these methods face two main limitations:
they require access to model gradients, which limits
them to differentiable models, and they are prone to
getting stuck in local optima. To address these is-
sues, researchers have explored alternative optimiza-
tion techniques such as genetic algorithms (Schle-
ich et al., 2021), shortest path algorithms (Poyiadzi
et al., 2020), and mixed-integer programming (Carri-
zosa et al., 2024). While these methods are model-
agnostic and can help avoid local minima, they of-
ten sacrifice precision due to the lack of direct gra-
dient information. This trade-off between precision
and adaptability restricts the effectiveness of existing
CFX methods, which often cannot meet the needs of
users who require both accuracy and a balanced com-
bination of qualities.
To address these limitations, we propose DiPACE
(Diverse, Plausible, Actionable Counterfactual Ex-
planations), a practical and adaptable framework de-
signed to optimize diversity, plausibility, proximity,
and sparsity simultaneously. Unlike most existing
methods, DiPACE allows users to adjust the empha-
sis on each quality according to specific application
needs, making it highly suitable for real-world con-
texts where the priorities for counterfactual qualities
may vary. DiPACE overcomes key limitations of cur-
rent methods by making the following contributions:
(i) DiPACE’s loss function is explicitly designed
to balance diversity, plausibility, proximity, and
sparsity. By allowing users to adjust the weights
of each quality, it offers flexibility across differ-
ent applications, addressing the issue of limited
adaptability in existing methods.
(ii) To address the local optima challenges associ-
ated with gradient-based optimization, DiPACE
integrates a perturbation mechanism that en-
ables exploration beyond local minima. This
retains the precision benefits of gradient-based
methods while reducing the risk of suboptimal
solutions, bridging the gap between gradient-
based precision and model-agnostic flexibility.
(iii) DiPACE supports the specification of muta-
ble and immutable features, acceptable ranges,
and directional constraints for feature changes.
These configurable options ensure that counter-
factuals are not only feasible but also aligned
with real-world requirements, overcoming the
practical limitations of current methods that lack
flexible constraint handling.
Additionally, we introduce DiPACE+, an en-
hanced version of DiPACE that incorporates penalty
terms to further refine counterfactuals based on user-
defined thresholds. By enforcing penalties for devia-
tions from these thresholds, DiPACE+ enables more
aggressive optimization tailored to specific applica-
tion needs, making it suitable for scenarios where par-
ticular qualities are prioritized.
Through experiments on real-world datasets, we
demonstrate that DiPACE offers a flexible, balanced
solution for counterfactual explanations, making it
a valuable tool for applications in AI where inter-
pretability and practical adaptability are critical.
2 METHODOLOGY
2.1 DiPACE Framework
The primary goal of the DiPACE framework is to gen-
erate a set of counterfactual (CF) instances that dif-
fer in their predicted outcome from a given query in-
stance while balancing multiple desirable qualities:
diversity, plausibility, proximity, and sparsity. These
qualities ensure that the CFs are realistic, provide a
range of actionable options, and are feasible to im-
plement in real-world applications. To achieve this
balance, DiPACE optimizes a loss function that is a
weighted combination of terms for each quality.
Let n denote the number of features in the query
instance x
q
, and let the CF set C represent a set of can-
didate counterfactuals. The loss function combines
the following components:
• Prediction Loss (L
pred
). Ensures that each CF in
C results in the desired change in model outcome
from that of the query instance.
• Diversity Loss (L
di
). Promotes diversity among
CF instances by maximizing the differences be-
tween them, offering users multiple actionable op-
tions.
• Plausibility Loss (L
pl
). Encourages CFs to stay
close to the distribution of the observed data, en-
hancing their feasibility and trustworthiness.
ICAART 2025 - 17th International Conference on Agents and Artificial Intelligence
544

• Proximity Loss (L
pr
). Minimizes the magnitude
of change required to transform the query instance
into each CF, ensuring interpretability.
• Sparsity Loss (L
sp
). Limits the number of fea-
ture changes, making each CF more actionable by
keeping modifications minimal.
• Categorical Loss (L
cat
). Maintains the integrity
of categorical features, ensuring that one-hot en-
coded variables sum to 1 for valid CF representa-
tion.
DiPACE uses gradient descent to optimize the
weighted sum of these losses, requiring access to the
model gradients. To mitigate the common issue of
local optima in gradient-based optimization, DiPACE
incorporates a perturbation mechanism, allowing CFs
to explore a wider solution space when stuck at sub-
optimal points. DiPACE+ further refines this ap-
proach by applying penalty adjustments for CFs that
do not meet user-defined thresholds for plausibility,
proximity, or sparsity, enabling more aggressive opti-
mization when specific qualities are prioritized.
Algorithm 1 outlines the steps for generating CFs
in DiPACE and DiPACE+.
2.2 Loss Function
The DiPACE loss function is designed to balance di-
versity, plausibility, proximity, and sparsity, ensur-
ing feasible and realistic counterfactual explanations
(CFX). Additionally, it includes terms for prediction
loss to ensure valid counterfactuals and categorical
loss to handle categorical variables accurately. Rec-
ognizing that users may prioritize certain character-
istics depending on the application, we introduce a
set of weights λ for each characteristic, allowing for
customizable tuning of the results. The overall loss
function for DiPACE is given by Equation 1.
L = L
pred
( f (c
i
), y) +λ
1
· (1 − L
di
(C)) +λ
2
· L
pl
(C, X)+
λ
3
· L
pr
(C, x
q
) +λ
4
· L
sp
(C, x
q
) +L
cat
(C)
(1)
where c
i
∈ C is a counterfactual instance in the set
C of generated counterfactuals, and x
i
∈ X is an ob-
served instance in the original dataset. The query in-
stance is represented by x
q
.
In DiPACE+, additional penalties are introduced
for greater control over how strictly the generated
counterfactuals adhere to user-defined thresholds for
plausibility, proximity, and sparsity. For each charac-
teristic L
i
∈ {L
pl
, L
pr
, L
sp
}, if its computed value ex-
ceeds a user-defined threshold τ, a penalty is applied
to enforce a stronger emphasis on this characteristic,
Algorithm 1: DiPACE and DiPACE+.
Input: Query Instance x
q
, Model f ,
Hyperparameters θ
parameter : Learning rate α, Weights λ,
Thresholds τ, Scale Factors γ,
Maximum Iterations µ, Maximum
Perturbation Attempts δ
Output: Counterfactual Set C
Let iteration count t = 0, perturbation count
p = 0, counterfactual set C ← N (0, 1)
n·len(x
q
)
.
while t < µ or ld ≥ τ
ld
do
Compute loss components L
pred
, L
di
, L
pl
,
L
pr
, L
sp
, L
cat
.
if DiPACE+ then
if L
i
∈ L
pl
, L
pr
, L
sp
> τ
i
then
L
i
← L
i
(1 +γ
i
);
end
if L
di
< τ
di
then
L
di
← L
di
(1 −γ
di
end
end
Compute total loss L ← L
pred
+ λ
1
· (1 −
L
di
) +λ
2
· L
pl
+ λ
3
· L
pr
+ λ
4
· L
sp
+ L
cat
.
Compute gradients of L w.r.t C.
Update C with gradient descent with
learning rate α.
Apply user-defined constraints.
Compute loss difference ld ← L
t
− L
t−1
.
if t ≥ θ or ld < τ
ld
then
break
end
Increment t.
end
while L < τ
pert
and p < δ do
Perturb C by adding N (0, γ
pert
).
Go to step 2.
if L ≤ τ
pert
then
return C
end
Increment p.
end
return C with lowest L
as shown in Equation 2.
L
i
=
(
L
i
, if L
i
≤ τ
L
i
(1 + γ) , otherwise.
(2)
For diversity, since we aim to maximize this char-
acteristic rather than minimize it, the penalty is ap-
plied by subtracting from the diversity term when it
falls below the threshold, as in Equation 3.
L
di
=
(
L
di
, if L
di
≥ τ
L
di
(1 − γ) , otherwise.
(3)
where γ is the penalty scale factor, and L
i
refers
to the loss term for each component. This penalty
DiPACE: Diverse, Plausible and Actionable Counterfactual Explanations
545

mechanism in DiPACE+ allows for more aggressive
optimization when specific qualities—like proximity,
sparsity, or plausibility—are prioritized, enhancing
DiPACE’s flexibility for real-world applications.
2.2.1 Diversity
Diversity encourages a range of unique, actionable
counterfactuals by maximizing the differences be-
tween CF instances. We follow the diversity mea-
surement proposed by Mothilal et al. (Mothilal et al.,
2020), calculating diversity as the negative determi-
nantal point process (DPP) of a matrix of pairwise
distances D
i j
between CF instances c
i
∈ C. This DPP
approach promotes a broad set of possible outcomes
by increasing the average pairwise distance among in-
stances.
L
di
= d pp
1
1 +
∑
n
l=1
c
il
− c
jl
!
(4)
2.2.2 Plausibility
Plausibility ensures that counterfactuals resemble re-
alistic data points by keeping them close to instances
in the observed dataset X. Following the approach of
Dandl et al. (Dandl et al., 2020), we compute plau-
sibility as the normalized average distance between
each CF instance and its nearest k observed instances,
encouraging CFs that align with the data distribution.
L
pl
=
1
n
n
∑
i=1
1
k
k
∑
j=1
|c
i
− x
j
| − d
min
d
max
− d
min
+ ε
!
(5)
where m is the number of CFs in the set, d
min
and d
max
are the minimum and maximum distances among the
k nearest observed instances, and ε is a small constant
to avoid division by zero.
2.2.3 Proximity
Proximity promotes interpretability by keeping CFs
close to the query instance, minimizing the changes
needed to achieve the desired outcome. We calculate
proximity as the mean element-wise absolute differ-
ence between each feature of the query instance x
q
and the CF instances c
i
∈ C, following the approach
of Wachter et al. (Wachter et al., 2018).
L
pr
=
1
mn
m
∑
i=1
n
∑
j=1
c
i j
− x
q
j
w
(6)
where w is a weighting vector to control the influence
of each feature on proximity based on the inverse me-
dian absolute deviation (MAD).
2.2.4 Sparsity
Sparsity encourages minimal changes between the
query instance and each CF, promoting actionable
and interpretable results. We measure sparsity as the
count of features in each CF instance c
i
that differ
from the query instance x
q
, averaged across the set
C.
L
sp
=
1
mn
m
∑
i=1
n
∑
j=1
(|c
i j
− x
q
j
| ≤ ε) (7)
where (·) is an indicator function that equals 1 when
c
i j
differs from x
q
j
by more than ε and 0 otherwise.
2.2.5 Handling Categorical Variables
Handling categorical variables in counterfactual ex-
planations is challenging due to their discrete nature.
To maintain the validity of one-hot encoded categori-
cal features, we enforce a linear equality constraint in
the loss function, ensuring that all levels of each cate-
gorical variable sum to 1. This constraint iterates over
each categorical variable and penalizes any deviation
from a valid one-hot encoded representation.
L
cat
=
∑
v∈cat
m
∑
i=1
v
end
∑
j=v
start
c
i j
!
− 1
!
2
(8)
where v ∈ cat represents the range of indices for each
categorical variable, and v
start
and v
end
indicate the
first and last indices in the one-hot encoding of each
categorical feature.
2.3 Optimization
To minimize our loss function, we employ the Adam
gradient descent optimizer, chosen for its efficiency
in navigating complex, high-dimensional loss land-
scapes and its ability to incorporate user-defined con-
straints. Adam allows for adaptive learning rates,
which enhances the precision and stability of the op-
timization process in finding high-quality CFX.
However, gradient-based optimization is prone to
becoming trapped in local optima, especially in high-
dimensional spaces. To address this, we introduce a
perturbation mechanism. If the overall loss exceeds a
user-defined threshold after a certain number of iter-
ations, we perturb the CF by adding random noise to
each feature that significantly deviates from the origi-
nal instance. This noise is sampled from a normal dis-
tribution and scaled by a user-defined factor, encour-
aging exploration of alternative solutions that may es-
cape local minima.
The optimization process stops under two con-
ditions: (1) when the overall loss reaches the user-
defined threshold, indicating a sufficiently optimized
ICAART 2025 - 17th International Conference on Agents and Artificial Intelligence
546

solution, or (2) when a maximum number of perturba-
tion attempts have been made without further reduc-
tion in the loss. This approach ensures that the op-
timization converges efficiently while retaining flexi-
bility in finding realistic, actionable CFs.
2.4 User Constraints
While optimizing for proximity, sparsity, plausibility,
and diversity helps ensure that counterfactuals (CFs)
are realistic and feasible, additional real-world restric-
tions may apply in specific contexts. The DiPACE
framework allows users to define these custom con-
straints, tailoring CF generation to meet application-
specific needs and making the explanations more ac-
tionable.
In the DiPACE framework, users can specify the
following constraints:
• Features to Vary. Specifies which features may
be adjusted. This is useful in cases where only
certain features can feasibly be changed (e.g.,
adjusting financial inputs while leaving demo-
graphic data constant). Default: all features are
allowed to vary.
• Immutable Features. Specifies which features
must remain unchanged, accommodating scenar-
ios where some features are fixed (e.g., legal or
physical constraints). Default: no features are set
as immutable.
• Feature Ranges. Defines acceptable value ranges
for certain features, ensuring that CFs remain
within realistic boundaries. Default: features can
range between the minimum and maximum value
in the observed data.
• Feature Directions. Specifies if a feature can
only increase or decrease. This constraint is use-
ful for features where only unidirectional change
is feasible (e.g., increasing years of experience but
not decreasing it). Default: features are allowed
to vary in both directions.
These constraints empower users to generate CFs
that are not only realistic but also contextually rele-
vant, enhancing the practical utility of the DiPACE
framework.
2.5 Datasets
To evaluate the DiPACE framework, we use two
datasets from the UCI Machine Learning Repository,
each representing a real-world scenario where ac-
tionable interventions could realistically influence the
outcome. These datasets cover distinct problem do-
Table 1: Description of the Heart Disease Dataset.
Feature Type Values
Age Cont 29-77
Resting Blood Cont 94-200
Pressure (RBP)
Cholesterol (Chol) Cont 126-564
Maximum Heart Cont 71-202
Rate (MHR)
ST Depression (STD) Cont 0-6.2
Sex Cat 1 or 0
Chest Pain Type (CP) Cat 1-3
Fasting Blood Sugar (FBS) Cat 1 or 0
Rest ECG (RECG) Cat 0-3
Exercise Induced Cat 1 or 0
Angina (EA)
Slope Cat 1-3
Major Vessels Cat 0-3
Coloured
By Flourosopy (CA)
Thal Cat 0-3
Class Cat 1 or 0
mains, allowing us to demonstrate DiPACE’s effec-
tiveness across different types of data and decision
contexts.
The selected datasets are as follows:
• Heart Disease Dataset (Janosi et al., 1988). This
dataset contains 303 instances with 13 features, of
which 5 are continuous and 8 are categorical, as
described in Table 1. The target variable is binary,
indicating the presence or absence of heart dis-
ease. This dataset is well-suited for counterfactual
analysis, as many features (e.g., cholesterol level,
blood pressure) represent factors that can be mod-
ified to reduce disease risk.
• Credit Approval Dataset (Quinlan, 2014). This
dataset consists of 690 instances with 14 features,
4 of which are continuous and 10 are categorical,
as described in Table 2. The binary target vari-
able indicates whether a credit application is ap-
proved or denied. This dataset provides a relevant
test case for counterfactual explanations, as cer-
tain features (e.g., income, debt-to-income ratio)
can feasibly be adjusted by applicants to improve
their approval chances.
Our selection prioritizes datasets that provide re-
alistic examples of CFX applications, over concerns
with dataset dimensionality or size. DiPACE is mini-
mally affected by dataset size, as it requires only the
query instance and the k nearest instances for eval-
uating plausibility, reducing dependency on the full
dataset. Additionally, each of DiPACE’s metrics is
normalized by the number of features, ensuring that
DiPACE: Diverse, Plausible and Actionable Counterfactual Explanations
547

Table 2: Description of the Credit Approval Dataset.
Feature Type Values
Age Cont 13.75-80.25
Debt Cont 0-28
Years Employed (YE) Cont 0-28.5
Income (Inc) Cont 0-100k
Sex Cat 1 or 0
Marital Status (MS) Cat 1 or 0
Bank Customer (BC) Cat 1 or 0
Industry (Ind) Cat 0-13
Prior Default (PD) Cat 1 or 0
Employed (Emp) Cat 1 or 0
Credit Score (CS) Cat 0-6
Driving License (DL) Cat 1 or 0
Citizen (Cit) Cat 0-2
Class Cat 1 or 0
performance remains consistent regardless of the di-
mensionality or size of the data. This focus on realis-
tic applications allows us to demonstrate DiPACE’s
utility in real-world scenarios, particularly its abil-
ity to deliver actionable counterfactuals in scenar-
ios where meaningful changes to outcomes can be
achieved.
2.6 Experimental Setup
We conducted our experiments on a 1.4 GHz Quad-
Core Intel Core i5 CPU with 8GB of RAM, using
Python 3.9 and PyTorch 2.2.2 on macOS Sonoma
14.4. To ensure reproducibility, we set a random seed
of 42 for both NumPy and PyTorch.
2.6.1 Predictive Model
The predictive model used in our experiments is a
fully connected neural network with an input layer, a
64-neuron hidden layer, a 32-neuron hidden layer, and
an output layer with sigmoid activation. This specific
architecture was selected for simplicity, as any dif-
ferentiable model could function similarly within the
DiPACE framework.
2.6.2 Evaluation Metrics
We quantitatively evaluate DiPACE+ using four core
metrics—diversity, plausibility, proximity, and spar-
sity—without MAD weighting, providing insight into
how well DiPACE+ balances these qualities relative
to alternative approaches. Additionally, we mea-
sure counterfactual prediction confidence to assess
the likelihood of correctly reversing the classification,
offering further perspective on counterfactual quality.
2.6.3 Hyperparameter Tuning
Hyperparameters were optimized via grid search to
identify the best-performing configurations. We used
consistent λ values of 0.5 for both datasets after test-
ing values in the range of 0.3–1.0. The optimized val-
ues for other hyperparameters are as follows:
• γ
pen
set at 0.1 (range: 0.1–0.5)
• γ
pert
set at 0.5 (range: 0.3–0.7)
• τ
div
set at 0.9 (range: 0.7–1.0)
• τ
plaus
set at 1.5 for heart disease and 1.0 for credit
approval (range: 0.6–2.0)
• τ
prox
set at 0.5 for heart disease and 0.2 for credit
approval (range: 0.1–0.7)
• τ
spars
set at 0.4 for heart disease and 0.2 for credit
approval (range: 0.1–0.7)
• τ
pert
set at 1.0 for heart disease and 0.8 for credit
approval (range: 0.5–1.5)
The learning rate was set to 0.005 after testing val-
ues from 0.001 to 0.1, and the maximum number of
iterations was set to 100,000. The actual number of
iterations required is shown in Fig. 1.
2.6.4 Comparative Algorithms
In our final experiment, we compare DiPACE+ with
the original DiPACE and three state-of-the-art al-
gorithms: Wachter (Wachter et al., 2018), DiCE
(Mothilal et al., 2020), and CARE (Rasouli and
Chieh Yu, 2024). Wachter is included as a founda-
tional baseline in counterfactual generation, DiCE as
a widely used CFX tool, and CARE as a recent multi-
objective genetic optimization approach. Each algo-
rithm is implemented using its respective published
Python library.
3 RESULTS AND ANALYSIS
3.1 Loss Function Ablation Study
To evaluate the effectiveness of the proposed loss
function in achieving balanced CFX, we conduct an
ablation study of the four key characteristics: diver-
sity, plausibility, proximity, and sparsity, as well as
the confidence of the model in its counterfactual clas-
sification. The results, shown in Table 3, explore
combinations of these characteristics to demonstrate
their individual and collective impact on CF quality.
Proximity is included in every combination, as it is
fundamental to any CFX algorithm. We consider the
ICAART 2025 - 17th International Conference on Agents and Artificial Intelligence
548

Table 3: Ablation Study of Loss Function Terms for Each
Dataset.
Div. Plaus. Prox. Spars. Conf.
Heart Disease
1 0.61 0.84 0.19 0.23 0.67
2 0.87 0.67 0.15 0.23 0.75
3 0.88 0.22 0.32 0.36 0.84
4 0.70 0.81 0.18 0.29 0.64
5 0.89 0.20 0.43 0.41 0.84
6 0.92 0.97 0.47 0.46 0.57
7 0.91 0.26 0.43 0.43 0.87
8 0.95 0.44 0.36 0.39 0.88
Credit Approval
1 0.79 0.47 0.14 0.19 0.70
2 0.84 0.74 0.17 0.23 0.74
3 0.93 0.16 0.22 0.26 0.77
4 0.01 0.54 0.09 0.12 0.66
5 0.91 0.21 0.17 0.21 0.68
6 0.95 0.93 0.27 0.28 0.57
7 0.91 0.10 0.22 0.26 0.81
8 0.92 0.06 0.18 0.20 0.73
following combinations: (1) Proximity, (2) Proxim-
ity and Diversity, (3) Proximity and Plausibility, (4)
Proximity and Sparsity, (5) Proximity, Diversity, and
Plausibility, (6) Proximity, Diversity, and Sparsity, (7)
Proximity, Plausibility, and Sparsity, and (8) Proxim-
ity, Diversity, Plausibility, and Sparsity.
The results indicate that including all four charac-
teristics (combination 8) achieves the most balanced
CF set. For the heart disease dataset, this configura-
tion yields a high diversity score of 0.95, a low plausi-
bility score of 0.44, and relatively low proximity and
sparsity scores of 0.36 and 0.39, respectively, along
with a high confidence score of 0.88. Similarly, for
the credit approval dataset, combination 8 achieves
high diversity of 0.92, low plausibility of 0.06, and
suitably low proximity and sparsity scores of 0.18 and
0.20, with a confidence score of 0.73.
The ablation study also reveals interactions be-
tween the different characteristics. For example, ex-
cluding certain characteristics often results in higher
values for others, illustrating the flexibility of the pro-
posed approach. In particular, plausibility is weak-
est in combination 6 (Proximity, Diversity, and Spar-
sity), where the lack of plausibility optimization can
lead to less alignment with the data distribution. Ad-
ditionally, proximity and sparsity scores tend to be
lower when both characteristics are included, as spar-
sity generally supports closer CFs by reducing feature
modifications. However, the inclusion of diversity can
increase both proximity and sparsity scores due to the
conflicting goals of promoting variation while keep-
ing CFs similar to the original instance.
Notably, the proximity and sparsity values are
generally lower and less variable for the credit ap-
proval dataset compared to the heart disease dataset.
This difference may be attributed to the higher pro-
portion of continuous features in the heart disease
dataset, which can result in more pronounced changes
in CFs. This finding highlights the importance of tun-
ing hyperparameters, such as τ and δ, to suit the spe-
cific characteristics of each dataset.
Overall, the results show that the inclusion of
all four characteristics best promotes a balanced set
of counterfactuals, reinforcing the versatility of Di-
PACE+ in generating feasible, actionable, and diverse
CFs across datasets.
3.2 Optimization Strategy
Fig. 1 shows the loss curves for both datasets through-
out the optimization process, illustrating the impact
of perturbation on reaching a lower loss. The vertical
dashed lines indicate points of perturbation. Follow-
ing each perturbation, the loss values generally show a
marked reduction, demonstrating the effectiveness of
this approach in escaping local optima and progress-
ing towards a more globally optimal solution. With-
out perturbation, the loss tends to plateau early, as
observed in the convergence at the first perturbation
point in each subfigure, highlighting the limitations
of standard gradient descent.
Table 4 presents the values for diversity, plau-
sibility, proximity, sparsity, and confidence for the
CFs generated with and without perturbation. The
results show that including perturbation consistently
yields improved values for most metrics across both
datasets. For instance, the diversity and confidence
scores are higher with perturbation, which indicates
that the CFs generated are both more varied and
more likely to meet the desired outcome. Addition-
ally, lower proximity and sparsity values are achieved,
demonstrating that CFs are closer to the original in-
stance and involve fewer feature changes, thus en-
hancing interpretability and feasibility. Furthermore,
lower plausibility scores demonstrate that the inclu-
sion of perturbations drives the optimization towards
a CF outcome that is closer to existing instances in the
dataset, and so are more realistic for potential imple-
mentation.
These results emphasize the impact of includ-
ing perturbation in the gradient descent process for
achieving a more globally optimal solution. By per-
turbing instances that show signs of converging pre-
maturely, the optimization escapes local optima and
continues to improve. This process allows DiPACE+
to achieve a desirable balance across key metrics,
DiPACE: Diverse, Plausible and Actionable Counterfactual Explanations
549
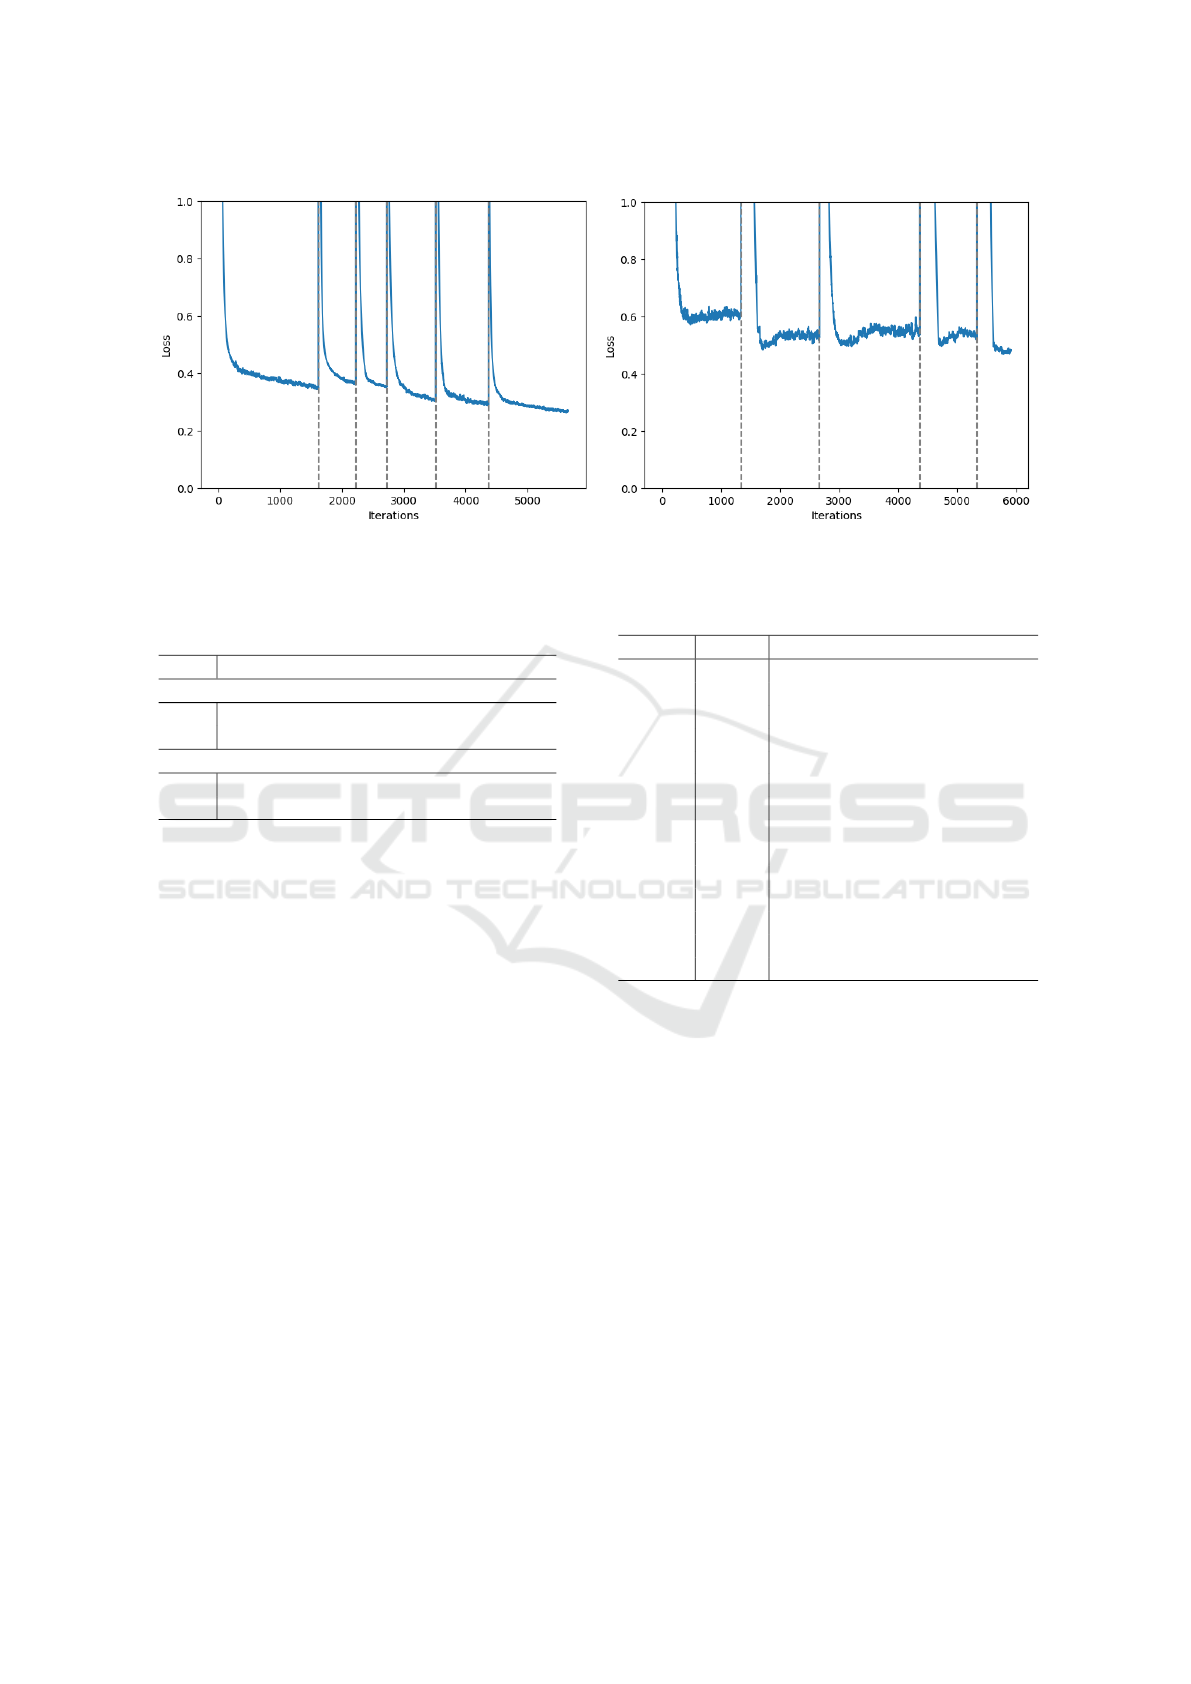
(a) . (b) .
Figure 1: Loss Curves for (a) heart disease, and (b) credit approval. The vertical dashed lines represent points of perturbation.
Table 4: Results with and without Perturbation in the Opti-
mization Strategy for Each Dataset.
Div. Plaus. Prox. Spars. Conf.
Heart Disease
W/ 0.95 0.44 0.36 0.39 0.88
W/o 0.92 0.63 0.49 0.45 0.83
Credit Approval
W/ 0.93 0.35 0.18 0.20 0.73
W/o 0.91 0.44 0.20 0.22 0.71
yielding counterfactuals that are both feasible and ac-
tionable.
In contrast, existing methods of CF generation of-
ten rely on gradient-based optimization alone, which
can result in suboptimal solutions due to convergence
at local optima. Alternatively, some methods use
model-agnostic optimization techniques like genetic
algorithms or shortest-path algorithms, which avoid
the pitfalls of local optima but sacrifice precision due
to the lack of access to model gradients. Our approach
demonstrates that gradient information can be lever-
aged effectively while mitigating convergence issues,
achieving a solution that balances diversity, plausibil-
ity, proximity, and sparsity with improved confidence
in the counterfactual outcome.
Overall, the perturbation-enhanced optimization
strategy in DiPACE+ enables a more refined explo-
ration of the solution space, combining the precision
of gradient-based methods with the flexibility to es-
cape local optima, as evidenced by the improved met-
rics observed in Table 4.
3.3 Qualitative Analysis
An example CF set generated by DiPACE+ is pre-
sented in Table 5 for heart disease and Table 6 for
Table 5: Example CF Set for Heart Disease.
Query CF Values
Age 52 60 45 44 52 53
RBP 172 128 122 140 132 144
Chol 199 229 222 257 255 226
MHR 162 130 186 156 168 111
STD 0.5 2.6 0.0 0.5 0.0 0.8
Sex 1 1 1 1 1 1
CP 2 0 0 2 0 0
FBS 1 0 0 0 0 0
RECG 1 0 0 0 1 0
EA 0 1 0 0 1 1
Slope 2 1 2 2 2 2
CA 0 2 0 0 0 0
Thal 3 3 2 2 3 3
Class 1 0 0 0 0 0
credit approval. These results illustrate how Di-
PACE+ adjusts key features to achieve the desired
shift in prediction outcome. For heart disease, blood
pressure (F2) is consistently reduced across most
counterfactuals, reflecting its critical role in improv-
ing cardiovascular health. Maximum heart rate (F4)
shows varied adjustments, suggesting an interaction
with other health indicators to optimize the out-
come. Cholesterol (F3) levels generally show slight
increases, implying that the original values may be
within acceptable limits, or that improvements in
other features offset these changes. Adjustments to
age (F1) are varied, indicating the model’s adaptive
approach based on the holistic health profile. Cat-
egorical features such as sex (F6) and cardiac con-
ditions (F7–F12) show minimal changes, suggesting
they may already be optimized or constrained due to
limited flexibility.
For credit approval, age (F1) is generally in-
ICAART 2025 - 17th International Conference on Agents and Artificial Intelligence
550

Table 6: Example CF Set for Credit Approval.
Query CF Values
Age 23.5 48.1 27.7 42.2 24.8 37.4
Debt 2.75 3.0 2.4 5.0 6.0 2.5
YE 4.5 1.01 1.97 9.0 1.63 1.16
Inc 25 27 35 22 24 30
Sex 1 0 1 1 1 1
MS 1 1 1 1 1 1
BC 1 1 1 1 1 1
Ind 6 1 7 9 4 7
Race 2 0 4 1 4 4
PD 0 1 1 1 1 1
Emp 0 0 0 0 1 0
CS 0 0 0 0 3 0
DL 0 0 0 1 0 1
Cit 0 0 1 0 0 0
Class 0 1 1 1 1 1
creased, suggesting a preference for older applicants,
possibly indicating financial stability. Debt levels
(F2) vary, suggesting that it can be acceptable in cer-
tain cases depending on other factors. Years em-
ployed (F3) is mostly reduced, except for one instance
with a significant increase, indicating that while em-
ployment stability is important, it interacts with other
features in determining creditworthiness. Income
(F4) is slightly adjusted, implying that it was initially
near an acceptable threshold. Prior default (F10) con-
sistently switches to 1, highlighting its significant im-
portance in reversing predictions. Variations in indus-
try (F8) and ethnicity (F9) indicate their potential in-
fluence on approval outcomes, with the variations in
ethnicity indicating potential bias learned by the un-
derlying model.
3.4 User Constraints
User constraints are applied to reflect realistic,
domain-specific restrictions for both datasets. These
constraints ensure that generated CFs remain feasible,
relevant, and ethically aligned with real-world scenar-
ios.
For the heart disease dataset, certain attributes are
immutable as they are inherent to the patient or part
of their medical history. Specifically:
• Sex, chest pain type (cp), and exercise-induced
angina (exang) are immutable due to their fixed
nature in a patient’s medical profile.
• Age can only increase, as it is not realistic to de-
crease it in counterfactual analysis.
• Since maximum heart rate (thalach) is dependent
on age (calculated as 200 − age), its upper bound
is set to 168 (200 − 52) and lower bound to the
Table 7: Quantitative Results of Applying User Constraints
with Heart Disease Data.
Div. Plaus. Prox. Spars. Conf.
Heart Disease
Con. 0.75 0.73 0.29 0.34 0.80
Uncon. 0.95 0.44 0.36 0.39 0.88
Credit Approval
Con. 0.16 0.78 0.11 0.12 0.62
Uncon. 0.93 0.35 0.18 0.20 0.73
dataset’s minimum value of 94.
• Other lifestyle-related features (e.g., blood pres-
sure, cholesterol) are mutable, reflecting the po-
tential for modification through lifestyle changes
or medical interventions.
For the credit approval dataset, specific features
are constrained based on inherent or historical char-
acteristics of the individual:
• Gender, ethnicity, and citizenship are immutable
as they represent fixed personal attributes.
• Prior default is also immutable, as it reflects past
financial behavior.
• Age and years employed can only increase, as
these values realistically grow over time.
• For demonstration, we hypothetically constrain
income to a maximum value of 100, reflecting a
plausible earning limit based on qualifications and
experience.
Table 7 shows quantitative performance compar-
isons with and without user constraints.
Applying these constraints impacts the quantita-
tive results, as shown in Table 7. Notably, proximity
and sparsity improve across both datasets when con-
straints are applied, as fewer features are allowed to
change, leading to CFs that remain closer to the orig-
inal instance. Diversity and plausibility decrease, es-
pecially in the credit approval dataset, where diver-
sity drops from 0.93 to 0.16 and plausibility rises sig-
nificantly to 0.78. This is due to the restricted range
of changes, which limits variation and makes it chal-
lenging for CFs to align with typical instances in the
data distribution. Confidence is slightly reduced in the
constrained CFs, as fewer features are able to shift,
making it harder for the CFs to meet all desired con-
ditions for class reversal. For example, in the heart
disease dataset, confidence drops from 0.88 to 0.80,
reflecting that restricted features may limit the classi-
fier’s certainty in outcome changes.
Example CFs with the described user constraints
applied are shown in Tables 8 and 9. In the heart dis-
ease example, immutable attributes (sex, chest pain
DiPACE: Diverse, Plausible and Actionable Counterfactual Explanations
551

Table 8: Example CF Set for Heart Disease with User Con-
straints.
Query CF Values
Age 52 57 52 58 52 54
RBP 172 150 138 140 138 124
Chol 199 196 196 211 256 258
MHR 162 163 163 157 156 150
STD 0.5 1.6 0.1 1.2 0.4 0.4
Sex 1 1 1 1 1 1
CP 2 2 2 2 2 2
FBS 1 0 0 1 0 0
RECG 1 1 0 0 0 0
EA 0 0 0 0 0 0
Slope 2 2 2 2 2 1
CA 0 0 0 0 0 0
Thal 3 2 2 2 2 3
Class 1 0 0 0 0 0
Table 9: Example CF Set for Credit Approval with User
Constraints.
Query CF Values
Age 23.5 50.8 31.3 69.2 50.8 35.2
Debt 2.8 2.3 1.1 5.0 2.3 3.4
YE 4.5 4.8 4.5 6.5 4.5 8.2
Inc 25 11 25 22 51 29
Sex 1 1 1 1 1 1
MS 1 1 1 1 1 1
BC 1 1 1 1 1 1
Ind 6 13 13 6 13 13
Race 2 2 2 2 2 2
PD 0 0 0 0 0 0
Emp 0 0 1 1 0 0
CS 0 0 3 7 0 7
DL 0 0 0 0 0 1
Cit 0 0 0 0 0 0
Class 0 1 1 1 1 1
type) remain unchanged, and age is adjusted only up-
ward. Similarly, in the credit approval example, im-
mutable attributes (gender, ethnicity, citizenship, and
prior default) are preserved, and features such as age
and years employed increase in line with this real
world constraint.
Overall, these results demonstrate that DiPACE+
effectively balances the need for actionable counter-
factuals with user-defined constraints. While diversity
and plausibility may be weaker due to fixed attributes,
the model retains flexibility in generating CFs that
meet realistic constraints, demonstrating its applica-
bility for real-world, constraint-based scenarios.
Table 10: Comparison of DiPACE+ and DiPACE with Pre-
vious Work.
Div. Plaus. Prox. Spars. Conf.
Heart Disease
DiPACE+ 0.95 0.44 0.36 0.39 0.88
DiPACE 0.88 0.58 0.44 0.43 0.83
Wachter 0.31 0.83 0.02 0.17 0.75
DiCE 0.82 0.96 0.16 0.25 0.88
CARE 0.77 0.85 0.44 0.48 0.89
Credit Approval
DiPACE+ 0.93 0.35 0.18 0.20 0.73
DiPACE 0.92 0.57 0.18 0.21 0.75
Wachter 0.35 0.74 0.03 0.10 0.56
DiCE 0.84 0.69 0.12 0.28 0.64
CARE 0.68 0.63 0.18 0.56 0.66
3.5 Comparison of Algorithms
To evaluate the quality of DiPACE+, we benchmark
its performance against DiPACE and three state-of-
the-art CFX algorithms: Wachter, DiCE, and CARE.
The comparative results are presented in Table 10.
Across both datasets, DiPACE+ achieves the highest
scores in diversity and plausibility, with strong per-
formance in proximity and sparsity, indicating a bal-
anced generation of CFs that are diverse, realistic, and
reasonably close to the original instance.
The Wachter algorithm obtains the lowest diver-
sity scores but outperforms all other methods in prox-
imity and sparsity. This result is consistent with
Wachter’s design, which optimizes only for proxim-
ity, resulting in highly similar CFs that minimize fea-
ture changes. However, this focus on proximity limits
diversity and, as observed, leads to weaker plausibil-
ity, as the generated CFs may not align well with re-
alistic instances in the observed data distribution.
DiCE and CARE perform moderately well in di-
versity and proximity, though both score lower than
DiPACE+ in diversity. DiCE achieves higher prox-
imity values than CARE, but both perform less effec-
tively in plausibility, yielding CFs that are less similar
to observed instances. This highlights the importance
of explicitly incorporating plausibility into the loss
function for generating realistic CFs. DiPACE+’s en-
hanced plausibility indicates a greater alignment with
real-world data patterns, making its CFs more action-
able and relevant for practical applications.
For all metrics except confidence, DiPACE+ con-
sistently outperforms DiPACE, demonstrating the ef-
fectiveness of its additional penalty term in balancing
key characteristics, resulting in CFs that are both real-
istic and close to the query instance. However, the in-
clusion of this penalty term introduces a slight trade-
off in confidence, as observed by a modest decrease
ICAART 2025 - 17th International Conference on Agents and Artificial Intelligence
552

compared to DiPACE. This suggests that DiPACE+
prioritizes CF diversity and feasibility over prediction
certainty, which may be desirable depending on ap-
plication needs.
Overall, DiPACE+ achieves the most balanced
performance across the metrics, illustrating its ability
to generate CFs that are diverse, realistic, and feasi-
ble, while maintaining reasonable confidence in the
outcome. These results highlight DiPACE+ as a ro-
bust solution for CF generation in real-world contexts
where multiple qualities, including plausibility and
diversity, are essential for actionable insights.
4 CONCLUSION
This study introduces DiPACE and DiPACE+, novel
algorithms for generating counterfactual explanations
that achieve a balanced optimization of diversity,
plausibility, proximity, and sparsity, advancing the
field of counterfactual explanation (CFX). By inte-
grating these characteristics into the loss function and
using an optimization strategy that combines gradient
descent with perturbations, our approach successfully
escapes local optima, producing CF sets that are both
realistic and actionable. Experimental results on heart
disease and credit approval datasets demonstrate that
DiPACE+ consistently outperforms existing CFX al-
gorithms in achieving diverse and plausible CFs, par-
ticularly excelling in scenarios with complex interac-
tions among features. The practical applications of
DiPACE+ extend to various fields where actionable
and realistic CFs are essential, such as healthcare, fi-
nance, and user-focused AI systems. For stakehold-
ers like data scientists and machine learning engi-
neers, DiPACE+ provides deeper insights into model
behavior and potential biases, enhancing transparency
and interpretability in critical decision-making appli-
cations.
Future work should aim to improve the conver-
gence efficiency of the optimization strategy. While
perturbations are effective for escaping local optima,
they can increase convergence time; thus, exploring
adaptive or hybrid optimization approaches may yield
faster results. Additionally, extending DiPACE+ to
handle more complex data types, such as time series
and high-dimensional image data, would broaden its
applicability. Future research could also focus on de-
veloping evaluation metrics that more precisely cap-
ture the trade-offs among diversity, plausibility, prox-
imity, and sparsity, as well as assessing DiPACE+’s
impact on user trust and understanding in interactive
settings.
REFERENCES
Alatabani, L. E. and Saeed, R. A. (2025). Xai applica-
tions in autonomous vehicles. In Explainable Artifi-
cial Intelligence for Autonomous Vehicles, pages 73–
99. CRC Press.
Babaei, G., Giudici, P., and Raffinetti, E. (2023). Explain-
able fintech lending. Journal of Economics and Busi-
ness, 125:106126.
Carrizosa, E., Ram
´
ırez-Ayerbe, J., and Romero Morales,
D. (2024). Generating collective counterfactual ex-
planations in score-based classification via mathemat-
ical optimization. Expert Systems with Applications,
238:121954.
Cheng, F., Ming, Y., and Qu, H. (2021). Dece: Decision
explorer with counterfactual explanations for machine
learning models. IEEE Transactions on Visualization
and Computer Graphics, 27(2):1438–1447.
Dandl, S., Molnar, C., Binder, M., and Bischl, B. (2020).
Multi-objective counterfactual explanations. In Pro-
ceedings of the International Conference on Paral-
lel Problem Solving from Nature, pages 448–469.
Springer.
Del Ser, J., Barredo-Arrieta, A., D
´
ıaz-Rodr
´
ıguez, N., Her-
rera, F., Saranti, A., and Holzinger, A. (2024). On gen-
erating trustworthy counterfactual explanations. Infor-
mation Sciences, 655:119898.
El Qadi, A., Trocan, M., Diaz-Rodriguez, N., and Frossard,
T. (2023). Feature contribution alignment with ex-
pert knowledge for artificial intelligence credit scor-
ing. Signal, Image and Video Processing, 17(2):427–
434.
Guidotti, R. (2022). Counterfactual explanations and how to
find them: literature review and benchmarking. Data
Mining and Knowledge Discovery, 36.
Janosi, A., Steinbrunn, W., Pfisterer, M., and Detrano, R.
(1988). Heart Disease. UCI Machine Learning Repos-
itory. DOI: https://doi.org/10.24432/C52P4X.
Jiang, J., Leofante, F., Rago, A., and Toni, F. (2024). Ro-
bust counterfactual explanations in machine learning:
A survey. arXiv preprint arXiv:2402.01928.
Kumar, P., Wazid, M., Singh, D., Singh, J., Das, A. K., Park,
Y., and Rodrigues, J. J. (2023). Explainable artificial
intelligence envisioned security mechanism for cyber
threat hunting. Security and Privacy, 6(6):e312.
Mirzaei, S., Mao, H., Al-Nima, R. R. O., and Woo, W. L.
(2023). Explainable ai evaluation: A top-down ap-
proach for selecting optimal explanations for black
box models. Information, 15(1):4.
Mothilal, R. K., Sharma, A., and Tan, C. (2020). Explain-
ing machine learning classifiers through diverse coun-
terfactual explanations. In Proceedings of the 2020
Conference on Fairness, Accountability, and Trans-
parency, pages 607–617. ACM.
Nadeem, A., Vos, D., Cao, C., Pajola, L., Dieck, S., Baum-
gartner, R., and Verwer, S. (2023). Sok: Explainable
machine learning for computer security applications.
In Proceedings of the IEEE 8th European Symposium
on Security and Privacy (EuroS&P), pages 221–240.
IEEE.
DiPACE: Diverse, Plausible and Actionable Counterfactual Explanations
553

Poyiadzi, R., Sokol, K., Santos-Rodriguez, R., De Bie,
T., and Flach, P. (2020). Face: feasible and action-
able counterfactual explanations. In Proceedings of
the AAAI/ACM Conference on AI, Ethics, and Society,
pages 344–350.
Quinlan, J. R. (2014). Credit Approval. UCI
Machine Learning Repository. DOI:
https://doi.org/10.24432/C5FS30.
Rasouli, P. and Chieh Yu, I. (2024). Care: Coherent ac-
tionable recourse based on sound counterfactual ex-
planations. International Journal of Data Science and
Analytics, 17(1):13–38.
Rawlley, O. and Gupta, S. (2023). Artificial intelligence-
empowered vision-based self driver assistance sys-
tem for internet of autonomous vehicles. Transac-
tions on Emerging Telecommunications Technologies,
34(2):e4683.
Sanderson, J., Mao, H., Abdullah, M. A., Al-Nima, R.
R. O., and Woo, W. L. (2023a). Optimal fusion of
multispectral optical and sar images for flood inunda-
tion mapping through explainable deep learning. In-
formation, 14(12):660.
Sanderson, J., Mao, H., Tengtrairat, N., Al-Nima, R., and
Woo, W. (2024). Explainable deep semantic segmen-
tation for flood inundation mapping with class activa-
tion mapping techniques. In Proceedings of the 16th
International Conference on Agents and Artificial In-
telligence, volume 3 of ICAART, pages 1028–1035.
Scitepress.
Sanderson, J., Tengtrairat, N., Woo, W. L., Mao, H., and
Al-Nima, R. R. (2023b). Xfimnet: an explainable
deep learning architecture for versatile flood inunda-
tion mapping with synthetic aperture radar and multi-
spectral optical images. International Journal of Re-
mote Sensing, 44(24):7755–7789.
Schleich, M., Geng, Z., Zhang, Y., and Suciu, D. (2021).
Geco: Quality counterfactual explanations in real
time. In Proceedings of the VLDB Endowment, pages
1681–1693.
Shin, H., Park, J. E., Jun, Y., Eo, T., Lee, J., Kim, J. E.,
Lee, D. H., Moon, H. H., Park, S. I., Kim, S., et al.
(2023). Deep learning referral suggestion and tumour
discrimination using explainable artificial intelligence
applied to multiparametric mri. European Radiology,
33:1–12.
Starkey, A. and Ezenkwu, C. P. (2023). Towards au-
tonomous developmental artificial intelligence: Case
study for explainable ai. In Proceedings of the
IFIP International Conference on Artificial Intelli-
gence Applications and Innovations, pages 94–105.
Springer.
Tsiourvas, A., Sun, W., and Perakis, G. (2024). Manifold-
aligned counterfactual explanations for neural net-
works. In International Conference on Artificial In-
telligence and Statistics, pages 3763–3771. PMLR.
Wachter, S., Mittelstadt, B., and Russell, C. (2018). Coun-
terfactual explanations without opening the black box:
Automated decisions and the gdpr. Harvard Journal
of Law and Technology, 31.
Yagin, F. H., Cicek,
˙
I. B., Alkhateeb, A., Yagin, B., Co-
lak, C., Azzeh, M., and Akbulut, S. (2023). Ex-
plainable artificial intelligence model for identifying
covid-19 gene biomarkers. Computers in Biology and
Medicine, 154:106619.
Zhu, X., Chu, Q., Song, X., Hu, P., and Peng, L. (2023). Ex-
plainable prediction of loan default based on machine
learning models. Data Science and Management, 6.
ICAART 2025 - 17th International Conference on Agents and Artificial Intelligence
554
