
Adaptive Interaction Field Framework for Risk-Aware Navigation of
Driverless Minibus in Pedestrian Zones
Qazi Hamza Jan and Karsten Berns
RPTU Kaiserslautern-Landau, Erwin-Schr
¨
odinger-Straße 52, 67663, Kaiserslautern, Germany
Keywords:
Mapping, Autonomous Driving, Pedestrian Zone, Risk Assessment.
Abstract:
In complex pedestrian zones, the navigation of driverless minibuses faces significant challenges due to vary-
ing environmental structures and pedestrian behavior. These zones range from organized pathways to open,
unstructured spaces with minimal navigational cues. To address this, dynamic interaction fields are developed
around the driverless minibus, adapting in size and shape to real-time movements. To achieve a similar rep-
resentation as vehicle, interaction fields are developed that incorporate pedestrian unawareness. These virtual
fields facilitate safer and more intuitive interactions between vehicles and pedestrians by incorporating real-
time pedestrian awareness and activity data. The proposed model assesses risk by aggregating grid values
from overlapping zones between pedestrians and driverless minibus, computing potential encounters based on
spatial positions and awareness levels. A gradient-based heat map visualizes risk, highlighting areas where
interaction with pedestrians is needed. This adaptive approach enables the decision-making module to initiate
appropriate responses, such as escape maneuvers or interaction mode activation, based on risk thresholds. The
interaction field further classifies risk into ambient, direct, or critical levels, guiding the system’s reactions.
This framework enhances safety protocols and situational awareness in diverse urban environments. The vehi-
cle was able to drive and interaction in a better way with enabled interaction fields. Based on these risk values,
various interaction modules were activated, facilitating meaningful and context-aware interactions with pedes-
trians.
1 INTRODUCTION
The inclusion of driverless minibuses in pedestrian
zones is becoming an exciting area for the au-
tomotive industry and researchers (Jan and Berns,
2023),(Nesheli et al., 2021),(Milan
´
es et al., 2020).
With the expansion of pedestrian zones and narrow
spaces, driverless minibuses offer quick and flexible
transport between buildings in shared spaces. Safety
becomes a primary concern when navigating through
crowds. In one of our previous works (Jan and Berns,
2021), a hardwired safety system was configured to
prevent collisions. This fail-safe system directly en-
abled emergency braking in case of routine malfunc-
tions. To ensure smooth navigation and avoid abrupt
safety braking due to pedestrians’ presence within the
field, risky pedestrians need to be informed about the
vehicle and give way in advance.
Risky pedestrians are defined by their unaware-
ness of the driverless minibus. This unawareness
could stem from several reasons, such as being en-
gaged in conversation, talking/texting on the phone,
or walking in the same direction ahead of the vehicle.
In such cases, it is necessary to interact with pedes-
trians to alert them using various interaction mod-
ules (Jan et al., 2023), (Rasouli and Tsotsos, 2019).
There exists a spectrum of structural variation in
pedestrian zones based on the intended use and level
of pedestrian and vehicle integration. This enforces
different walking and driving behaviors in pedestri-
ans and vehicle, respectively. To understand the riski-
ness of pedestrians around the vehicle, we introduce a
novel method of understanding riskiness of pedestri-
ans in maps by creating virtual dynamic fields around
the vehicle. Such dynamic fields, also known as ve-
hicle interaction fields serve dual purpose, to improve
safety and enable useful interaction between vehicle
and pedestrians. This helped in better driving and
efficient interaction. To understand the riskiness of
pedestrians in the map, their riskiness is presented as
dynamic fields. Next section presents the inspiration
and concept of interaction field for driverless mini.
Section 3 provides the implementation of the concept.
Integrated results from vehicle-pedestrian interaction
382
Jan, Q. H. and Berns, K.
Adaptive Interaction Field Framework for Risk-Aware Navigation of Driverless Minibus in Pedestrian Zones.
DOI: 10.5220/0013221400003941
Paper published under CC license (CC BY-NC-ND 4.0)
In Proceedings of the 11th International Conference on Vehicle Technology and Intelligent Transport Systems (VEHITS 2025), pages 382-389
ISBN: 978-989-758-745-0; ISSN: 2184-495X
Proceedings Copyright © 2025 by SCITEPRESS – Science and Technology Publications, Lda.
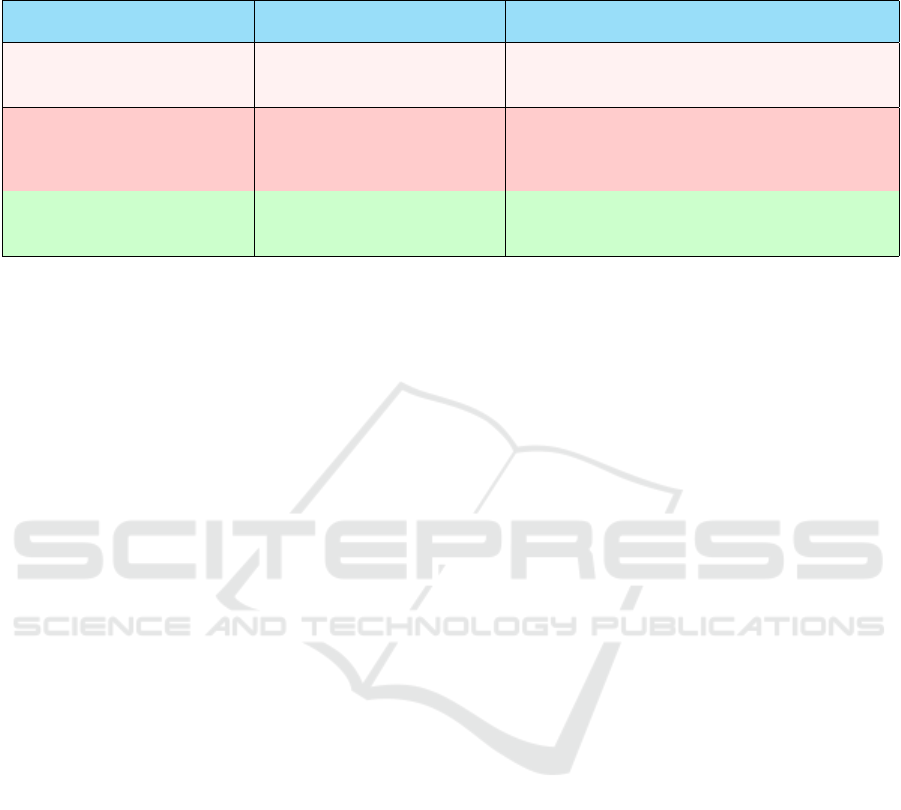
Table 1: Translation of four interaction phases to three zones for driverless minibus. Implicit and subtle interactions from the
phased interaction (Vogel and Balakrishnan, 2004) are combined into direct interaction within the smart interaction zone in
this work.
Phased Interaction Smart Interaction Zones Purpose in Vehicle for Interaction
Ambient Display Ambient General awareness, signals vehicle presence
passively to pedestrians
Implicit Interaction Direct Overt communication with pedestrians
Subtle Interaction
Personal Interaction Risk Critical response measures for pedestrian
safety
field are shown in Section 5.
2 PEDESTRIAN ENGAGEMENT
THROUGH PHASED
INTERACTION ZONES
The interaction field is made into different phases,
since this allows to have specific interaction for
pedestrians with specific risk values and different dis-
tance to vehicle. The phase interaction was inspired
from Vogel et. al. (Vogel and Balakrishnan, 2004).
The authors have shown a fluid interaction strategy
from distant to close interaction. In the literature,
these phases are Ambient Display, Implicit Interac-
tion, Subtle Interaction, and Personal Interaction. The
ambient display initially presents general information
passively, shifting to implicit interaction as a user ap-
proaches to offer personalized notifications. During
this phase, simple gestures enable shared use while
maintaining an overview. In the personal interaction
phase, users can engage directly via touch for detailed
information. To the best of our knowledge, no exist-
ing research considers pedestrians’ unawareness as a
risk factor rather than treating them solely as conven-
tional obstacles.
This paper proposes ”Interaction Field Zones”
based on (Vogel and Balakrishnan, 2004) phased in-
teraction framework to enhance communication with
pedestrians. It translates the four phases into three
zones as shown in Table 1. The model transitions
from ambient awareness to direct engagement, estab-
lishing a natural communication channel. In the ba-
sic zone, similar to an ”Ambient Display,” the vehicle
passively signals its presence to ensure pedestrians
are aware without direct interaction. As pedestrians
approach, entering an ”ambient interaction” phase,
the vehicle dynamically adjusts its behavior based on
their speed and path to convey subtle intentions. In the
”direct interaction” phase, it uses visual or auditory
cues to communicate actions and prioritize pedestrian
safety. In complex scenarios, it switches to a ”risk”
mode with emergency measures like braking to en-
sure safety. These interaction zones improve commu-
nication, safety, and trust, adapting to varying pedes-
trian environments and aligning with human interac-
tion paradigms.
3 INTERACTION FIELD DESIGN
Establishing interaction fields for Autobus enables
real-time risk assessment, spatial awareness of pedes-
trian activity, and adaptive responses to different
pedestrian behaviors, enhancing safety and traffic
flow.
To develop the vehicle interaction field for driver-
less minibus, it is crucial to understand pedestrian be-
havior (Jan et al., 2022a), (Jan et al., 2022b), partic-
ularly the risks posed by a lack of awareness. These
risks often arise when pedestrians are distracted by
electronic devices or moving in the same direction as
the vehicle, increasing the likelihood of collisions or
delays. This work proposes a tailored model of inter-
action fields for pedestrian-vehicle interaction to en-
hance vehicle navigation and decision-making. The
goal is to reduce risks by enabling more informed and
responsive vehicle driving and interaction strategies.
3.1 Vehicle Interaction Field
Not all areas around a vehicle are relevant for pedes-
trian interaction while driving. Due to open spaces
and crowds, interactions should primarily focus on in-
dividuals in the vehicle’s drivable area, referred to as
”interactees,” even if they are not actively reacting to
Adaptive Interaction Field Framework for Risk-Aware Navigation of Driverless Minibus in Pedestrian Zones
383

Figure 1: The plot shows top view of pedestrian trajectories
and directions during encounters with the driverless minibus
during testing in the campus, revealing a consistent pattern
of avoidance. This predictable behavior can inform the de-
sign of interaction fields that minimize disruptions under
normal conditions.
the vehicle. This requires identifying and segment-
ing regions of interest based on interaction types. To
achieve this, interaction fields are created around the
vehicle to strategically limit and streamline the ac-
tivation of interaction modules, enhancing their effi-
ciency.
The interaction field configuration is based on
pedestrian trajectories relative to the vehicle. As
shown in Figure 1, pedestrians approaching the ve-
hicle often display a clear pattern of yielding, es-
pecially in tight spaces. Research by Schneemann
et. al. (Schneemann and Gohl, 2016) highlights that
pedestrians typically adjust their path to avoid the ve-
hicle, indicating a collective behavior of spatial nego-
tiation and collision avoidance.
The interaction fields around the driverless
minibus, shown in Figure 2, are designed to enable
graduated communication and risk assessment based
on pedestrian proximity. Inspired by the behavior ob-
served in Figure 1, these fields extend further in the
direction of travel and are shorter in the opposite di-
rection, reflecting the dynamics of pedestrian-vehicle
interactions and risk assessment principles. The de-
sign of the field was based on the following princi-
ples:
• The forward extension of the fields accounts for
the vehicle’s stopping distance, which varies with
speed.
• A longer field in the travel direction provides suf-
ficient space for safe stopping.
• Side fields are shorter since pedestrians in these
areas are more likely to have seen the vehicle pass,
reducing risk.
Figure 2: Schematic of the vehicle with interaction fields:
the ’Ambient’ field (light red) serves as an initial awareness
zone, extending forward for early pedestrian detection; the
’Direct’ field (darker red) enables active communication, al-
lowing dynamic responses; and the ’Risk’ field (darkest red)
covers the closest zone for immediate collision prevention.
This stratification supports graduated safety measures based
on proximity.
According to the zones clarified in Table 1, the
three zones of interaction are:
• Ambient Interaction: The outermost field pro-
vides general awareness by passively signaling
the vehicle’s presence to distant pedestrians, fo-
cusing on those crossing from the front. It aligns
with the ”Ambient Display” concept and involves
no collision risk.
• Direct Interaction: This field facilitates active
communication, especially with pedestrians who
haven’t noticed the vehicle. It enables early de-
tection and allows the vehicle to adjust its speed
or path, issuing auditory alerts if necessary to en-
hance safety.
• Risk Interaction: The closest zone triggers crit-
ical responses when a pedestrian enters, includ-
ing emergency braking and visual alerts. It is de-
signed for immediate action to prevent collisions
in high-risk situations.
3.2 Pedestrian Interaction Field
To integrate pedestrian models into vehicular in-
teraction fields, representing pedestrians as ellipses
is effective, as suggested by W. Limprasert et
al. (Limprasert et al., 2013). Ellipses capture pedes-
trian size and direction, simplifying computations and
enabling quicker decisions. They adapt to changes in
speed and direction, aligning with natural human mo-
tion and enhancing pedestrian movement prediction.
This approach balances accuracy and computational
efficiency, improving safety in pedestrian-vehicle in-
teractions. Figure 3 illustrates this representation.
An ellipse is defined by its geometric parameters,
which correlate with pedestrian movement relevant to
vehicle interaction fields. The standard equation for
an ellipse, centered at the origin and aligned with the
coordinate axes, is:
x
2
a
2
+
y
2
b
2
= 1 (1)
VEHITS 2025 - 11th International Conference on Vehicle Technology and Intelligent Transport Systems
384
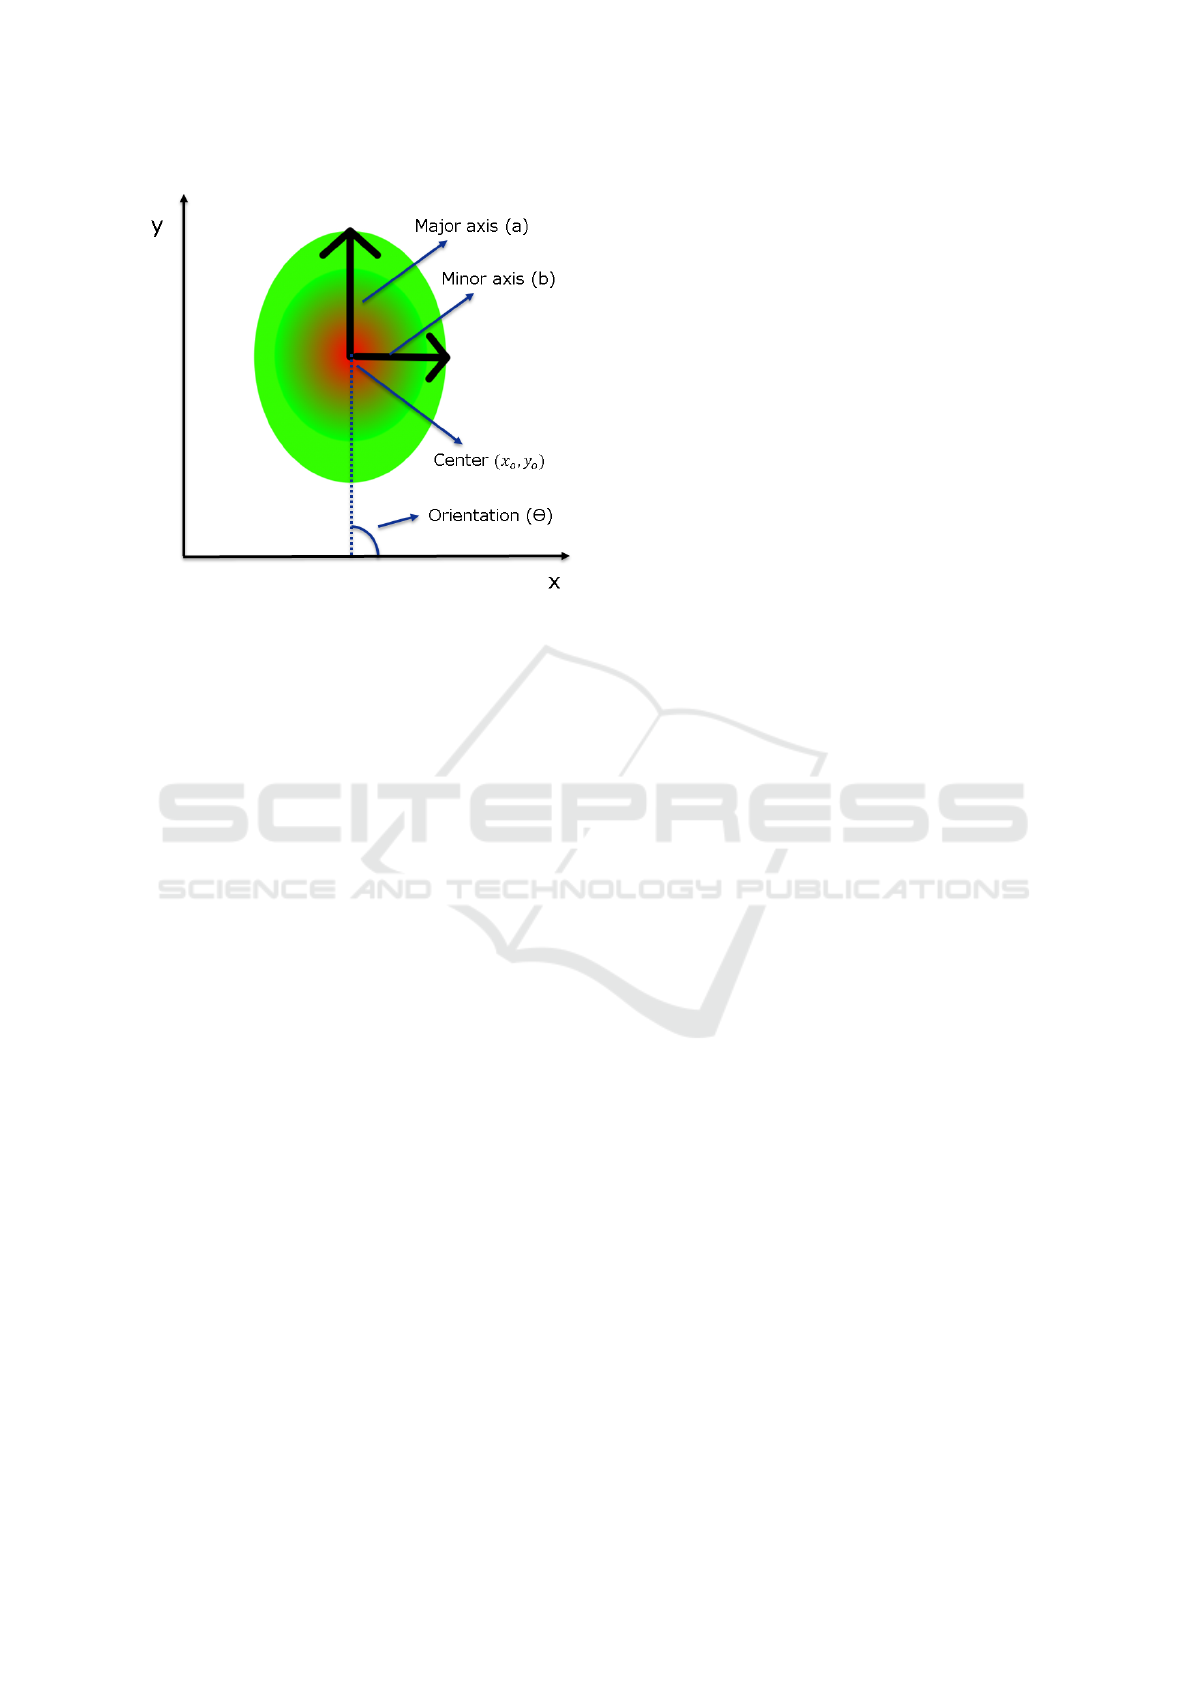
Figure 3: A graphical depiction of a pedestrian interaction
field as a gradient-filled ellipse, with ’X’ and ’Y’ represent-
ing horizontal and vertical coordinates. The gradient indi-
cates pedestrian awareness, decreasing from the center out-
ward. Arrows show the major axis (forward movement) and
minor axis (lateral space). The unawareness value increases
toward the periphery.
where a and b are the semi-major and semi-minor
axes. For an ellipse centered at (x
0
, y
0
) and rotated
by an angle θ, this equation is adapted to represent
pedestrian positioning and orientation.
• Center (x
0
, y
0
): Indicates the pedestrian’s current
position, serving as the geometric center of the el-
lipse.
• Major axis (2a): The longest axis, aligned
with the pedestrian’s primary direction of move-
ment, indicating forward motion and intended
path length.
• Minor axis (2b): The shorter axis, perpendicular
to the major axis, representing lateral movement
and the pedestrian’s width in the field.
• Angle of rotation (θ): Defines the orientation of
the ellipse relative to the coordinate frame, align-
ing the major axis with the pedestrian’s movement
direction for accurate path projection.
• Color Gradient: The gradient within the ellipse
represents the pedestrian’s level of awareness, de-
creasing from the center to the edge, with un-
awareness increasing outward. These parame-
ters help autonomous vehicles dynamically adjust
navigation for pedestrian safety.
4 INTEGRATING INTERACTION
FIELDS AS AN ENTITY OF
ASPECT MAPS
The design of interaction fields uses aspect maps, a
framework developed by (Zolynski, 2018) that ap-
plies cognitive processes in robotics. Unlike tra-
ditional object-oriented methods, it employs paral-
lel data flow networks inspired by biological visual
systems. Aspect maps are modular structures that
represent specific aspects of the environment, inte-
grating data from sources like sensors, storage, and
expert knowledge. They unify and abstract data,
enabling question-solving, information extrapolation,
and contradiction detection. This approach empha-
sizes modular, reusable solutions with multilevel ab-
stractions and supports early data unification, improv-
ing processing, transparency, and reliability. Interac-
tion fields for vehicles and pedestrians are represented
within this framework for seamless correlation and in-
tegration.
4.1 Vehicle Interaction Field Mapping
The interaction field around the vehicle is shaped us-
ing B
´
ezier curves, as shown in Figure 4, offering an
efficient design. The cubic B
´
ezier curve with four
control points is expressed as:
B(t) = (1 − t)
3
P
0
+ 3(1 − t)
2
tP
1
+ 3(1 − t)t
2
P
2
+t
3
P
3
(2)
where:
• B(t) denotes a point on the curve.
• P
0
, P
1
, P
2
, and P
3
are the control points.
• t ranges from 0 to 1.
At t = 0, the curve starts at P
0
, and at t = 1, it ends
at P
3
, passing smoothly through intermediate control
points.
The construction of interaction fields around the
vehicle involves a multi-step process using B
´
ezier
curves and gradient maps to define and refine spatial
boundaries. Each step progressively shapes the in-
teraction zones, ensuring efficient vehicle navigation
and pedestrian safety. Figure 4 illustrates the steps
involved in creating the interaction field, as detailed
below:
1. B
´
ezier Curves (Step 1): The interaction field is
generated by extending two B
´
ezier curves from
the vehicle’s front to its left and right sides. These
curves shape the interaction boundaries on both
sides of the vehicle, as illustrated in the top left
and bottom left insets. The B
´
ezier curves act
Adaptive Interaction Field Framework for Risk-Aware Navigation of Driverless Minibus in Pedestrian Zones
385
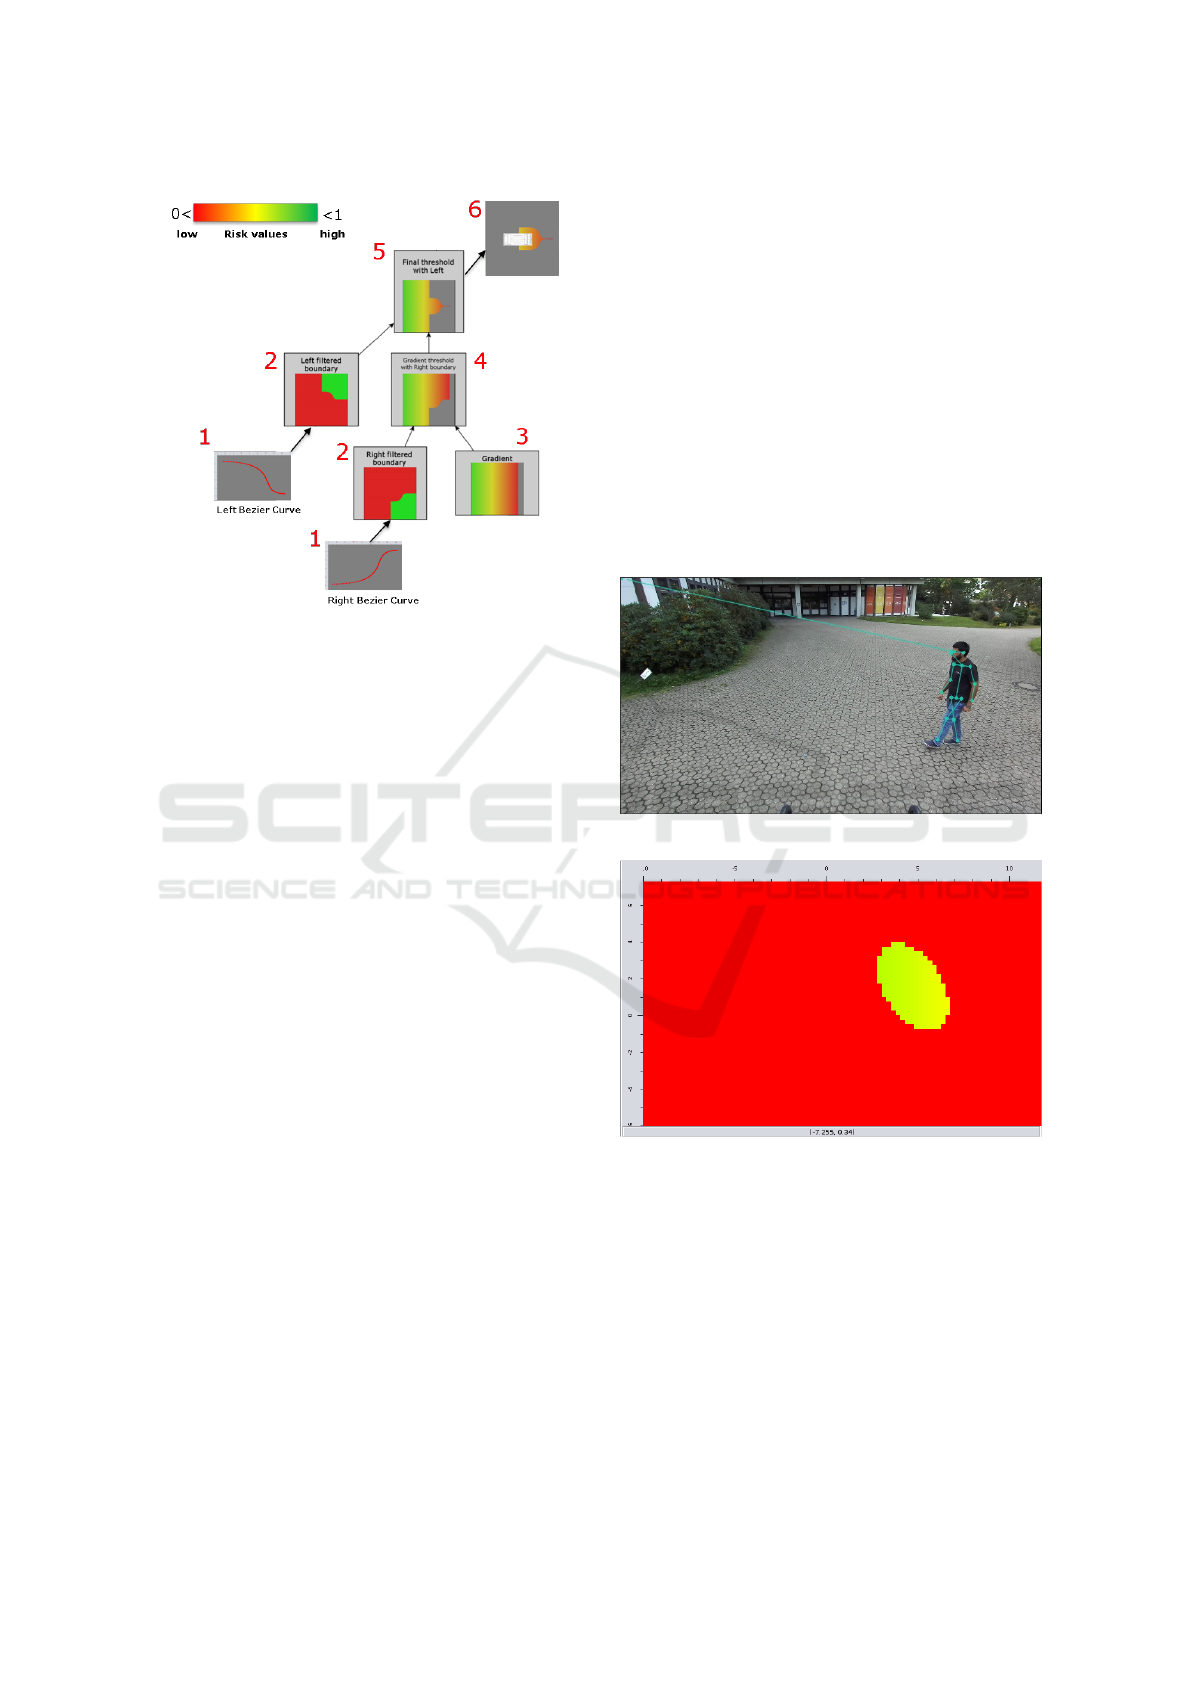
Figure 4: The figure illustrates the step-by-step process for
creating a vehicle interaction field design.
as flexible boundaries that are created on a grid,
defining the field’s spatial extent.
2. Filtered Boundaries (Step 2): The left and right
filtered boundaries are determined on a grid, with
specific regions designated as null (indicated in
red). These boundaries establish the limits of in-
teraction fields, separating null zones (zero inter-
action) from active zones (one interaction).
3. Gradient Map Creation (Step 3): A gradient
map is created, as shown in the middle of the im-
age, indicating different zones of pedestrian in-
teraction with varying intensities. The gradient
progresses from red (low risk) near the vehicle
to green (high risk) at the periphery, representing
awareness levels within the interaction field.
4. Thresholding and Composite Maps (Step 4 and
5): The gradient map undergoes a thresholding
process using the right and left filtered boundaries
sequentially. During each thresholding step, red
zones (zero values) are assigned gradient values,
while non-colored zones are marked as NaN, de-
noting inactive areas. The sequential filtering re-
fines the map, ultimately leading to a composite
map representing finalized interaction boundaries.
5. Final Interaction Field (Step 6): The uppermost
image shows the culmination of this process, pre-
senting the final interaction field map around the
vehicle. This map indicates varying interaction
zones based on proximity and provides the neces-
sary spatial structure for the vehicle’s navigation
system.
4.2 Pedestrian Interaction Field
Mapping
The vehicle interaction field concept requires an anal-
ogous representation of pedestrians to understand
their unawareness and associated risks. Unlike the
vehicle interaction field, this method uses ellipses,
as shown in Figure 3, to model pedestrian dimen-
sions and movement dynamics accurately. In Fig-
ure 5, pedestrian is depicted as yellow-green ellipse
centered based on their actual position relative to the
vehicle, which is positioned at the origin (0,0). This
alignment ensures precise spatial representation and
enhances the model’s ability to assess interactions and
collision risks. The ellipses’ orientation further indi-
cates pedestrian movement direction.
(a) Pedestrian walking in front of the vehicle.
(b) Aspect map representation of pedestrian awareness in
grip map (top view), where the minibus center is located at
(0, 0).
Figure 5: Grid representation of pedestrian space: Pedes-
trian occupancy as unawareness is shown as a yellow-green
ellipsoid, while unoccupied areas are marked in red. This
visualization quantifies pedestrian dynamics and spatial in-
teraction on the grid.
Figure 6 presents a zoomed-in view of the pedes-
trian representation on the grid map, comparing
awareness levels between zero and one. The grid cells
transition from green (indicating higher awareness) to
VEHITS 2025 - 11th International Conference on Vehicle Technology and Intelligent Transport Systems
386

red (indicating lower awareness) based on grid val-
ues. This color scheme not only aids visualization but
also enhances the model’s ability to quantitatively as-
sess and represent pedestrian awareness, highlighting
areas of potential vulnerability and improving safety
insights in vehicle-pedestrian interactions.
(a) Pedestrian awareness with unawareness value 0, shown
as an isolated high-intensity area on a red background indi-
cating maximum awareness.
(b) Pedestrian awareness with unawareness value 1, show-
ing a gradient from green (low awareness) to red within the
ellipsoid on the grid map.
Figure 6: (a) Unawareness value of 0 shows a localized
high-awareness area in green, surrounded by a red back-
ground indicating maximum awareness. (b) Unawareness
value of 1 demonstrates a gradient from red (lower aware-
ness) to green (higher awareness) within the ellipsoid on the
grid.
To represent the collective awareness of multi-
ple pedestrians, their respective values are aggre-
gated. Figure 7 illustrates two pedestrians with re-
duced awareness near the vehicle, indicated by ar-
eas of higher intensity. When pedestrians’ unaware-
ness regions overlap, the values are summed, result-
ing in more saturated colors that reflect increased risk.
This approach captures and emphasizes heightened
risks from reduced awareness in overlapping pedes-
trian groups.
(a) Front camera image showing two pedestrians walking
ahead of the Autobus.
(b) Top view grid map showing the spatial occupancy of
both pedestrians.
Figure 7: The grid map visualizes two overlapping pedes-
trian spaces as ellipses on a red background. The intersec-
tion creates a value gradient, with the central yellow region
indicating the highest overlap. This composite view is es-
sential for analyzing pedestrian density, movements, and in-
teractions.
5 INTEGRATED
VEHICLE-PEDESTRIAN
INTERACTION FIELD
The analysis of merged values within interaction
fields is essential for understanding pedestrian-
vehicle dynamics, particularly with a driverless
minibus. In Figure 8, a pedestrian’s entry into the in-
teraction field is depicted, marked by a black ellipti-
cal outline on the grid map, while the vehicle’s field is
shown with a gray dotted line. A schematic of driver-
less minibus is overlaid for orientation, indicating its
position and direction.
The grid map uses a color gradient from red to yel-
low to represent increasing perceived risk, with yel-
low highlighting areas of higher merged awareness
values. As the pedestrian enters the interaction field,
the model assesses their location and corresponding
awareness levels to compute the likelihood and sever-
ity of a potential encounter with the vehicle. This
Adaptive Interaction Field Framework for Risk-Aware Navigation of Driverless Minibus in Pedestrian Zones
387

Figure 8: The grid map illustrates the spatial risk assess-
ment between a pedestrian and the vehicle. The pedestrian’s
position is outlined in black, while the vehicle’s interaction
field is marked with a gray dotted line. A schematic of the
vehicle provides orientation. The heat map, with a red-to-
yellow gradient, indicates increasing perceived risk, with
yellow denoting higher merged awareness values. These
values help evaluate the likelihood and severity of a poten-
tial encounter, enhancing understanding of how the pedes-
trian’s location influences the system’s risk assessment.
visualization allows the system to quantify and eval-
uate how the pedestrian’s spatial positioning affects
the system’s risk assessment, thereby enhancing the
understanding of dynamic pedestrian-vehicle interac-
tions.
Associated pedestrian risk is quantified by sum-
ming the grid values of the pedestrian’s ellipsoid and
the vehicle’s interaction field. The grid is modeled
as a two-dimensional matrix, where each entry rep-
resents a specific position. The overlapping area, de-
noted as E for the pedestrian’s ellipsoid and V for the
vehicle’s interaction field, is used to calculate the total
risk. The formula sums the values within this overlap,
capturing the combined effect of both entities on the
grid.
Let E be the set of grid positions occupied by the
pedestrian’s ellipsoid and V be the set of grid posi-
tions occupied by the vehicle’s interaction field.
S =
∑
(i, j)∈E∩V
(E
i j
+V
i j
) (3)
Where:
• S is the total sum of the overlapped grid values.
• E
i j
is the grid value at position (i, j) due to the
pedestrian’s ellipsoid.
• V
i j
is the grid value at position (i, j) due to the
vehicle’s interaction field.
• E ∩ V represents the set of grid positions where
the ellipsoid and interaction field overlap.
The ellipsoid grid values represent pedestrian un-
awareness, while the vehicle interaction field values
signify potential risk. The combined sum of these
values at overlapping positions provides a composite
metric to assess risk in the interaction zone based on
predetermined thresholds for various fields.
These aggregated grid values are then sent to the
decision-making process, which evaluates the data to
determine if escape maneuvers are possible or if ac-
tivating the interaction module is necessary. This
decision-making phase integrates risk assessments to
enhance safety measures in scenarios requiring active
intervention.
Additionally, the calculated risk is utilized by
the interaction module, which classifies it into
three types of interactions—ambient, direct, or risk-
based—using a threshold mechanism. This classifica-
tion guides the module’s response to different levels
of pedestrian-vehicle interactions, ensuring an adap-
tive approach to managing potential hazards.
6 CONCLUSION
In conclusion, the concept of this work prioritizes ef-
fective risk assessment through adaptive interaction
fields aligned with the vehicle’s direction of travel.
This strategic alignment minimizes inappropriate in-
teractions, especially in less critical peripheral zones.
The pedestrian interaction area is oriented based on
the pedestrian’s walking path, establishing a dynamic
safety buffer that provides the driverless minibus with
ample time to respond to pedestrian movements.
The design’s flexibility is emphasized by its cus-
tomizable features, allowing the size and intensity of
the interaction fields to be adjusted for various en-
vironmental conditions. The driverless minibus im-
proved its navigation by evading pedestrians when
possible and efficiently interacting with them based
on their assessed risk level. This adaptability en-
sures optimal configuration across diverse scenarios,
enhancing safety in both crowded urban streets and
quieter suburban areas. The integration of these tech-
nical elements optimizes pedestrian-vehicle interac-
tions, promoting proactive risk management and situ-
ational awareness.
Future work can focus on enhancing interaction
fields by integrating advanced perception systems like
gaze tracking, adapting to diverse urban and environ-
VEHITS 2025 - 11th International Conference on Vehicle Technology and Intelligent Transport Systems
388

mental contexts, and addressing the needs of vulnera-
ble pedestrian groups. Real-world validation through
longitudinal studies in complex urban environments
and multi-vehicle scenarios can refine the framework,
while incorporating cultural factors and smart infras-
tructure (e.g., V2X communication) can improve con-
textual awareness. Exploring energy-efficient interac-
tion designs and conducting user acceptance studies
will further optimize the system for usability, trust,
and sustainability. These advancements aim to cre-
ate safer, adaptive, and globally effective autonomous
pedestrian-vehicle interaction strategies.
REFERENCES
Jan, Q. H., Baddela, Y. S., and Berns, K. (2022a). Pedes-
trian activity recognition from 3d skeleton data using
long short term memory units. In VEHITS, pages 368–
375.
Jan, Q. H. and Berns, K. (2021). Safety-configuration of
autonomous bus in pedestrian zone. In VEHITS, pages
698–705.
Jan, Q. H. and Berns, K. (2023). Autonomous shuttle
for pedestrian zones. In International Symposium on
Measurements and Control in Robotics, pages 169–
179. Springer.
Jan, Q. H., Dahiwal, P., and Berns, K. (2023). Effec-
tive visual content of ehmi for autonomous vehicles
in pedestrian zones. In International Conference on
Robotics in Alpe-Adria Danube Region, pages 203–
210. Springer.
Jan, Q. H., Wolf, P., Berns, K., Reich, J., and Wellstein,
M. (2022b). Integration of human skeleton posture
models into reaction for realizing dynamic risk man-
agement. In International Commercial Vehicle Tech-
nology Symposium, pages 109–120. Springer.
Limprasert, W., Wallace, A., and Michaelson, G. (2013).
Real-time people tracking in a camera network. IEEE
Journal on Emerging and Selected Topics in Circuits
and Systems, 3(2):263–271.
Milan
´
es, V., Mahtout, I., Navas, F., and Gonz
´
alez, D.
(2020). On the passenger acceptance of driverless
shuttles. IEEE Intelligent Transportation Systems
Magazine, 14(1):18–28.
Nesheli, M. M., Li, L., Palm, M., and Shalaby, A. (2021).
Driverless shuttle pilots: Lessons for automated tran-
sit technology deployment. Case studies on transport
policy, 9(2):723–742.
Rasouli, A. and Tsotsos, J. K. (2019). Autonomous vehicles
that interact with pedestrians: A survey of theory and
practice. IEEE transactions on intelligent transporta-
tion systems, 21(3):900–918.
Schneemann, F. and Gohl, I. (2016). Analyzing driver-
pedestrian interaction at crosswalks: A contribution to
autonomous driving in urban environments. In 2016
IEEE intelligent vehicles symposium (IV), pages 38–
43. IEEE.
Vogel, D. and Balakrishnan, R. (2004). Interactive pub-
lic ambient displays: transitioning from implicit to
explicit, public to personal, interaction with multiple
users. In Proceedings of the 17th annual ACM sym-
posium on User interface software and technology,
pages 137–146.
Zolynski, G. (2018). Cognitive maps for autonomous ma-
chines in construction and civil engineering. Verlag
Dr. Hut.
Adaptive Interaction Field Framework for Risk-Aware Navigation of Driverless Minibus in Pedestrian Zones
389
