
A Learning Approach for User Localization and Movement Prediction
with Limited Information
Quang-Vinh Tran
a
and Quang-Diep Pham
b
Switching Technology Research Center, Viettel Hi-Technology Industries Corporation, Hanoi, Vietnam
Keywords:
5G Core Network, User Localization, Handover, Movement Prediction.
Abstract:
In the 5G network system, users continuously travel among areas managed by different User Plane Functions
(UPFs), leading to the need for efficient handover between UPFs. Conventional handover relies on signal
measurements between user devices and neighboring base stations, so it is a ”re-active” scheme. Therefore,
this procedure results in long response time of the Packet Data Unit (PDU) session establishment, and affecting
data service quality. Another approach is an ”pro-active” scheme, in which the position of users are estimated,
hence the decision of UPF handover can be made earlier. We propose a solution using machine learning
techniques to model user movement behavior in the network and predict user positions in advance. The
predicted UPF managing the next location will be announced accordingly to take preparatory steps for serving
the incoming users, thereby reducing the new PDU session establishment latency, increasing processing speed,
and improving the quality of experience. We propose the model combining the K-means clustering algorithm
and the Gated Recurrent Unit deep learning network for time series data. The solution was tested with Viettel’s
5G network data and demonstrated its feasibility in real-world dataset.
1 INTRODUCTION
Viettel Group is currently the largest telecommuni-
cations group in Vietnam with tens of million cus-
tomers. With the development trend of network gen-
erations, Viettel’s 5G network is being developed and
perfected. In order to meet the low latency and high
speed requirements according to 3GPP standards, we
constantly pose problems. The 5G core network
system is being built with a complex model includ-
ing many services performing different functions, in
which the User Plane Function (UPF) is responsible
for packet routing and forwarding, packet inspection,
QoS handling, and external PDU session for intercon-
necting data network (DN), in the 5G architecture.
Currently, UPF performs connection establish-
ment operations with the User Equipment (UE) in a
reactive manner. When the UE enters a cell managed
with a certain UPF instance, this UPF instance will
initiate several connection procedures, for example,
establishing tunnels for data communication or trans-
ferring connections, to allow the UE seamlessly us-
ing the service when standing at a new location. This
a
https://orcid.org/0009-0008-1092-0878
b
https://orcid.org/0009-0002-4854-6929
causes process latency to increase, reducing the qual-
ity of service experience. As the coverage area of
a base station (gNB) becomes smaller to accommo-
date different services, especially internet of things
(IoT), ultra reliable and low latency communications
(uRLLC) and streaming services, this requirement be-
comes more important. Therefore, we propose a prob-
lem to predict which UEs will be in the area under
which UPFS’ management. By statistically learning
the user’s movement behaviors, we can predict the
following cell location that the UE would move in.
Our approach is to classify and learn subscribers’
movement behavior or patterns and then learning the
movement patterns within each cluster. The cho-
sen clustering algorithm is K-means, where the ”be-
havior” of users is measured by their deviation over
the same time period, and then users are distributed
into different clusters. Gated recurrent unit (GRU)
is employed to learn user behavior within each clus-
ter. Unlike traditional Recurrent Neural Network
(RNN), which suffer from issues like vanishing gradi-
ents during long sequence learning, GRUs introduce
gating mechanisms that regulate the flow of informa-
tion and mitigate these problems. This makes GRUs
highly effective in capturing temporal dependencies
over longer periods.
Tran, Q.-V. and Pham, Q.-D.
A Learning Approach for User Localization and Movement Prediction with Limited Information.
DOI: 10.5220/0013221600003929
In Proceedings of the 27th International Conference on Enterprise Information Systems (ICEIS 2025) - Volume 1, pages 717-723
ISBN: 978-989-758-749-8; ISSN: 2184-4992
Copyright © 2025 by Paper published under CC license (CC BY-NC-ND 4.0)
717

Our contributions can be summarized as follows:
• A preprocessing solution for log files by convert-
ing them into a dataset,
• A model that combines machine learning and
deep learning to solve the position prediction
problem.
The rest of the paper is organized as follows.
Sec. 2 summarizes some related work. Sec. 3 intro-
duces our proposed approach to the problem of user
localization and movement prediction, while Sec. 4
presents the performance evaluation of our proposed
solution. Finally, some conclusions and perspectives
are drawn in Sec. 5.
2 RELATED WORK
The UPFs play a crucial role as a central user plane
element, responsible for various essential functions in
managing user data traffic, consist of packet routing,
quality-of-service enforcement, and traffic monitor-
ing. The PDU session establishment initiated by UEs’
requests will include the participation of AMF (Ac-
cess and Mobility NF), SMF (Session Management
NF). In such procedure, the SMF selects the most ap-
propriate User Plane Function (UPFs) for the session
considering the layout of the network, the available
resources of UPFs, and quality policies for UE. SMF
might even ask the Policy Control Function (PCF)
for additional session-related guidelines. Afterwards,
the SMF sends detailed instructions and policies to
the UPFs including quality parameters, session identi-
fiers, and confirmation of the chosen UPFs. The UPFs
then configure the data path based on these instruc-
tions.
To ensure the continuity of various PDU sessions
while an UE is moving, the procedure of UEs’ han-
dover will include AMF, SMF and UPF as well. Ses-
sion and Service Continuity (SSC) enables to ad-
dress the different continuity requirements of differ-
ent applications and services for UEs. Some appli-
cations like the IP Multimedia Subsystem (IMS) re-
quire an always-on Protocol Data Unit (PDU) session
that the User Plane resource establishes for every tran-
sition from the 5GMM-IDLE mode to the 5GMM-
CONNECTED mode. The UE requests the establish-
ment of a PDU session as an always-on PDU session
based on the request indication of the upper layers. It
is the network that decides whether to establish a PDU
session as an always-on PDU session. Therefore, an
”proactive” scheme based on the UE position predic-
tion allowing the planning of always-on PDU session
and other resources (scaling up or down UPFs) could
be an efficient way to save the network resource while
the service quality commitment.
Research on user localization and movement pre-
diction has evolved significantly, with various ap-
proaches ranging from traditional probability-based
models to advanced machine learning techniques.
These approaches can be classified into three main
categories: traditional probabilistic models, machine
learning-based approaches, and hybrid methods.
In study (Ariffin et al., 2013), the Markov model
parameter that influences the prediction is the tran-
sition probability matrix. Inaccuracy in the value
of the transition probability matrix will lead to in-
correct predictions and may cause failure. Further-
more, in this paper, the value of the transition prob-
ability matrix is assumed and has not yet been de-
termined by human behavior. Author in (Yan et al.,
2021) presents a weighted Markov prediction model
that incorporates mobile user classification. It first
extracts trajectory data from real mobile communica-
tion records, with entropy used to measure the com-
plexity of users’ movements. Users are then classi-
fied based on their behavior patterns using machine
learning. The Markov model’s step thresholds and
weighting factors are adjusted for each user group to
improve mobility prediction. However, while the per-
formance improves, the benefits are less pronounced
for users with high or irregular mobility. Zhang et al.
(Zhang et al., 2009) proposed a Bayesian Network-
based location prediction model using multiple fac-
tors like topology, road typology, and movement data
to improve prediction accuracy. Predictive factors are
encoded in the network nodes, and location predic-
tion is calculated using cell topology information. A
factor distribution mechanism addresses cases where
nodes lack direct prediction data.
Although the results are promising, the study re-
mains at the simulation. Similar to (Zhang et al.,
2009), Liu et al. (Liu et al., 2010) proposed a
novel approach based on Bayesian network to predict
a moving object’s future location under uncertainty.
This paper proposed several algorithms to construct
a Bayesian network from trajectory information and
suggested a method to predict a moving object’s fu-
ture location under uncertainty using this network.
The Bayesian network allows inference and calcu-
lates the probabilities of all possible states of an un-
observed node based on current data. However, its
drawback lies in modeling nonlinear relationships, as
accurately capturing such dynamics or changes in tra-
jectories may require additional assumptions, increas-
ing the model’s complexity.
In recent years, machine learning-based methods
have grown increasingly powerful. Recurrent Neu-
ICEIS 2025 - 27th International Conference on Enterprise Information Systems
718

ral Networks (RNNs), especially Long Short-Term
Memory (LSTM) and Gated Recurrent Units (GRUs),
have been effective in predicting user mobility due to
their ability to capture temporal dependencies. How-
ever, RNNs face the vanishing gradient problem when
input data sequences become long (Hochreiter et al.,
2001). Meanwhile, LSTM (Schmidhuber et al., 1997)
and GRU (Cho et al., 2020) mitigate this limitation
by introducing a cell state, with GRU offering greater
computational efficiency compared to LSTM. An-
other study uses RNNs to build users’ personalized
preferences and model their historical behavior. It
then incorporates an attention mechanism to dynam-
ically weight historical user behaviors based on the
user’s current message transmission (Gou and Wu,
2022). Z. Xiong et al. (Xiong et al., 2019) proposed a
Deep Reinforcement Learning (DRL) method to op-
timize paging strategies in real time by continuously
adapting to changing user movement patterns. This
dynamic approach improved performance in dense
5G environments with frequent mobility.
While standalone machine learning models such
as RNNs, LSTM, and GRU have shown potential in
user mobility prediction, they often encounter diffi-
culties in managing large-scale data and maintaining
real-time efficiency, particularly in dense 5G envi-
ronments. To address these challenges, hybrid ap-
proaches that combine clustering techniques with ma-
chine learning models have emerged as a promis-
ing solution. These methods first cluster users based
on similar mobility patterns, enabling the prediction
models to focus on specific user groups. This ap-
proach can significantly reduce paging overhead by
narrowing the search space for user localization, thus
improving prediction accuracy and minimizing com-
putational complexity. The authors in (Kim et al.,
2022) proposed clustering to group UE based on mo-
bility patterns, time, and day of the week, then apply
the GRU model to predict UE locations. The results
demonstrated that the GRU model achieved a paging
accuracy of over 80%. However, this method heav-
ily depends on the clustering process and appropriate
parameter configuration. Choosing the suitable clus-
tering method depends on the nature of user mobility
data, with K-means being appropriate for uniformly
distributed data.
To overcome these challenges, our work focus is
on improving the clustering process and developing
more efficient data handling techniques. By doing so,
the system can better reflect the constantly changing
user behaviors in dense 5G environments, thus im-
proving prediction accuracy.
3 PROPOSED APPROACH
Due to occupation, gender, etc., each user’s habits and
movements are different. Training the model on a
dataset of all users will result in the model not be-
ing able to converge. It is necessary to specialize the
model for each user so that the model is suitable for
each subscriber’s movement behavior.
We propose a solution consisting of three pro-
cesses: (i) preprocessing, (ii) UE clustering, and (iii)
movement behavior learning. This clustering is based
on subscriber movement, not on individual informa-
tion for clustering, because this is all confidential
information. Our proposed behavioral learning and
decision-making model uses deep learning techniques
to train on time series data. The overall architecture
of our solution is illustrated in Fig. 1, where t is se-
quence length, {X
1
,X
2
,...,X
t
} is input of GRU net-
work, n is number of gNB stations, [P
1
,P
2
,...,P
n
] is a
probability vector representing the UE’s ability to be
at the stations in the (t + 1) timestamp.
3.1 Pre-Processing of Log Files
In this section, we will present the process of han-
dling the initial raw data (log files) for use in subse-
quent phases. Log files are recorded on a per-minute
basis, facilitating ease of reading and normalization.
However, they may miss certain values and include
stations in areas with low user density. Therefore,
an effective processing procedure is required to avoid
noise and data imbalance. The log files contain 52
data columns, of which we utilized the following:
• EVENT TIME: The time when the event oc-
curred,
• EVENT ID: The identity of the event,
• EVENT RESULT: The outcome of the event pro-
cedure,
• IMSI: International Mobile Subscriber Identity.
This information element contains data com-
monly used to identify the UE in the Core Net-
work,
• ECI: E-UTRAN Cell Identity. This is used to
identify cells within a Public Land Mobile Net-
work (PLMN).
We employ the following processes:
Data Cleaning. EVENT RESULT (The outcome of
the event procedure) is used to filter out failed events.
For example, when a ”l handover” event fails, the
ECI is not updated to reflect the new cell, result-
ing in redundant information. In this context, we
specifically focus on the EVENT ID values of ”l tau”,
A Learning Approach for User Localization and Movement Prediction with Limited Information
719

Behavioral Learning
GRU
GRU
GRU
GRU
GRU
GRU
GRU
GRU
softmax
GRU
Dataset
Log
files
Cluster ID
Dataset
Pre-
Processing
K-Means
Clustering
Figure 1: Overall architecture.
”l service request”, and ”l handover”, as these events
are directly related to the UE updating its location
during mobility. The cell information is converted to
gNB station information using the following formula,
gNB ID =
ECI
256
. (1)
Data Filtering. Events related to UEs exhibiting ab-
normal behavior will also be filtered out to minimize
noise. We establish the following exclusion criteria:
UEs that exhibit a ping-pong phenomenon, charac-
terized by continuously switching their location be-
tween multiple base stations; UEs that transition be-
tween more than three base stations within one minute
(in which case, the three base stations may indicate
that the UE is traversing a region where the cover-
age overlaps of three different stations); or UEs that
move to fewer than three base stations within a 60-
minute period (which provides insufficient informa-
tion for the machine learning process). Additionally,
gNB stations with a low number of users, particularly
in mountainous regions, will also be excluded. Fur-
thermore, UE that has a history of movement through
these stations will be discarded as well.
Data Imputation. The generated dataset will have
a time interval of 1 minute, and with log files cover-
ing a duration of 120 minutes, the dataset will contain
120 timestamps. Therefore, the following data filling
rules are necessary: if, within a 1-minute period, a
UE has movement data across a base station, prior-
ity will be given to retaining the information from the
most recent base station. In cases where no events oc-
cur during a minute (resulting in the absence of base
station information), this will be filled with data from
the subsequent base station. For the final minutes of
the dataset, which lack information, the value will be
populated with the last updated base station value of
the UE.
After processing, we obtained movement
data for 6, 472 UEs over a period of 120 min-
utes, traversing 57 gNB stations. An exam-
ple of the dataset is illustrated in Table 1,
wherein [45204·······20,45204·······34,...]
represents the list of IMSIs, and
[900083,900389,900326,909520,...] represents
the list of gNB stations.
3.2 Cluster Selection
In our problem, we focus on clustering user behav-
ior to categorize movement trajectories into distinct
clusters. Each cluster shares similar characteristics,
enabling the deep learning model to converge more
rapidly and mitigating the issue of underfitting. A key
challenge, however, is the lack of additional user in-
formation beyond the IMSI identifier, which prevents
us from applying rule-based grouping or actively la-
beling users. Consequently, we opted for a cluster-
ing algorithm to automatically group users based on
emerging data patterns (Faizan et al., 2020; Yin et al.,
2024).
We choose K-means model (MacQueen, 1967) for
clustering process. K-means offers the advantages
of simplicity, high speed, it is capable of supporting
complex problem solving and multidimensional data
(Rahamathunnisa et al., 2020; Kakbra, 2014; Subbiah
and Christopher, 2012), which is why we expect it to
perform well on our dataset. The primary goal of K-
means is to partition a set of data points into K clus-
ters, each defined by its centroid. The algorithm oper-
ates by optimizing the positions of the centroids and
assigning data points to the nearest cluster. Euclidean
Distance used to calculate the distance between a data
point and a centroid:
d(x
i
,c
j
) =
s
n
∑
k=1
(x
ik
− c
jk
)
2
, (2)
where d(x
i
,c
j
) is the distance between data point x
i
and centroid c
j
; x
ik
, c
jk
is he value of the k-th feature
of x
i
and c
j
.
After assigning data points to clusters, the cen-
troid of each cluster is updated by calculating the av-
erage of all data points in that cluster:
c
j
=
1
|C
j
|
∑
x
i
∈C
j
x
i
, (3)
where C
j
is the set of data points belonging to cluster
j and |C
j
| is number of points in cluster j. The objec-
tive function to be optimized is the total squared dis-
tance between the data points and their corresponding
ICEIS 2025 - 27th International Conference on Enterprise Information Systems
720

Table 1: Dataset from log files.
Time
IMSI
45204··· ··· ·20 45204··· ··· ·34 . . .
20240626.1400 900083 900389 . . .
20240626.1401 900326 909520 . . .
20240626.1402 900326 900387 . . .
. . . . . . . . . . . .
centroids:
J =
K
∑
j=1
∑
x
i
∈C
j
d(x
i
,c
j
)
2
. (4)
With the data on the sequence of base stations along
the UE’s trajectory, we encode and concat them into
input vectors for K-means. Example for the i-th UE
over a period of T minutes is x
i
= x
i1
⊕x
i2
⊕··· ⊕ x
iT
.
We propose two solutions for this encoding:
• One-hot encoding of gNB station codes, followed
by concatenating them into a single vector for
each UE. Example for the i-th UE in t-th minutes:
x
it
= [0,0,...,1,...,0],t ∈ [1,T ]. (5)
• Utilizing the geographical coordinates of the gNB
stations and the geographic displacement between
consecutive timestamps, then concatenating them
into a single vector for each UE.
x
i1
= [LAT
i1
,LON
i1
], (6)
x
it
= [LAT
it
,LON
it
,d(x
it
,x
i(t−1)
)],∀t ∈ [2, T ],
(7)
where d(x
it
,x
i(t−1)
) is the distance from x
i(t−1)
to
x
it
and can be calculated using the Haversine for-
mula (Robusto, 1957) or the Euclidean distance
(since the distance between two stations is small
compared to the Earth’s radius).
The set of vectors as inputs to classify into 20 clus-
ters (i.e., 20 UEs movement patterns). If a UE does
not have sufficient data for clustering (e.g., a newly
registered subscriber), it will be assigned to the clus-
ter with the largest number of UEs.
3.3 Behavioral Learning
The mobility data of subscribers exhibits a strong
temporal correlation and presents complexities in be-
havior modeling. Therefore, we opted for deep learn-
ing networks to address this challenge. GRU net-
works (Gated Recurrent Units) are a suitable choice
for capturing the intricate mobility patterns of users
as they move across different gNB stations.
A Gated Recurrent Unit (GRU) network (Cho
et al., 2014) is a specialized type of recurrent neu-
ral network (RNN) designed to efficiently model se-
quential data, making it particularly suitable for time
series forecasting and prediction tasks. GRUs are
highly effective in capturing temporal dependencies
over longer periods.
The GRU has two primary gates: the update gate
and the reset gate. These gates control how much of
the past information should be carried forward and
how much new information should be incorporated at
each time step.
1. Update Gate. The update gate z
t
decides the extent
to which the hidden state from the previous time step
h
t−1
will be carried forward. It is computed as:
z
t
= σ(W
z
· [h
t−1
,x
t
]), (8)
where W
z
is the weight matrix, x
t
is the input at time
t, and σ is the sigmoid activation function.
2. Reset Gate. The reset gate r
t
determines how
much of the previous hidden state should be forgotten,
allowing the model to discard irrelevant information.
It is given by:
r
t
= σ(W
r
· [h
t−1
,x
t
]), (9)
where W
r
is the weight matrix.
3. Candidate Hidden State. Using the reset gate, the
GRU computes the candidate hidden state
˜
h
t
, which
incorporates the new input and some portion of the
previous hidden state. It is calculated as:
˜
h
t
= tanh(W · [r
t
⊙ h
t−1
,x
t
]), (10)
where ⊙ represents element-wise multiplication, and
tanh() is the hyperbolic tangent activation function.
4. Final Hidden State. Finally, the new hidden state
is a combination of the previous hidden state and the
candidate hidden state, weighted by the update gate:
h
t
= (1 − z
t
) ⊙ h
t−1
+ z
t
⊙
˜
h
t
(11)
The GRU’s ability to adaptively control the informa-
tion flow makes it particularly suited for time series
data, where the model must effectively balance be-
tween retaining past observations and learning new
patterns. By reducing the number of gates compared
to the Long Short-Term Memory (LSTM) network,
GRUs are computationally more efficient while main-
taining robust performance on a wide range of time-
dependent tasks.
In applying this approach to our problem, each
subscriber (represented by an IMSI) is associated
A Learning Approach for User Localization and Movement Prediction with Limited Information
721
with a trajectory sequence over a specific time period
(i.e., the sequence of gNB stations that the subscriber
moves through). We encoded this gNB sequence into
one-hot vectors, combined with the encoding of clus-
ter Id, to form a complete vector set as input to the
behavior learning model:
X(Model
input
) = X
1
,X
2
,...,X
t
, (12)
where X
i
= [encode o f gNB⊕encode o f cluster ID],
i ∈ [1,t]; t is sequence length. The output of the model
is fitted with the one-hot encoding of the gNB sta-
tion for the t + 1 timestamp (Y = encode o f gNB =
[0,0,...,1,...,0]).
Outputs of the model are a probability vectors, in-
dicating the likelihood of the subscriber being at a
specific gNB station at the predicted time. Ideally, the
probability of a subscriber moving to the correct sta-
tion is 1, while the probabilities for all other stations
are 0.
4 PERFORMANCE EVALUATION
The test data was collected on June 26, 2024, from
14:00 to 15:59 GMT+7. After filtering, we obtained
data from 6, 472 subscribers moving through 57 gNB
stations.
Following the Clustering and Behavioral learning
process, we set the parameter values as follows:
• Number of clusters: k = 20
• Number of GRU network layers: 3
• Learning rate: 0.001
• Number of training epoch: 13
• Training/testing ratio: 70/30
• Sequence length: 16
Our model is designed to suggest the most likely
options for the next station’s location, so it is difficult
to use the top-1 or top-k parameter for evaluation. In-
stead, we use the average predicted probability across
all samples as accurary of model. The prediction ac-
curacy for timestamp t of i-th UE is:
P
it
=
|
˜
Y
it
|−1
∑
j=0
˜
Y
it
[ j],
˜
Y
it
= Y
it
⊙
¯
Y
it
in this context, Y is one-hot encode of gNB and
¯
Y is a
probability vector representing the prediction. Then,
the model’s accuracy (score testing) for all predictions
defined as follows:
P([UEs]) =
∑
i
T
∑
j=t+1
P
i j
30% × N × (T −t)
, (13)
where i represents 30% of UEs for testing phase, N is
number of UEs, j is testing timestamp, t is sequence
length and T is length of data collected (in minutes).
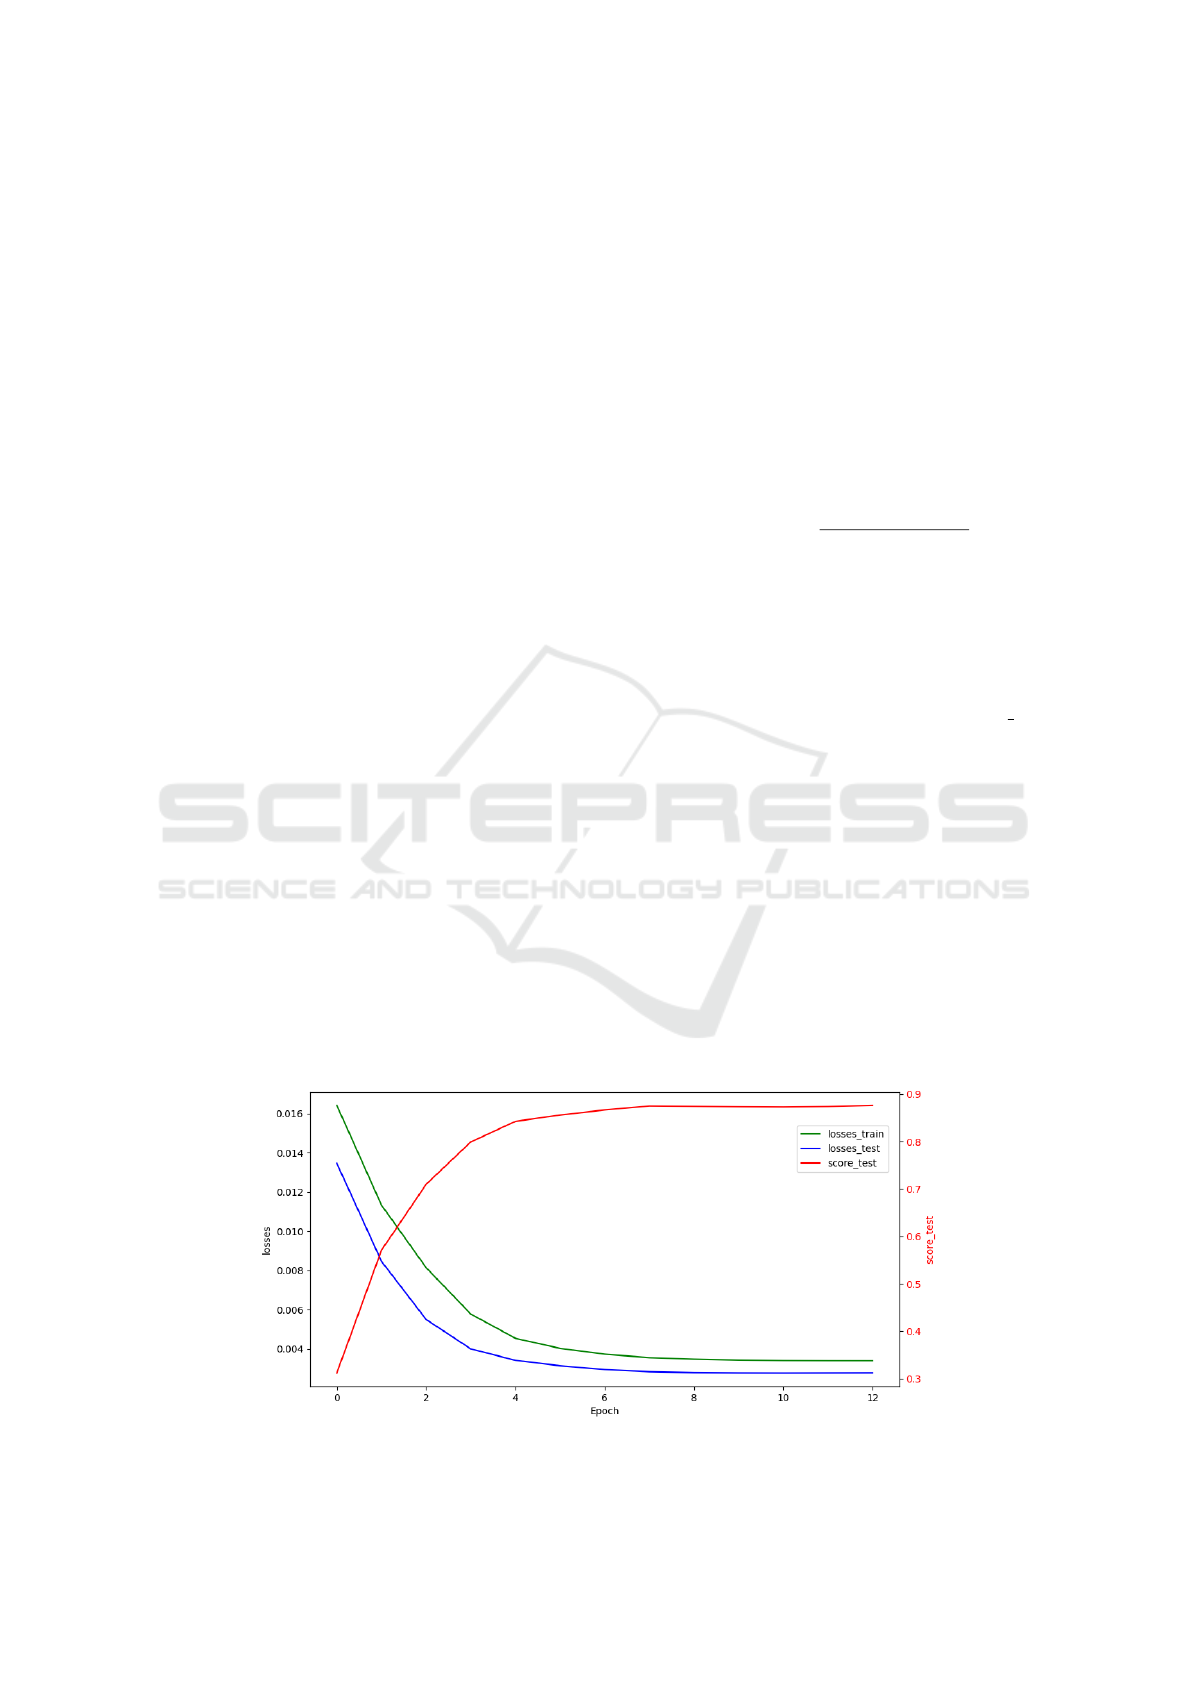
The loss values on the training set (green), testing
set (blue), and testing score (red) (P([UEs])) during
training phase visualized as Figure 2 (K-means GRU),
the loss values decrease over time, and the score test
parameter saturates at the 10-th epoch (87.11%).
We compare the performance of the GRU network
with LSTM. In Table 2, the Accuracy value is calcu-
lated as formula (13), Execute time is the inference
time of the model for each UE at each time point in the
testing phase, calculated by dividing the total execu-
tion time by the sample that performed the inference.
The K-means model combined with a 3-layer GRU
network is more accurate and executes faster than the
LSTM network (about 0.2 ms/sample). We changing
the number of GRU network layers, and observing the
change in accuracy: as the number of GRU network
layers increased, accuracy also increased, and when
this value reached 3, the accuracy stabilized, while
the execution time remained acceptable.
Figure 2: Performance results of KMeans-GRU model.
ICEIS 2025 - 27th International Conference on Enterprise Information Systems
722

Table 2: Accurary of methods (* is our method), KM is K-means.
Method KM-LSTM
KM-GRU
1 layers 2 layers 3 layers(*) 4 layers
Accuracy (%) 82.45 77.12 86.08 87.11 87.23
Execute time
1.520 1.346
(ms/sample)
5 CONCLUSION
In this paper, we present a novel approach for predict-
ing user movement behavior to facilitate the seamless
handover of User Plane Function (UPF) in network
environments. Initial results validate the effective-
ness of the proposed solution in addressing the key re-
quirements of the problem. However, significant chal-
lenges persist, particularly regarding the deployment
of the solution across the large-scale data generated
by the network.
As the number of base stations increases, the data
quality may degrade, especially in scenarios involv-
ing User Equipment (UE) with low mobility or base
stations with a limited number of active subscribers.
These factors contribute to increased variability and
complexity in the data, potentially impacting the ac-
curacy and efficiency of the solution. Therefore, fur-
ther experimentation and refinements are essential to
optimize the approach and ensure its robustness under
diverse real-world conditions.
REFERENCES
Ariffin, S. H., Abd, N., Ghazali, N. E., et al. (2013). Mobil-
ity prediction via markov model in lte femtocell. Inter-
national Journal of Computer Applications, 65(18).
Cho, K., van Merri
¨
enboer, B., Gulcehre, C., Bahdanau, D.,
Bougares, F., Schwenk, H., and Bengio, Y. (2014).
Learning phrase representations using RNN encoder–
decoder for statistical machine translation. In Pro-
ceedings of the 2014 Conference on Empirical Meth-
ods in Natural Language Processing (EMNLP), pages
1724–1734, Doha, Qatar. Association for Computa-
tional Linguistics.
Cho, K., Van Merrienboer, B., Gulcehre, C., Bahdanau, D.,
Bougares, F., Schwenk, H., and Bengio, Y. (2020).
Learning phrase representations using rnn encoder-
decoder for statistical machine translation. arxiv 2014.
arXiv preprint arXiv:1406.1078.
Faizan, M., Zuhairi, M. F., Ismail, S., and Sultan, S. (2020).
Applications of clustering techniques in data mining:
A comparative study. International Journal of Ad-
vanced Computer Science and Applications, 11(12).
Gou, F. and Wu, J. (2022). Message transmission strategy
based on recurrent neural network and attention mech-
anism in iot system. Journal of Circuits, Systems and
Computers, 31(07):2250126.
Hochreiter, S., Bengio, Y., Frasconi, P., Schmidhuber, J.,
et al. (2001). Gradient flow in recurrent nets: the dif-
ficulty of learning long-term dependencies.
Kakbra, J. (2014). Image classification using k-mean al-
gorithm. International Journal of Emerging Trends &
Technology in Computer Science (IJETTCS), 3:38–41.
Kim, B., Raza, S. M., Yang, H., Challa, R., Le, D.-T.,
Choi, H., Lee, D., Kim, M., and Choo, H. (2022).
ipaas: Intelligent paging as a service. IEEE Network,
37(2):238–245.
Liu, C.-L., Jou, E., and Lee, C.-H. (2010). Analysis and
prediction of trajectories using bayesian network. In
2010 Sixth International Conference on Natural Com-
putation, volume 7, pages 3808–3812. IEEE.
MacQueen, J. (1967). Some methods for classification and
analysis of multivariate observations. In Le Cam,
L. M. and Neyman, J., editors, Proceedings of the fifth
berkeley symposium on mathematical statistics and
probability, pages 281–297. University of California
Press.
Rahamathunnisa, U., Nallakaruppan, M., Anith, A., and
Kumar K.S., S. (2020). Vegetable disease detec-
tion using k-means clustering and svm. In 2020
6th International Conference on Advanced Computing
and Communication Systems (ICACCS), pages 1308–
1311.
Robusto, C. C. (1957). The cosine-haversine formula. The
American Mathematical Monthly, 64(1):38–40.
Schmidhuber, J., Hochreiter, S., et al. (1997). Long short-
term memory. Neural Comput, 9(8):1735–1780.
Subbiah, B. and Christopher, S. C. (2012). Image classi-
fication through integrated k-means algorithm. Inter-
national Journal of Computer Science Issues (IJCSI),
9(2):518.
Xiong, Z., Zhang, Y., Niyato, D., Deng, R., Wang, P., and
Wang, L.-C. (2019). Deep reinforcement learning for
mobile 5g and beyond: Fundamentals, applications,
and challenges. IEEE Vehicular Technology Maga-
zine, 14(2):44–52.
Yan, M., Li, S., Chan, C. A., Shen, Y., and Yu, Y. (2021).
Mobility prediction using a weighted markov model
based on mobile user classification. Sensors, 21(5).
Yin, H., Aryani, A., Petrie, S., Nambissan, A., Astudillo,
A., and Cao, S. (2024). A rapid review of clustering
algorithms. ArXiv, abs/2401.07389.
Zhang, Y., Hu, J., Dong, J., Yuan, Y., Zhou, J., and Shi, J.
(2009). Location prediction model based on bayesian
network theory. In GLOBECOM 2009-2009 IEEE
Global Telecommunications Conference, pages 1–6.
IEEE.
A Learning Approach for User Localization and Movement Prediction with Limited Information
723
