
Anomaly Detection for Partially Observable Container Systems Based on
Architecture Profiling
Isidora Erakovic and Claus Pahl
Free University of Bozen-Bolzano, 39100 Bolzano, Italy
fi
Keywords:
Container, Microservices, Anomaly Detection, Architecture Mining.
Abstract:
Managing and diagnosing faults in microservices architectures is a challenge, especially in a service provider
environment that hosts third-party services. Solutions such as anomaly detection can help, as anomalies often
indicate underlying problems that can lead to system failures. We develop an integrated solution that extracts
microservice architecture knowledge and detects anomalies using the architecture knowledge to provide con-
text for these anomalies. Our approach combines the use of latency thresholds with temporal distribution of
latency anomalies to determine normal behavior of a system and detect deviations that point to faults. The
solution proposed was validated using data from an Internet Service Provider’s microservices system. We
were able to identify critical components as key points of failure during fault conditions. The combined use
of architecture mining and anomaly detection enabled us to analyse anomalies in depth.
1 INTRODUCTION
Microservices allow large applications to be split into
smaller, independent services that are easier to man-
age and scale. This architectural style supports the de-
velopment of applications that can be updated and de-
ployed more frequently. However, the increased num-
ber of services and their interdependencies can lead to
challenges in system monitoring and anomaly detec-
tion (von Leon et al., ). Thus, an effective anomaly
analysis is crucial for ensuring the reliability and per-
formance of microservices (Ikram et al., 2022). While
much research has focused on anomaly detection in
microservices using log analysis and statistical meth-
ods, there has been limited exploration of specialized
tools that include architectural knowledge.
Our goal was to create a proof-of-concept frame-
work that combines different approaches, including
architecture mining and anomaly detection. We used
BIRCH clustering as part of our hybrid method to ex-
tract knowledge from microservice trace logs and val-
idate our results. We were able to better understand
patterns of latency spikes, which in turn helped us to
identify potential issues more accurately in terms of
dependencies between components.
A challenging aspect of this project was to ana-
lyze the available data in order to understand how the
microservices interacted and to identify the roles of
key components in the system. The task was to un-
derstand how microservice behaviour, including their
functions and how errors could propagate through the
system. We used architecture mining to map the con-
nections between the system components and under-
stand the overall architectural pattern, and anomaly
detection to identify abnormal behavior. Identifying
whether components shared similar roles or supported
different parts of the system was found to be critical to
understand the architecture and dynamics of the sys-
tem. A further constraint of our system was the as-
sumed unavailability of system metrics such as CPU,
network, memory or database utilization - which are
typically essential for a deeper cause analysis.
We will address the following key questions:
RQ1 - Spatial Perspective: What architectural in-
formation can be extracted from traces to support
anomaly detection? By mining trace logs, we were
able to extract key architectural details, such as com-
ponent interactions, dependencies, and data flow pat-
terns. This is called the spatial dimension as we
are interested in the structural architecture settings in
terms of call/invocation dependencies and also distri-
bution of components over hosts and resources.
RQ2 - Temporal Perspective: How exactly can
anomalies be detected using trace logs? We iden-
tify anomalies by applying suitable latency thresh-
olds and analyzing deviations from baseline system
behavior. The analysis of trace logs revealed spe-
cific latency patterns that indicated abnormal behav-
Erakovic, I. and Pahl, C.
Anomaly Detection for Partially Observable Container Systems Based on Architecture Profiling.
DOI: 10.5220/0013224900003950
In Proceedings of the 15th International Conference on Cloud Computing and Services Science (CLOSER 2025), pages 127-135
ISBN: 978-989-758-747-4; ISSN: 2184-5042
Copyright © 2025 by Paper published under CC license (CC BY-NC-ND 4.0)
127

ior, such as spikes in response times during fault in-
jection periods. This is called the temporal dimen-
sion as we are primarily interested in the time-based
change of anomalies, e.g., to distinguish sudden and
gradual changes in so-called anomaly patterns.
2 BACKGROUND
Microservices architecture allows an application to
be divided into independent and small services. We
worked with microservices deployed using Docker
(Merkel, 2014). Each container runs an application
and shares the host operating system’s kernel while
remaining isolated from other containers. This isola-
tion ensures that containers do not interfere with one
another, even though they share the same system re-
sources (Scolati et al., 2020).
Tracing is a technique used to monitor how re-
quests move through different services in a microser-
vice system. Each trace logs the request’s path, cap-
turing the services involved and step durations (Sigel-
man et al., 2010). As (Dragoni et al., 2017) empha-
size, effective tracing can significantly enhance the
ability to pinpoint performance bottlenecks and diag-
nose the root causes of issues.
Anomaly detection involves identifying patterns
that deviate from the norm, which could indicate po-
tential problems such as unexpected latency spikes,
increased error rates, or unusual resource usage. For
microservices, where services are distributed and in-
terdependent, early detection of anomalies is essen-
tial to prevent cascading failures and maintain system
reliability. Threshold-based approaches use specific
limits set for acceptable performance metrics. Behav-
ioral comparison methods (Forsberg, 2019) analyse
system behavior against established baselines.
3 RELATED WORK
Research in microservices has aimed to improve anal-
yses by creating tools to monitor and diagnose system
issues. Various studies have focused on tracing and
logging methods to understand system behavior, es-
pecially during failures (Fonseca et al., 2007). For in-
stance, X-Trace tracks the path of requests through a
system, crucial for pinpointing where problems start
and how they spread. Other tools, (Sigelman et al.,
2010), automate tracing to manage the complexity of
microservices without extensive manual effort.
(Forsberg, 2019) introduces an method for
anomaly detection and root cause analysis in mi-
croservice environments by learning normal behav-
ior patterns and identifying deviations. It emphasizes
the importance of modeling normal behavior to effec-
tively detect deviations that signify faults. (Mohamed
and El-Gayar, 2021) studied the impact of CPU and
network utilization on latency in microservices, high-
lighting that network utilization is a significant con-
tributor to latency spikes. High CPU utilization of-
ten lead to consistent performance degradation, while
network congestion tends to cause abrupt and unpre-
dictable latency spikes. (Komosny, 2022) showed that
anomalies typically occur when latency exceeds 150
ms in many applications. To understand latency dis-
tribution in our specific context, we use a study of
wireless ISPs (Sundberg S. and S., 2024). This study
showed that many subnets had latencies above 50 ms,
but only a few exceeded 100 ms. Based on this find-
ing, we decided to use a threshold of 100 ms to focus
on significant outliers in our similar ISP context.
A latency of 100 ms can mimic a network disrup-
tion that only affects directly connected services (Yu
et al., 2024). Their findings highlight the importance
of network topologies when analyzing latency spikes,
as the impact of faults can vary depending component
connections. To address CPU and memory faults, we
looked at (Samir and Pahl, 2020), which uses Hidden
Markov Models (HMMs) to detect problems such as
CPU hogs and memory leaks.
Finally, (Wang et al., 2023) provided insight into
how Increased message rates can lead to spikes in
CPU and memory usage, which in turn can lead to la-
tency variations (Wang et al., 2023), highlighting the
importance of monitoring message rates as an indica-
tor of underlying issues that could escalate.
4 ARCHITECTURE MINING
This section presents our architecture mining method,
focusing on analyzing the components and their inter-
actions in terms of call dependencies and architecture
patterns for different component types as formulated
in the first research question. This creates an architec-
tural profile. We evaluate the accuracy and complete-
ness of these results to ensure a thorough understand-
ing of the microservice system’s structure.
4.1 Trace Log Dataset
The main objectives of our study were to identify the
system’s architecture type and extract a detailed call
graph that reflects the interactions between compo-
nents. We performed trace log mining to extract this
architecture information. We used a dataset of trace
logs from a real ISP microservice system as a foun-
CLOSER 2025 - 15th International Conference on Cloud Computing and Services Science
128
dation for our research
1
. This was used to map the
system architecture and analyze error patterns by us-
ing the same dataset as Li et al. for their experiments
(Li et al., 2021).
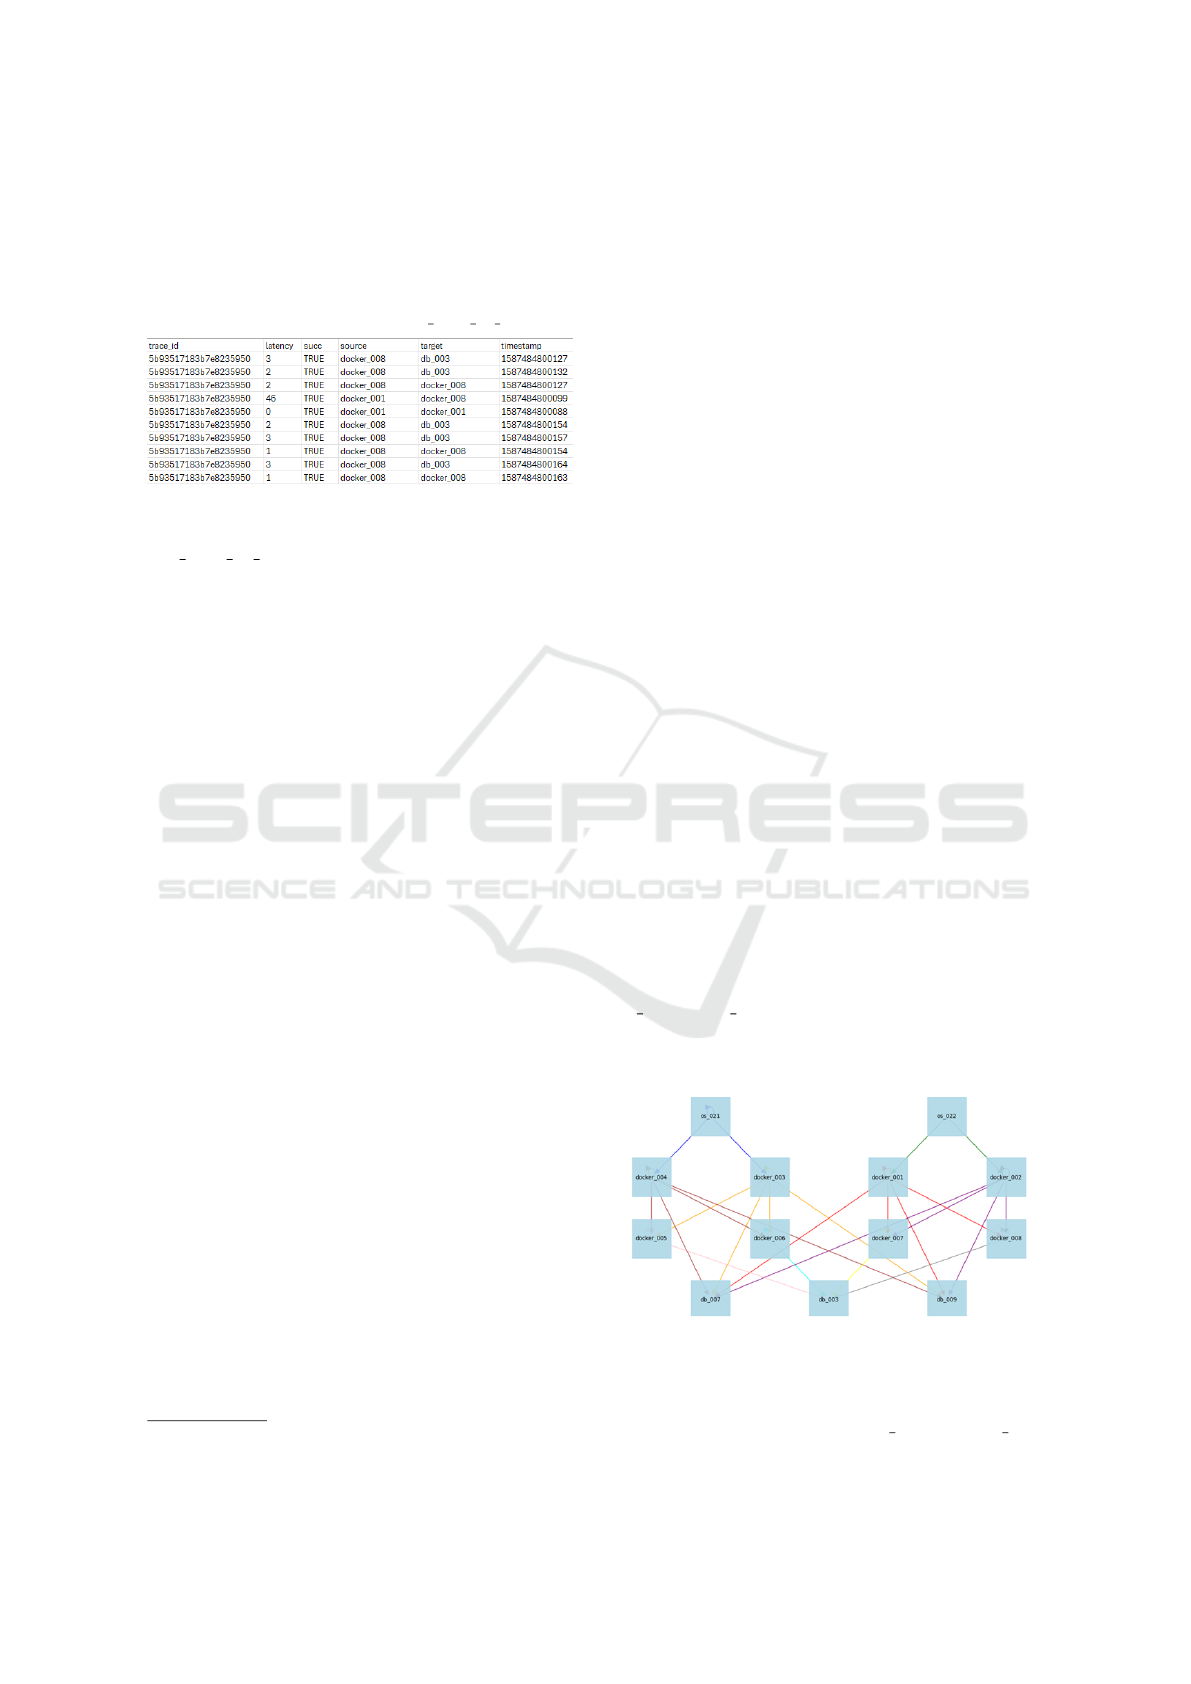
Table 1: Excerpt of the trace log (rca 2020 04 22.csv).
Table 1 shows a screenshot of the
‘rca 2020 04 22.csv‘ trace log file, which logs
interactions between different components of the
system such as containers and databases. Each
column in the table represents a different aspect of
the interaction: a unique identifier for each trace, the
latency value, a success indicator, source and target
of the interaction, and a timestamp.
This data structure is the basis for analyzing the
dependencies between microservices, and for validat-
ing that the recorded interactions match the fault in-
jection events documented in a separate file. Overall,
5 different types of CPU, network and storage faults
were injected (Li et al., 2021).
4.2 Call Dependencies and Patterns
The objectives of this analysis were to:
• Extract the structure of the architecture by identi-
fying call dependencies and creating a graph that
maps calling and called components.
• Determine the application type of the architecture,
such as identifying a generic architecture pattern
like load balancing.
For instance, (Poonam and Sangwan, 2020) provide
important insights into load balancing mechanisms,
especially the round-robin algorithm. This helped us
identify patterns in our system that indicated a bal-
anced distribution of requests across components and
were consistent with load balancing behavior. This
understanding was critical to analyzing how our sys-
tem handled interactions and distributed workloads.
In order to extract this information, the pre-
processed logs are parsed and analysed. We extracted
and visualized the interactions between components,
with the length of the lines automatically adjusted to
correspond to the number of interactions, thereby pro-
1
https://github.com/NetManAIOps/TraceRCA
viding a clear representation of communication in-
tensity between components. Additionally, we ex-
tracted a depiction of the system architecture, high-
lighting the layers of interactions and the role of each
component. This form was crucial for identifying the
load balancing pattern behavior and understanding the
overall data flow within the system.
The architecture mining steps are:
• Data Collection and Preparation: We imported the
log trace file to analyze component interactions,
and used the faults file to determine the timing and
location of fault injections.
• Component Identification: To identify and catego-
rize the unique components within the system, we
used the source and target columns from the in-
teraction data. This allowed us to group the com-
ponents into three main categories based on their
roles and interactions within the system.
• Interaction Analysis: By analyzing the flow of re-
quests and responses, we mapped the interactions
between these components. This helped us un-
derstand the communication patterns and depen-
dencies within the system. Visual representations
of these interactions help in identifying paths and
understanding the structure.
Below, we illustrate the architecture mining tech-
niques for the ISP use case in order to illustrate their
function and usefulness.
4.2.1 Structure and Call Dependencies
Through our analysis, we determined from the call
dependencies that the system had a well-defined mi-
croservices architecture, with components such as
os 021 and os 022 acting as the main entry points for
user requests. These components evenly distributed
requests across backend services, helping to manage
load and avoid bottlenecks.
Figure 1: Call dependencies: interactions between Docker
containers and databases within the system.
As shown in Figure 1, we observed that cer-
tain docker containers (docker 001, docker 002,
Anomaly Detection for Partially Observable Container Systems Based on Architecture Profiling
129

docker 003, docker 004) handled tasks that appeared
central to the system’s processing, suggesting that
these could be considered core services. Other
containers (docker 005, docker 006, docker 007,
docker 008) seemed to manage additional tasks that
supported the core functions. The system’s databases
(db 003, db 007, db 009) handled data storage oper-
ations, with interactions focused on storing data.
Based on the trace data, we found that most of the
interactions between the components appeared to be
synchronous. This conclusion was drawn from the
observation of sequential, low-latency events, where
one component waited for a response from another
before proceeding. We also observed some interac-
tions with higher latency and less tightly grouped tim-
ing. This suggested the possibility of asynchronous
communication in certain cases, where the initiating
component did not immediately depend on a response
to continue processing.
Overall, we observed a predominantly syn-
chronous communication pattern, with possible ex-
ceptions where timing and latency differed.
4.2.2 Invocations and Patterns
We performed an analysis of call paths and trace ID
distribution to gain insight into the flow of requests
and interaction patterns within the microservices ar-
chitecture.
Examining the distribution of interaction rows, it
was evident that user requests were initially handled
by os
021 and os 022, which balanced the traffic be-
fore passing it on to core processing services such as
docker 001 and docker 002. These services in turn
interact with the system’s databases (such as db 007
and db 009) for data management tasks.
The trace ID distribution showed that external re-
quests were split evenly between os 021 and os 022,
with core tasks handled by docker 001 through
docker 004. Supporting docker containers handled
specialized tasks. This was reflected in the higher
number of unique trace IDs. Each database handled a
similar number of trace IDs, and the volume of trace
IDs processed by the databases was double that of
docker containers interacting with them.
Thus, we can confirm a load balancing pattern
with respective roles of the respective components.
4.3 Evaluation of Architecture Mining
We focused on two evaluation criteria: accuracy and
completeness. Our goal was to ensure that the sys-
tem’s architecture was accurately mapped, identify-
ing all critical components and their interactions with-
out missing any significant elements. In addition,
we evaluated the validity of the architecture, ensur-
ing that it reflected the real-world system and adhered
to established patterns in microservice systems.
To ensure the accuracy and reliability of our archi-
tecture mapping, we used a combination of manual
verification and automated cross-checking. We com-
pared the generated architecture maps and component
profiles to system documentation and prior research
to validate the identified components and their inter-
actions. Our goal was to verify that the interactions
recorded in the rca 2020 04 22.csv file matched the
fault injection details, including date, time, and af-
fected components, as documented in the ret info.csv
file. Automated scripts were used to perform consis-
tency checks to ensure that dependencies and interac-
tions were accurately represented throughout the sys-
tem. This cross-verification was critical to confirm
that the observed interactions were correctly aligned
with the times when faults were injected, ensuring
that our analysis of the system architecture was based
on accurate and reliable data.
5 DETECTION OF ANOMALIES
In order to address the second research question, we
discuss the discovery of anomalies in a microservice
architecture drawing on the architecture mining re-
sults. To identify anomalous behavior, the obtained
results are examined in terms of failure rates and la-
tency values. The focus of the assessment criterion
for these outcomes is completeness and correctness.
5.1 Methodology
The objective is to detect anomalies within the ISP
system by analyzing trace logs for signs of abnor-
mal behavior. This involved observing latencies to
establish a baseline and identify potential issues. We
employed a threshold-based anomaly detection ap-
proach to identify significant deviations in system per-
formance (Ahmed et al., 2016). This method involves
setting specific latency thresholds to differentiate be-
tween normal and abnormal behavior, enabling the
identification of potential anomalies effectively. Ad-
ditionally, we analyzed success and failure rates to
further investigate the presence of anomalies.
5.2 Threshold-Based Anomalies
We present how anomalies can be detected using trace
logs within a microservices architecture. We explore
different methods to identify anomalies by analyzing
latency and interaction patterns across the system.
CLOSER 2025 - 15th International Conference on Cloud Computing and Services Science
130

We introduce first our approach to detecting
anomalies using predefined latency thresholds, in-
cluding a detailed analysis of 100ms and 50ms thresh-
olds, which we selected as suitable based on the liter-
ature review above for the specific ISP setting. Then,
we examine the anomaly patterns identified in the
data, highlighting how specific latency spikes corre-
late with system faults. Afterwards, we compare the
baseline latency before and after fault injections to
further validate our anomaly detection methods.
This builds on (Komosny, 2022) and (Sundberg S.
and S., 2024) that suggest that latency thresholds (150
ms and 100 ms, respectively) are effective in detect-
ing performance anomalies in our setting. (Reed and
Perigo, 2024) provide insights into latency variations
under load, with under-250 ms latencies typically be-
ing non-disruptive. (Forsberg, 2019) emphasizes the
importance of learning normal system behavior to
identify deviations.
The goals of our anomaly detection here were to:
• Identify abnormal behaviors in the system, par-
ticularly focusing on deviations in latency, error
rates, and interaction patterns.
• Establish thresholds and rules to detect anomalies
and distinguish them from normal system opera-
tions.
Unusual patterns were found by analyzing data in
the trace logs after they had been organized and pre-
pared for analysis, with a particular focus on latency
values. As an illustration, we visualized the spread of
latency values over time. We plotted the latency dis-
tribution across different time periods, clearly show-
ing when anomalies were detected. It also highlighted
specific time frames where spikes occurred, with a
focus on the number of interactions that exceeded
the set threshold. This visualization was key to un-
derstanding when and how the system’s performance
deviated from its normal behavior, helping to pin-
point the moments when faults were introduced (i.e.,
anomalies occurred).
In our study, we applied the insights from the lit-
erature to implement a latency threshold approach for
anomaly detection. We chose a 100 ms threshold
based on the literature and validated this against the
(Li et al., 2021) dataset. Forsberg’s approach guided
us in establishing baseline metrics, allowing us to de-
tect significant deviations. Additionally, we incor-
porated success/failure rates as an anomaly indicator,
marking any unsuccessful request as an anomaly.
• Latency-Based Anomaly Detection: We imple-
mented two approaches for anomaly detection:
one based on a predefined latency threshold, and
the other using the maximum latency observed
during the pre-fault period as the benchmark.
Python was utilized to automate the entire pro-
cess, from calculating latency values to threshold
analyses and generating relevant statistics.
• Success/Failure-Based Anomaly Detection: In
addition to latency-based detection, we utilized
failure analysis to identify anomalies. We moni-
tored requests that failed to complete successfully
and analyzed the corresponding time periods to
determine components with higher failure rates,
which pointed to potential issues.
In the following subsections, we present the re-
sults of the anomaly detection techniques applied to
the ISP use case, demonstrating their effectiveness
and practical value in identifying system issues tak-
ing into account the architectural roles and interac-
tions from the mining part.
5.2.1 Anomaly Threshold Calibration
To detect anomalies effectively, we implemented a
threshold-based approach. The calibration of these
thresholds was based on literature settings specific to
the architectural container setting that applies here.
Thus, we analyzed latency data using both 100ms and
50ms thresholds. These thresholds help to identify
spikes in response times that indicate abnormal be-
havior, especially during fault injection periods.
We evaluated each component based on latency
statistics, including minimum, maximum, average,
and median latency, as well as the number of interac-
tions and unique trace IDs that exceeded the analysed
thresholds.
Anomaly Patterns and Rates. The length (dura-
tion) of the critical system state and its change in sig-
nificance – i.e., the temporal latency spike distribution
– are important elements of a deep analysis.
We capture different temporal changes in the la-
tency anomalies for the components in form of pat-
terns such as gradual or steep increases (Azimi and
Pahl, 2024). The count of latencies over a given pe-
riod is also a factor. ROCOF resembles the count
of latency anomalies we use here for given period
to distinguish gradual and sharp increases of latency
anomalies, i.e., lower or higher ROCOF values in that
case.
Analysis with Defined Threshold of 100ms. We
analyse this in terms of anomalies per interaction,
component and trace.
Core statistics: In our analysis of the statistical
data for all components, we observed that docker 004,
Anomaly Detection for Partially Observable Container Systems Based on Architecture Profiling
131
os 021, and db 009 exhibited significantly higher
maximum latencies compared to other components,
which indicated potential anomalies within these
parts of the system. Additionally, os 021 and os 022
had higher mean and median latencies, which could
suggest that these components experienced consistent
latency issues or were more involved in interactions,
potentially handling a higher volume of requests or
more complex tasks.
The substantial number of interactions and dis-
tinct trace IDs exceeding the 100ms threshold across
all components indicated that this threshold was ap-
propriate. To confirm, we also analyzed the system
using a 50ms threshold, which showed consistent rel-
ative differences in component behavior, reinforcing
our decision to use the 100ms threshold.
Anomaly counts per Interaction: From our anal-
ysis of the data, docker 004 had more interactions
as a source component than any other component,
with a particularly high count of interactions with
itself (2,081). Notably, when os 021 and os 022
were the source components, they recorded nearly
the same number of interactions, with counts around
2,000. This pattern indicated that these components
were more involved in high-latency interactions, un-
derscoring their critical role in the system’s operations
during fault conditions.
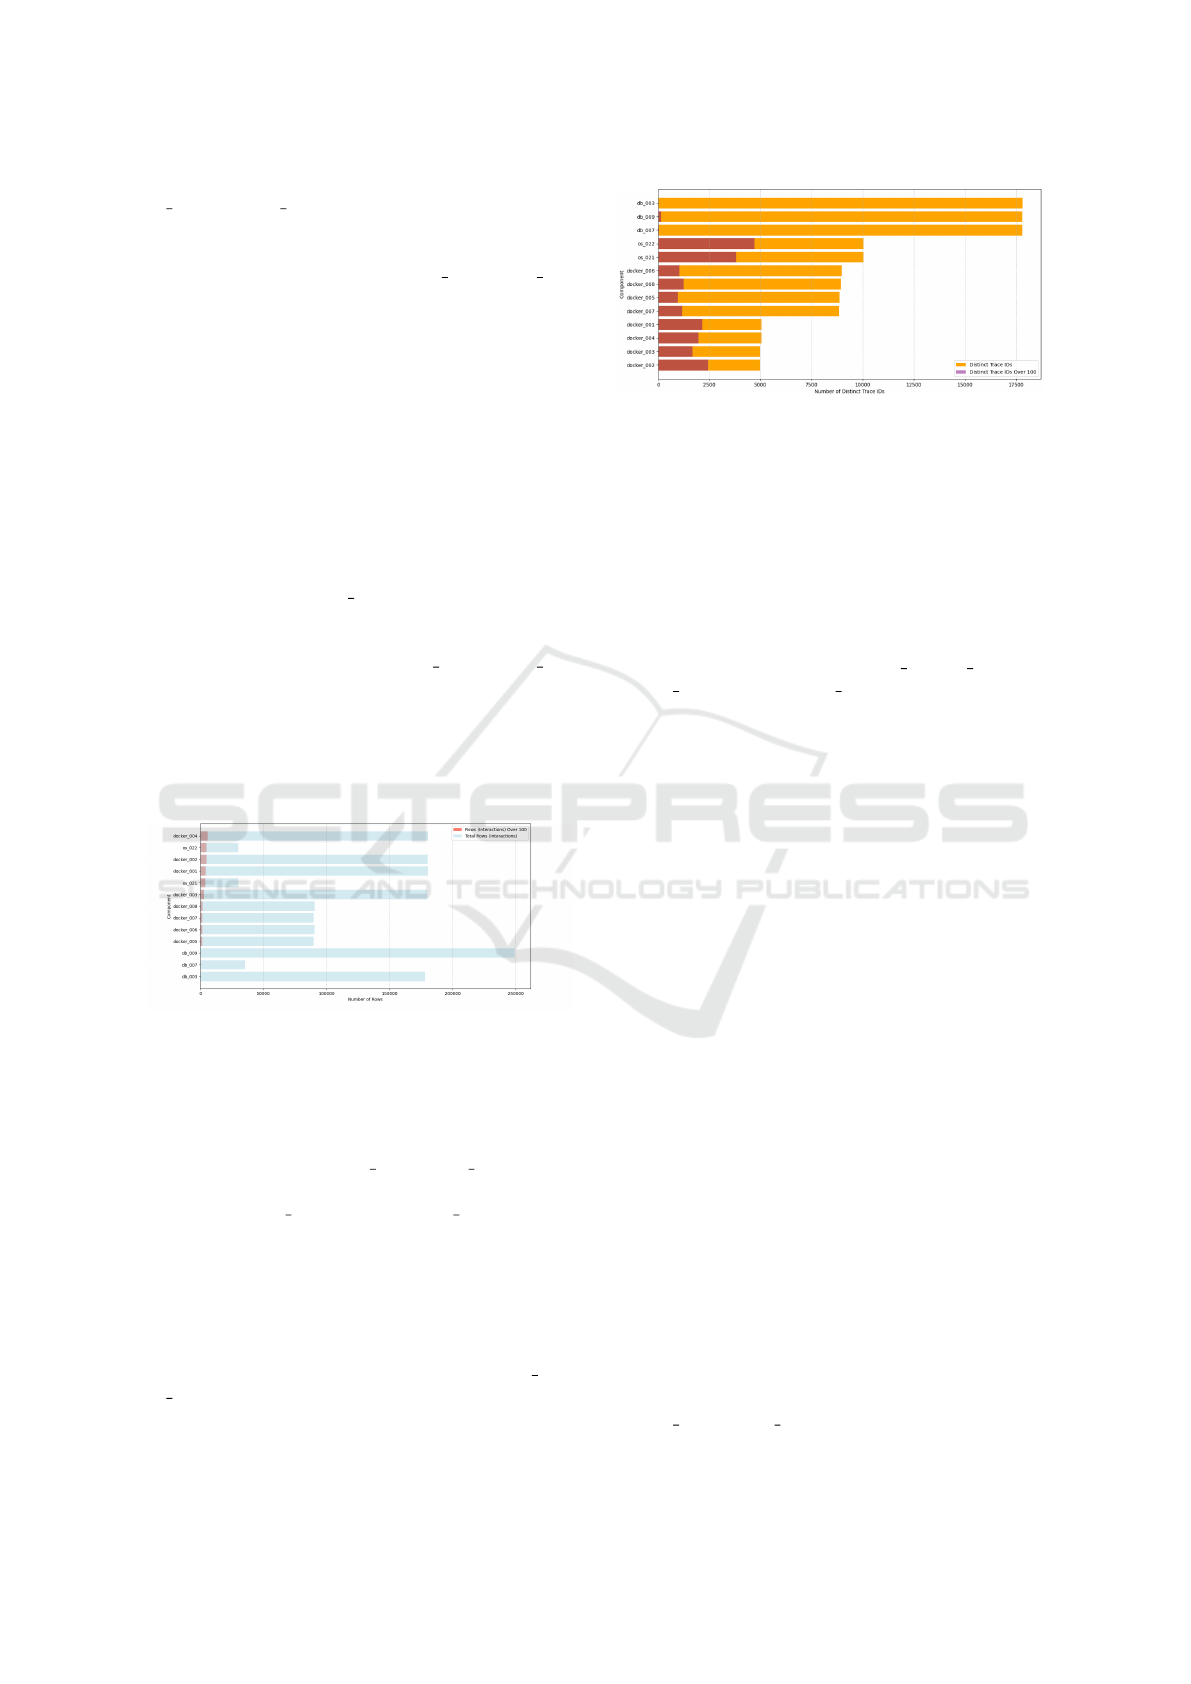
Figure 2: Comparison of Interactions with Latency Over
100ms and Total Interaction Counts per Component.
Anomaly counts per Component: Figure 2 com-
pares the number of interactions with latency exceed-
ing 100ms to the total interaction counts per compo-
nent. We observed that os 021 and os 022 had the
highest proportion of interactions over 100ms, fol-
lowed by docker 001 through docker 004. This in-
dicated that these components were more prone to la-
tency issues, likely due to their roles in handling pri-
mary interactions where fault was injected.
In contrast, the databases exhibited the lowest ra-
tios of high-latency interactions, suggesting they were
less affected by fault conditions. These findings di-
rected our anomaly detection focus towards os 021,
os 022, and the core docker containers.
Anomaly counts per Trace: Figure 3 compares the
Figure 3: Number of Distinct Trace IDs and Distinct Trace
IDs with Latency Over 100ms per Component.
total number of distinct trace IDs to those with laten-
cies exceeding 100ms for each component. We ob-
served that the databases had the highest number of
distinct trace IDs overall, indicating their extensive
involvement in system interactions. However, their
lower proportion of trace IDs exceeding the 100ms
threshold suggests these databases generally main-
tained efficient performance under fault conditions.
In contrast, components like os 021, os 022, and
docker 001 through docker 004 showed a higher pro-
portion of distinct trace IDs exceeding the 100ms la-
tency threshold. This finding indicates that these com-
ponents were more susceptible to performance degra-
dation during fault conditions.
When comparing this data to the earlier analysis of
interaction counts (Figure 2), it became more appar-
ent through trace ID analysis which components were
consistently involved in interactions that exceeded the
latency threshold, highlighting the components most
affected during the fault conditions.
Analysis with Defined Threshold of 50ms. The
50ms threshold analysis revealed similar latency pat-
terns to those observed at the 100ms threshold. While
the 50ms threshold captured a broader range of la-
tency issues, it did not alter the overall conclusions
regarding the impact of fault injection compared to
the 100ms analysis.
5.2.2 Anomaly Patterns and Architecture-Based
Anomaly Clusters
In judging latency anomalies, two dimensions are im-
portant: the changing scale of the latency over time
and the rate of latency occurrences over time (tempo-
ral distribution of spikes).
In Figure 4, we observed a specific latency pat-
tern: multiple significant latency spikes that also in-
creease occurring approximately 5 minutes into the
observation period, with the effects lasting for about
5 minutes. These spikes were most pronounced in
docker 004 and os 021, indicating that these com-
CLOSER 2025 - 15th International Conference on Cloud Computing and Services Science
132

Figure 4: Scale of Latency Over Time for Each Component:
Increasing Latency Spikes Pattern.
ponents were particularly impacted by the injected
fault during this time. Other components exhibited
relatively stable latency levels throughout the period,
which aligns with the anomaly detection results from
previous analyses.
In Figure 5, we can see that the count of la-
tency rows exceeding the 100ms threshold over time
for each component. We observed that docker 004,
docker 005, docker 006, db 007, and db 009 exhib-
ited similar patterns, indicating their involvement in
the same fault-affected communication path. We
call this an anomaly cluster of dependent compo-
nents where we have a causal dependency confirmed
through the architecture mining. In contrast, other
components maintained more stable counts of high-
latency interactions, suggesting they were less im-
pacted by the fault. This observation aligned with ear-
lier findings, highlighting the critical role these com-
ponents played during the fault condition.
Figure 6 shows a significant drop in interactions
for multiple components around the time of fault in-
jection, indicating the fault’s immediate impact on
overall system activity. We observed that docker 001
through docker 004 experienced a sharp decline in in-
teractions, followed by a recovery period. The com-
ponents appeared to be impacted according to their
level of interactions, with three distinct levels of inter-
action counts becoming evident. The synchronization
of these drops across several components suggested a
coordinated response to the fault, likely due to their
dependencies. Meanwhile, components like os 021
and os 022 maintained a relatively stable interaction
count, indicating a different role and overall number
of interactions as confirmed by the architecture min-
ing as entry points after the load balancer.
Failure Analysis. While the main focus in this in-
vestigation was on latency anomalies, we briefly look
at failure as well. We observed that all Docker compo-
nents had similar numbers of failed interactions, with
failures being relatively small compared to the over-
all number of interactions. Notably, all failures were
isolated to interactions within the components them-
selves, rather than in their communications with other
components. This suggests that while the faults af-
fected the internal processing within each Docker in-
stance, the inter-component communication remained
stable, demonstrating the resilience of the overall sys-
tem architecture to contain and manage faults at the
component level.
Figure 7 shows a sharp increase in failures for sev-
eral components around the time of fault injection.
However, the overall number of failures remained rel-
atively low compared to the total number of traces.
Despite the spike, the pattern of failures was consis-
tent with other observations, reinforcing the presence
of an anomaly during the fault period.
5.2.3 Baseline Latency Comparison
We identified a significant number of interactions that
exceeded the maximum latency observed during the
pre-fault period, particularly in docker 004. For ex-
ample, during self-interactions, docker 004 had 663
rows that exceeded this threshold, indicating a clear
anomaly. Similarly, its interactions with docker 005
and docker 006, as well as os 021’s interactions with
docker 004, also showed significant increases. These
findings point to docker 004 and its related interac-
tions as key areas where anomalies occurred.
Figure 8 shows that before the fault injection, the
latency patterns of all components over time were
consistent and recognizable. Each component exhib-
ited stable latency levels with no significant spikes,
indicating that the system was functioning normally.
The scatter plot in Figure 9 reveals significant la-
tency spikes during the fault injection period, partic-
ularly in components such as os 021 and docker 004.
These spikes highlighted the components most af-
fected by the anomaly.
5.3 Evaluation of Anomaly Detection
We focused on accuracy, assessing how well the
methods identified anomalies, and completeness, en-
suring that significant anomalies were detected.
We evaluated our anomaly detection approach by
first determining the most suitable latency threshold
(50 ms or 100 ms) for identifying issues in the sys-
tem. After selecting the threshold, we compared the
results of this threshold-based detection with a nor-
mal behavior approach, where anomalies were iden-
tified by deviations from pre-fault maximum laten-
Anomaly Detection for Partially Observable Container Systems Based on Architecture Profiling
133
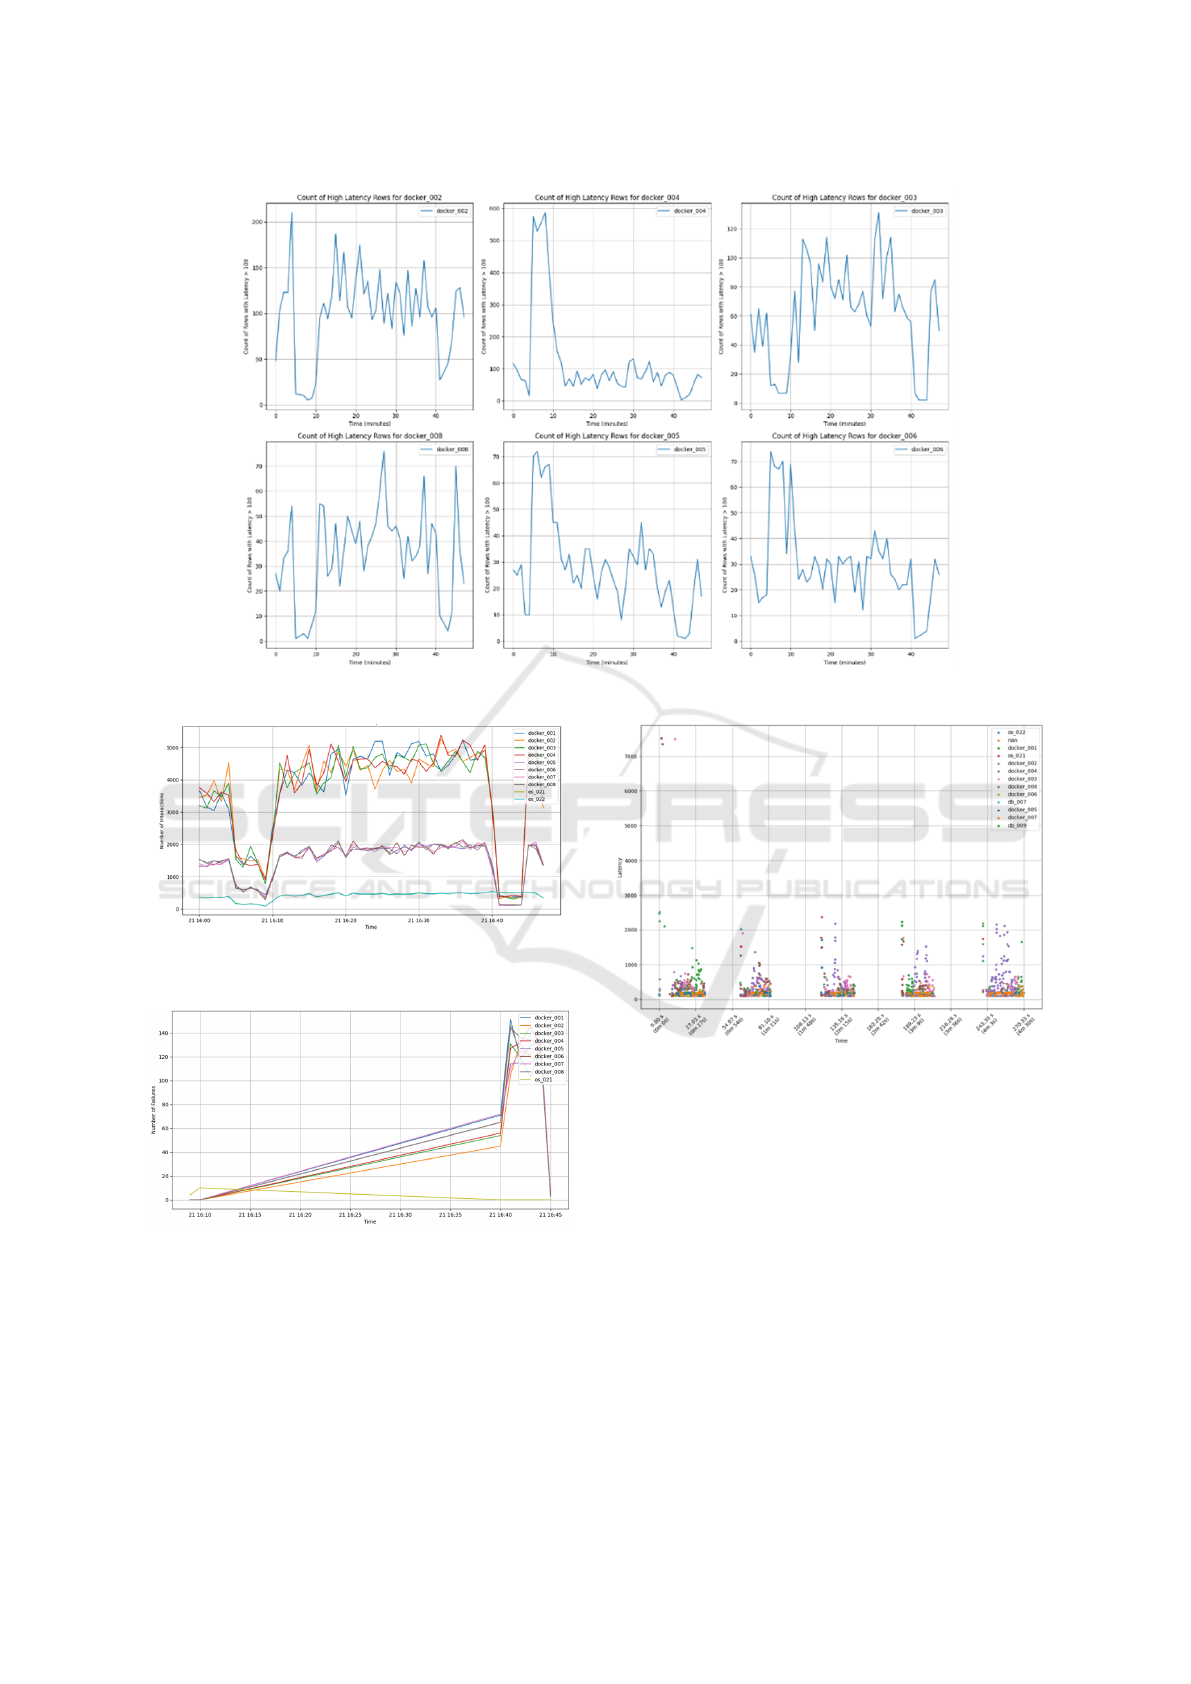
Figure 5: Count of Latency Interactions Exceeding 100ms Over Time for Each Component: Rate of Latency Occurrences.
Figure 6: Fault impact: Interactions Per Component Over
Time.
Figure 7: Failures Per Component Over Time.
cies. This comparison assessed the consistency of
anomaly detection across different methods. Addi-
tionally, we incorporated failure analysis as a metric
to detect anomalies. By monitoring and analyzing re-
quests that failed to complete successfully (success
flag set to FALSE), we identified components with
higher failure rates, which indicated potential anoma-
Figure 8: Latency Over Time for Each Component (Before
Fault Injection).
lies within those areas of the system. By using both
the threshold-based and normal behavior approaches,
as well as incorporating failure rate analysis, we en-
sured that no significant issues were overlooked.
6 CONCLUSIONS
We developed an integrated approach for diagnosing
faults in a microservices architecture. We mined logs
to extract microservices architecture knowledge and
effectively identified anomalies using latency thresh-
olds based on architecture knowledge. Our work pro-
vided detailed insight into the structure of the system,
CLOSER 2025 - 15th International Conference on Cloud Computing and Services Science
134
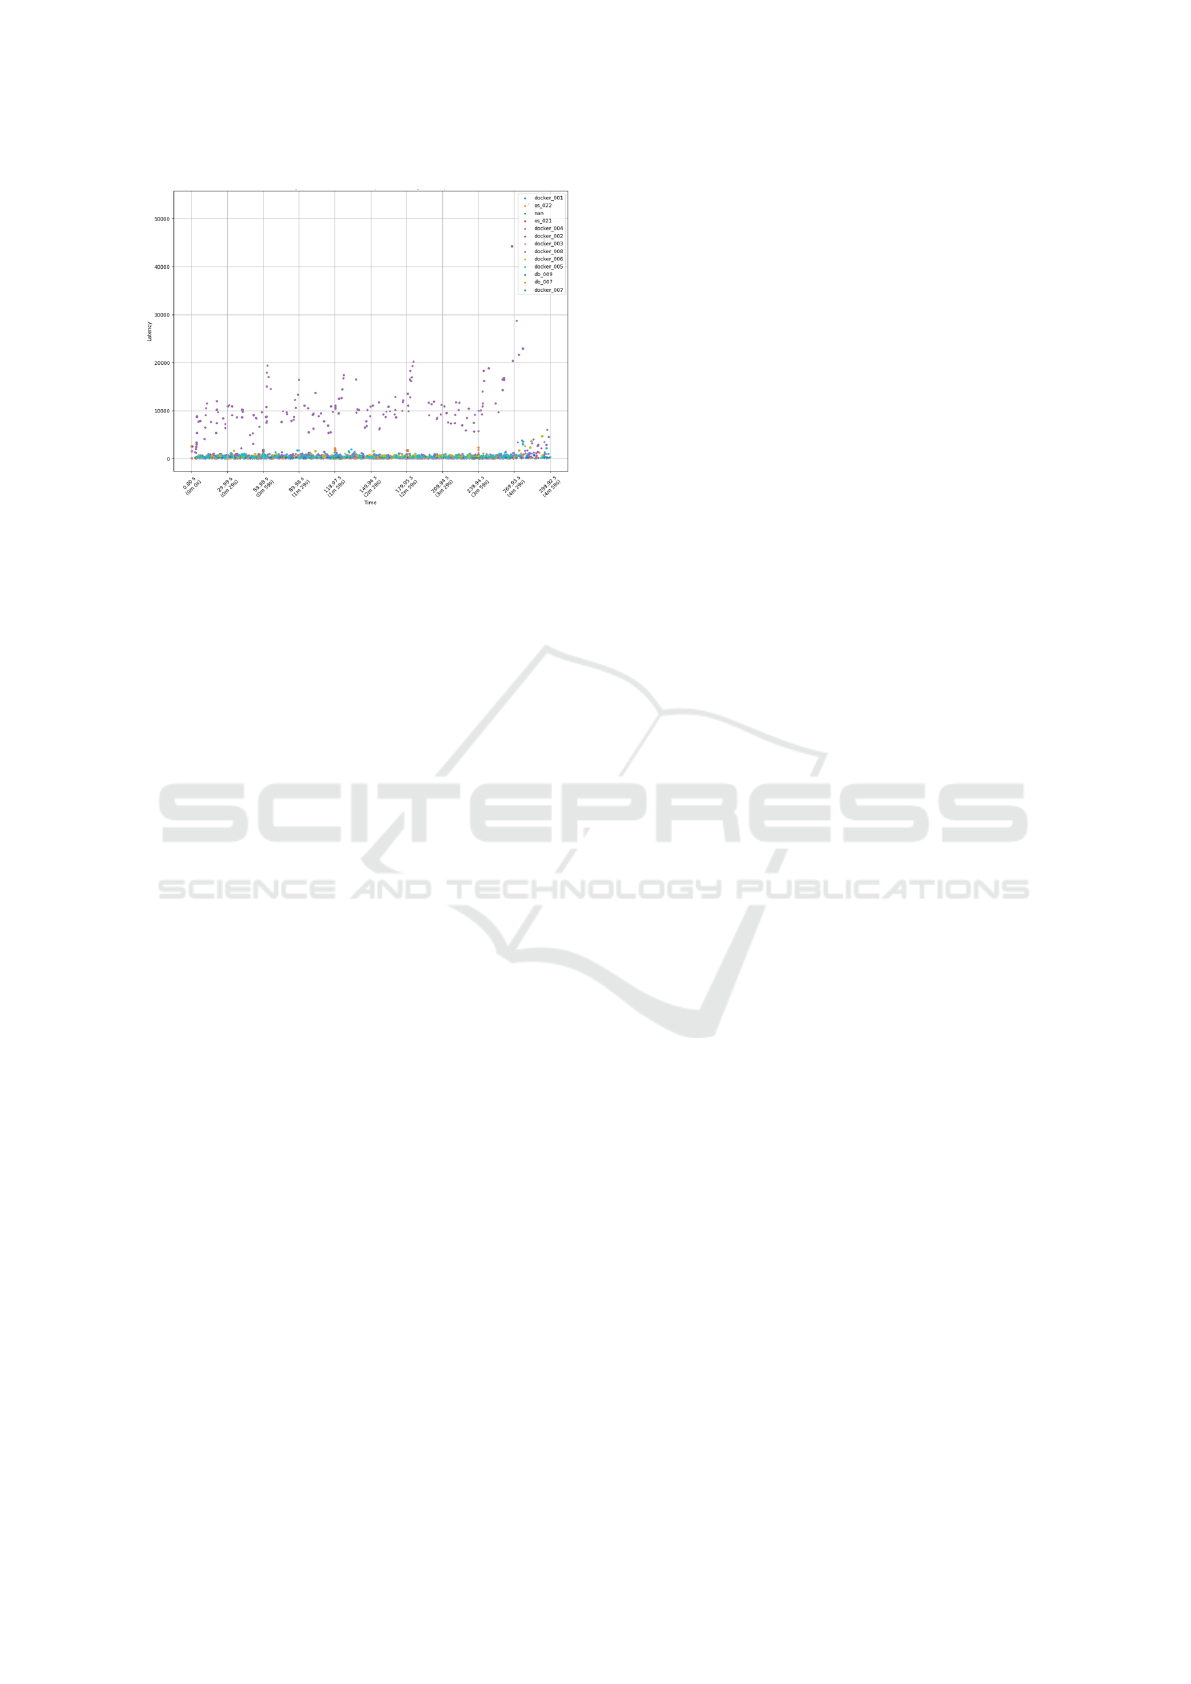
Figure 9: Latency Over Time for Each Component (During
Fault Injection).
helping to identify performance issues.
By demonstrating the effectiveness of a hybrid
approach that combines core architecture knowledge
with latency anomalies, this work contributes to the
development of more resilient and fault-tolerant dis-
tributed systems. We demonstrated that specific pat-
terns (architecture patterns such as load balancing or
anomaly change patterns such as gradual or steep in-
creases) can be identified and that this type of knowl-
edge is useful to complement other monitoring in-
sights, without being comprehensive in terms of pat-
tern coverage here. Our aim was a proof-of-concept
solution to demonstrate the utility of the approach.
Future research will add to automation, e.g., re-
mediation processes to complement our anomaly de-
tection in root cause analyses (Pahl, 2023). Currently,
the core of knowledge mining and anomaly detection
is automated, but not all pattern types are covered and
rely still on manual classification.
REFERENCES
Ahmed, M., Mahmood, A., and Hu, J. (2016). A survey
of network anomaly detection techniques. Journal of
Network and Computer Applications.
Azimi, S. and Pahl, C. (2024). Anomaly analytics in data-
driven machine learning applications. International
journal of data science and analytics, pages 1–26.
Dragoni, N., Lanese, I., Larsen, S., Mazzara, M., Mustafin,
R., and Safina, L. (2017). Microservices: yesterday,
today, and tomorrow. In Present & Ulterior SW Eng.
Fonseca, R., Porter, G., Katz, R. H., Shenker, S., and Sto-
ica, I. (2007). X-trace: A pervasive network tracing
framework. In USENIX Symposium.
Forsberg, V. (2019). Automatic anomaly detection and root
cause analysis for microservice clusters. Master’s the-
sis, Ume
˚
a University.
Ikram, A., Chakraborty, S., Mitra, S., Saini, S. K., Bagchi,
S., and Kocaoglu, M. (2022). Root cause analysis of
failures in microservices through causal discovery. In
International Conference on Software Engineering.
Komosny, D. (2022). General internet service assessment
by latency including partial measurements. PeerJ
Comput Sci, 8:e1072.
Li, Z., Chen, J., Jiao, R., Zhao, N., Wang, Z., Zhang, S.,
Wu, Y., Jiang, L., Yan, L., Wang, Z., Chen, Z., Zhang,
W., Nie, X., Su, K., and Pei, D. (2021). Practical root
cause localization for microservice systems via trace
analysis. In Intl Symp on Quality of Service.
Merkel, D. (2014). Docker: lightweight linux containers for
consistent development and deployment. Linux Jrnl.
Mohamed, H. and El-Gayar, O. (2021). End-to-end latency
prediction of microservices workflow on kubernetes:
A comparative evaluation of machine learning models
and resource metrics. In HICSS.
Pahl, C. (2023). Research challenges for machine learning-
constructed software. Service Oriented Computing
and Applications, 17(1):1–4.
Poonam, S. and Sangwan, S. (2020). A comparative study
of various load balancing algorithms in cloud comput-
ing environment. Intl Jrnl of Advanced Research in
Engineering and Technology, 11(12).
Reed, D. P. and Perigo, L. (2024). Measuring isp perfor-
mance in broadband america: A study of latency un-
der load. In University of Colorado Boulder.
Samir, A. and Pahl, C. (2020). Detecting and localizing
anomalies in container clusters using markov models.
Electronics.
Scolati, R., Fronza, I., El Ioini, N., Samir, A., Barzegar,
H. R., and Pahl, C. (2020). A containerized edge cloud
architecture for data stream processing. In Lecture
Notes in Computer Science. Springer.
Sigelman, B. H., Barroso, L. A., Burrows, M., Stephenson,
P., Plakal, M., Beaver, D., Jaspan, S., and Shanbhag,
C. (2010). Dapper, a large-scale distributed systems
tracing infrastructure. Google research.
Sundberg S., Brunstrom A., F.-R. S. and S., C. (2024). Mea-
suring network latency from a wireless isp: Variations
within and across subnets. Preprint.
von Leon, D., Miori, L., Sanin, J., El Ioini, N., Helmer, S.,
and Pahl, C. A lightweight container middleware for
edge cloud architectures. Fog and Edge Computing:
Principles and Paradigms.
Wang, R., Qiu, H., Cheng, X., and Liu, X. (2023). Anomaly
detection with a container-based stream processing
framework for industrial internet of things. Journal
of Industrial Information Integration, 35.
Yu, G., Chen, P., Chen, H., Guan, Z., Huang, Z., Jing, L.,
Weng, T., Sun, X., and Li, X. (2024). Microrank: End-
to-end latency issue localization with extended spec-
trum analysis in microservice environments. In Con-
ference on Computer Communications.
Anomaly Detection for Partially Observable Container Systems Based on Architecture Profiling
135
