
Detection of Arm Swing Limitations in Simulated Parkinson’s
Disease Gait Conditions: A Pilot Study
Carlos Polvorinos-Fernández
1
a
, Luis Sigcha
2
b
, María Centeno-Cerrato
1
c
,
Elena Muñoz-Bellido
1
, César Asensio
3
d
, Juan Manuel López
4
e
, Guillermo de Arcas
1
f
and Ignacio Pavón
1
g
1
Instrumentation and Applied Acoustics Research Group, Mechanical Engineering Department,
ETS Ingenieros Industriales, Universidad Politécnica de Madrid, Madrid, Spain
2
Department of Physical Education and Sports Science, Health Research Institute, & Data-Driven Computer Engineering
(D2iCE) Group, University of Limerick, Limerick, Ireland
3
Instrumentation and Applied Acoustics Research Group, Department of Audiovisual Engineering and Communications,
ETS. de Ingeniería y Sistemas de Telecomunicación, Universidad Politécnica de Madrid, Madrid, Spain
4
Instrumentation and Applied Acoustics Research Group, Department of Physical Electronics, Electrical Engineering and
Applied Physics, ETS. de Ingeniería y Sistemas de Telecomunicación, Universidad Politécnica de Madrid, Madrid, Spain
Keywords: Wearables, Gait, Machine Learning, Accelerometer, Gyroscope.
Abstract: Human gait is a biomechanical process vital to health, with abnormalities often linked to neurological
disorders like Parkinson's disease (PD). In PD patients, arm swing during walking becomes asymmetric and
reduced in amplitude, providing a potential biomarker for early diagnosis and monitoring disease progression.
This pilot study focuses on detecting variations in arm swing amplitude and asymmetry using data collected
from smartwatches worn by 24 participants under different gait conditions. Participants walked while carrying
progressively heavier loads (0 kg, 2 kg, and 4 kg) to simulate restricted arm swing. Machine learning models
were developed to classify these conditions using accelerometer and gyroscope data. Results showed that the
K-Nearest Neighbours algorithm performed best, achieving up to 94.3% accuracy. Although the models
effectively distinguished between load and no-load conditions, it was difficult to differentiate between
different load levels. These findings highlight the potential of wearable devices for PD gait analysis, though
further refinement and testing with PD patients are needed for clinical application.
1 INTRODUCTION
Human gait is the biomechanical process of
locomotion, characterized by the coordinated,
rhythmic alternation of weight-bearing between the
lower limbs, enabling forward movement while
maintaining an upright posture. Although the walking
process is unique to everyone, commonalities exist
that enable the definition of a characteristic and
a
https://orcid.org/0000-0002-4594-9477
b
https://orcid.org/0000-0002-9968-5024
c
https://orcid.org/0009-0007-0113-3007
d
https://orcid.org/0000-0003-3265-3244
e
https://orcid.org/0000-0001-7847-8707
f
https://orcid.org/0000-0003-1699-7389
g
https://orcid.org/0000-0003-0970-0452
standardized pattern for normal human gait (Braune
& Fischer, 1987).
During gait, the central nervous system generates
oscillation of the arms to stabilise gait, regain balance
and reduce energy expenditure. Due to the close
relationship between arm swing and gait, it is
common for gait estimations, such as step counting,
to be derived by monitoring arm swing movements
(Meyns et al., 2013).
Polvorinos-Fernández, C., Sigcha, L., Centeno-Cerrato, M., Muñoz-Bellido, E., Asensio, C., López, J. M., de Arcas, G. and Pavón, I.
Detection of Arm Swing Limitations in Simulated Parkinson’s Disease Gait Conditions: A Pilot Study.
DOI: 10.5220/0013231600003911
Paper published under CC license (CC BY-NC-ND 4.0)
In Proceedings of the 18th International Joint Conference on Biomedical Engineering Systems and Technologies (BIOSTEC 2025) - Volume 2: HEALTHINF, pages 1029-1036
ISBN: 978-989-758-731-3; ISSN: 2184-4305
Proceedings Copyright © 2025 by SCITEPRESS – Science and Technology Publications, Lda.
1029

Gait biomechanics is fundamental to health, as
various diseases can disrupt the mechanical
interactions involved, leading to impaired movement,
instability, or mobility limitations. Many gait
abnormalities arise involuntarily and are primarily
linked to neurological, musculoskeletal, or systemic
disorders, further impacting an individual's functional
capacity (Cicirelli et al., 2022).
Festinating gait, characterized by an accelerated
and unsteady walking pattern with short, rapid steps
that seem to propel the individual forward, is one of
the most common motor symptoms observed in
patients with Parkinson’s Disease (PD).
PD is a progressive neurodegenerative disorder
that affects the central nervous system, resulting in
both motor and non-motor symptoms. The condition
arises when dopamine-producing neurons in the brain
become deficient, leading to impaired motor control
and other systemic effects (Wirdefeldt et al., 2011).
Symptoms of PD usually manifest gradually, with
a barely perceptible tremor in one hand often being
the initial sign in most cases. While tremors are
common, the disorder may also cause muscle
stiffness and reduced movement. The movements
become reduced in amplitude, speed, and symmetry,
leading to increased fatigue and the adoption of
compensatory postures to maintain balance (Morris et
al., 2001).
These motor symptoms affect not only gait in the
lower limbs but also arm swing. Therefore, in PD
patients, the arm swing has a lower amplitude,
cadence and step width during gait. In addition, the
PD usually manifests with more pronounced effects
on one side of the body., which causes the effects on
gait to be reflected asymmetrically, both in the legs
and in the arm swing (Djaldetti et al., 2006).
Individuals with PD demonstrated significantly
greater asymmetry in arm swing compared to those
without gait pathology (Lewek et al., 2010).
Based on this premise, the present case study was
designed. The objective is to develop a restricted arm
swing classifier focused on detecting variations in
amplitude and asymmetry using machine learning
models. To achieve this, an experiment was
conducted in which participants wore a smartwatch
and were subjected to progressively restricted gait
conditions, from least to most constrained, to simulate
different levels of restricted arm swing.
Under these restrictions, the braking speed of arm
swing is expected to be affected in a manner that can
be detected by the smartwatch. To simulate this
effect, different loads (0 kg, 2 kg, and 4 kg) were used
during various gait measurements. As the load
increases, a reduction in the swing angle is
anticipated, recreating similar conditions to the
movement restrictions experienced by PD patients.
The asymmetry in arm swing may serve as a
valuable biomarker for the early diagnosis of PD and
for monitoring disease progression in its initial stages.
2 BACKGROUND
In recent years, numerous studies have investigated
the potential of wearable devices for healthcare
applications. Some research has concentrated on the
development of specialized devices, like STAT-ON®
(Rodríguez-Martín et al., 2019), while others have
utilized commercially available devices to assess PD
symptoms (Polvorinos-Fernández, et al., 2024;
Sigcha et al., 2023). Wearable devices allow the
definition of a wide range of digital biomarkers
related to PD motor symptoms such as tremor,
bradykinesia or gait disturbances (Polvorinos-
Fernández, et al., 2024).
A study conducted by (Warmerdam et al., 2020)
using a wrist-worn inertial sensor to compare the gait
patterns of a healthy individual with those of a PD
patient exhibiting gait impairments. The results
revealed that the gait of the PD patients was non-
cyclical, with numerous fluctuations and
irregularities, in contrast to the healthy individual's
gait, which displayed a repetitive and cyclical pattern.
(Takami et al., 2020) performed gait tests using a
accelerometer measurement device with healthy
individuals under varying conditions: normal gait,
gait with one arm restricted, both arms restricted, and
exaggerated arm swing in the Wernicke-Mann
position. The results showed that, compared to
normal gait, arm swing velocity significantly
decreased when participants performed gait exercises
with one arm restricted or with no arm movement.
(Siragy et al., 2020) studied how PD patients with
and without arm swing restriction walked over
different terrains. The arm-swing analysis revealed
that PD patients appropriately reduced their step
length as a compensatory mechanism for the
restricted arm swing.
The need for advanced tools to improve the
diagnosis and continuous monitoring PD is
increasingly evident. The use of smart technologies
for managing diseases like PD is gaining popularity,
with wearable technologies standing out due to their
low cost, long battery life, and non-invasive nature.
These features make them ideal for developing
continuous monitoring systems for PD.
In the case of gait observation, providing
objective, gait-based measurements, wearable sensor
WHC 2025 - Special Session on Wearable HealthCare
1030

systems allow clinicians to personalize rehabilitation,
therapeutic, or pharmacological interventions to meet
each patient’s specific needs. This personalized
approach enhances treatment efficacy and contributes
to more effective management of disease progression.
This pilot study presents a starting point for the
identification of abnormal gait patterns in patients
with PD. The proposed algorithm could be used for
early detection of movement disorders, with a
specific focus on analysing braking dynamics during
gait, based on data collected from a wearable device.
3 MATERIALS AND METHODS
3.1 Data Collection
The data used in this study were collected during the
BIOCLITE project, using a custom-designed m-
health wearable application, which utilized
smartwatches to track motor symptoms in PD
patients.
Data were collected from a group of 24
volunteers, with a balanced gender distribution and
ages ranging from 24 to 40 years, with no known gait
pathology (Polvorinos-Fernández, et al., 2024). All
participants were persons without known pathologies
and performed the three specific activities outlined in
the protocol of this work. Data collection covered a
period of two days in which, in five to ten minutes
interval, each participant performed the three
proposed activities.
3.2 Acquisition Device
The BIOCLITE project use a commercial smartwatch
for data collection. During each of the measurement
sessions the smartwatch was worn on each patient's
preferred wrist. This wearable device allows to
collect movement signals in the time domain using its
built-in inertial sensors. For this study, the
accelerometer and gyroscope (along three axes) were
used for data collection. The accelerometer measured
in m/s², while the gyroscope measured in rad/s.
In this work, the smartwatch used for data
collection has a dimension of 39.3×40.4×9.8 mm and
a weight of 28.7g. The smartwatch is equipped with
an LSM6DS0 package, which integrates a 3-axis
digital gyroscope and a 3-axis digital accelerometer.
The sampling frequency is configured at 50 Hz.
This frequency was chosen because it is well-suited
for the analysis of human movement, which typically
focuses on a frequency range of 0.8 to 1.5 Hz during
normal and abnormal gait (Winter, 2009).
3.3 Experimental Protocol
During the data collection sessions, each participant
performed a test under different conditions to
approximate several gait conditions.
Each participant must walk in a straight line from
the starting point to a marked point, wait for 3 seconds
at that point, turn around to change the direction of
movement, wait another 3 seconds and walk back to
the starting point. Participants were instructed to
perform the test at their preferred walking speed,
repeating the process three times: once with no load,
a second time carrying a 2 kg weight, and a third time
carrying a 4 kg weight. This order was established to
try to avoid fatigue affecting the participants, even
though there was a rest period between each test.
For each participant and each performed test, a
researcher was responsible for starting the recording
of the data from the smartwatch, indicating to the
participants the start of the test, logging the exact time
at which the test had started, and, once the test had
been completed, stopping the measurement. In this
case, the activities were not recorded with a video
camera due to patient privacy issues.
The measurement track was a straight corridor
where the point of departure and return was marked
with a cross on the ground. The straight section is 30
metres long, and the corridor is more than 5 metres
wide, which allowed the measurement session to be
carried out without any problems.
For each participant and activity, a new file was
created. Therefore, considering that there were 24
participants and 3 different activities, a total of 72
data files were obtained.
3.4 Data Labelling
For data labelling, the name of the files generated
with the custom-designed m-health smartwatch
application was essential. This name identifies which
device was used (this information is not valid for this
study given that all the performed tests were carried
out with the same device) together with the date on
which it was created and the exact time at which the
recording was started.
Based on this date and time, each of the records
was assigned a person label (1 to 24) and an activity
label (1 for no load gait, 2 for 2 kg gait and 3 for 4 kg
gait), correlating with the manual registration made
by the person in charge of the trials, who takes notes
of which person carried out each activity as well as
the starting time. These labels were then reviewed by
viewing each file to ensure that they matched and
contained valid data records.
Detection of Arm Swing Limitations in Simulated Parkinson’s Disease Gait Conditions: A Pilot Study
1031
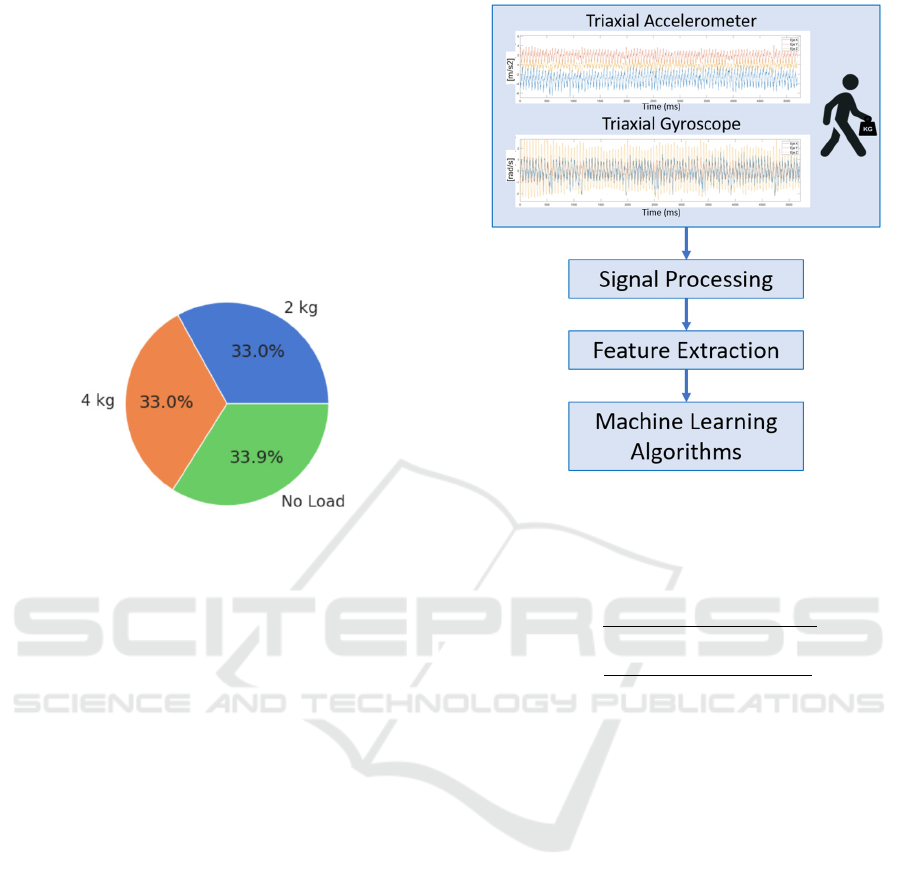
Figure 1 shows the distribution of data collected
according to the activity label. It can be observed that
the distribution is homogeneous among the 3 gait
conditions. The slight differences observed between
activities can be attributed to the fact that participants
were allowed to choose the speed at which they
performed each test. Consequently, variations in
walking speed among participants resulted in
differences in the number of samples collected, as the
sampling rate is the same for all the subjects. The
activity with the highest number of samples is the one
related to walking without loads.
Figure 1: Distribution of data collected according to the
activity label.
3.5 Algorithmic Approach
This paper presents machine learning models
designed to predict the level of hand movement
constraint (free, 2 kg or 4 kg) using data from
accelerometer and gyroscope. The development of
these models followed the schema shown in Figure 2.
To train and evaluate the proposed models, the
signal obtained from the smartwatch must be
processed to get better results.
First, the valid parts of each of the records were
selected, as the periods from the start of the recording
until the person starts walking, the standing period
before and after the turn, the turn itself, and the period
from the end of the activity until the end of the
recording were not used. As a result, since there are
two gait periods for each record (outward and return),
the final database of 144 valid records was defined.
On this basis, this study was performed using two
different databases. On the one hand, the
accelerometer and gyroscope signals from each of the
3 axes were used independently (6 signals in total).
On the other hand, the signal obtained from each of
the three axes of each sensor was combined into one
by means of Euclidean Norm according to equations
1 and 2 (2 signals in total). This is since the inertial
sensors embedded in the wearable device can have a
random orientation, so this combination has been
performed to avoid errors. In addition, during the
Figure 2: Algorithm approach diagram.
experimental phase, the participants placed the
smartwatch in different ways and the orientation of
the watch is different for the left and the right hand.
𝐴
𝑐𝑐𝑒𝑙
𝑎𝑐𝑐𝑒𝑙
𝑎𝑐𝑐𝑒𝑙
𝑎𝑐𝑐𝑒𝑙
(1)
𝐺𝑦𝑟𝑜
𝑔𝑦𝑟𝑜
𝑔𝑦𝑟𝑜
𝑔𝑦𝑟𝑜
(2)
After calculating the Eucliden norm, the
following steps to be explained apply both to the 3
axes separately and to the combination of these. The
signal was filtered using a 3-order Butterworth band-
pass filter in the frequency range between 0.5 and 10
Hz. This range is appropriate for human activity
recognition, in particular, human gait (Winter, 2009).
After adjusting the signal to the desired frequency
range, it was segmented into 128-sample windows
(2.56 seconds) with a 50% overlap. For the 144
records, 2454 windows were generated. This
combination of windowing and overlapping is
suitable for different PD motor symptoms analysis
(Patel et al., 2009; Sigcha et al., 2021). As the data is
divided by records and each one corresponds to a
different participant and activity, dividing each of
these records into windows did not create a problem
regarding labelling, as all the windows had the same
labels associated with their source records.
Then, the signal was converted to the frequency
domain using the Fast Fourier Transform (FFT). This
was because it is expected that the dominant
WHC 2025 - Special Session on Wearable HealthCare
1032
frequencies of braking during walking will allow a
correct differentiation between individuals walking
freely and those carrying varying weights., so
bringing the data into the frequency domain can be a
key aspect to obtain good results. Since the sampling
frequency is defined as 50 Hz, the maximum
frequency for which data is available is 25 Hz (higher
than the usual frequency of human movement). In this
case, 65 spectral lines were calculated using the FFT,
each with a bandwidth of approximately 0.38 Hz.
For this work, the extracted features correspond to
the amplitude of each of the 65 spectral lines of each
signal. For the database formed by the original signals
in 3 axes, and for 2 sensors (accelerometer and
gyroscope), we will have 390 features. In the database
composed of the Euclidean signal of accelerometer
and gyroscope, 130 features will be calculated. In
both databases, all the proposed features were
calculated for the 2454 defined windows.
After the feature extraction process, machine
learning models were developed, trained, validated,
and analysed with the two databases independently to
evaluate their performance and effectiveness in
addressing the study objectives. For the training and
testing of the models, the windows defined for 21 of
the 24 participants were divided into 60% training
and 40% test, using Hold Out Validation. The 3
remaining participants (randomly selected) were used
to validate the trained models, with the aim of testing
the reliability of the models on data never seen before.
For this work, the variable to be predicted is the
one corresponding to the activity category, related to
whether, during the walk, the person was walking
without load (label 0), with 2 kg (label 1) or with 4 kg
(label 2). Since the target variable is categorical,
classification models were employed. The models
used in this study include Gradient Boosting (GB),
AdaBoost (ADAB), K-Nearest Neighbours (KNN),
Random Forest (RF), and Decision Tree (DT). The
models were evaluated using accuracy, recall,
specificity, precision, and F1-score metrics.
4 EXPERIMENTS AND RESULTS
This section presents the results obtained from the
study, which involved conducting various
experiments with different datasets. Section 4.1
details the results derived from the 3-axis signals of
the accelerometer and gyroscope. Section 4.2
presents the findings based on the Euclidean norm of
the combined signals from both sensors. In each
section, the model with the best performance was
identified, and validation of this model was carried
out using data from three randomly selected subjects.
4.1 Results of the Training Models
Using the 3-Axis Database
The classification models proposed in Section 3.5
were implemented and trained using the dataset of
390 features extracted from the frequency domain for
each triaxial signal of accelerometer and gyroscope.
First, it will be determined which of the models
proposed is the one that offers the best performance.
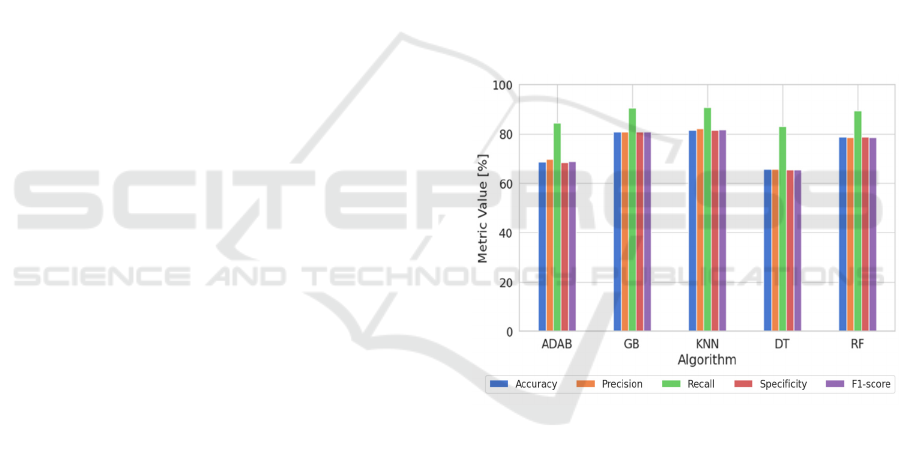
Figure 3 show the metrics obtained for each trained
machine learning model using the testing data.
It is noteworthy that recall values are high across
all models. This indicates that the models effectively
identify most of the true positive cases, i.e. the models
are less likely to miss relevant cases, which makes
them suitable for tasks where it is a priority to capture
all positive cases, such as in medical diagnosis, of
possible application in this study.
Figure 3: Metrics comparison for the proposed algorithm
using 3-axial accelerometer and gyroscope test data.
The analysis revealed that the KNN algorithm
demonstrated the best performance among the
evaluated models., with an accuracy of 81.5 %, a
precision of 82.0 %, a recall of 90.8 %, a specificity
of 81.4 % and a F1-score of 81.6 %. On the opposite
side, the worst model is the DT with 69.4 %, 69.3 %,
84.8 %, 69.2 % and 69.1 % in respective metrics.
Table 1 shows in detail the metrics obtained with the
test dataset for the best model.
It can be noticed that there is a trend towards
classification performance. For the identification of
no-load gait, related to the movement without loads,
the specificity, recall, precision and f1-score metrics
have a high performance, between 88,01 % to
98,42%. On the other hand, for observations related
Detection of Arm Swing Limitations in Simulated Parkinson’s Disease Gait Conditions: A Pilot Study
1033
to loaded movement, these metrics are relatively
lower, with values from 74,22% to 87,19 %.
However, the overall accuracy of the 3 categories is
81.51 %, which is quite high, considering that we are
working with a not very extensive database.
Table 1: Metrics obtained for KNN algorithm for the 3-axis
test dataset.
[%] No Load 2 kg 4 kg
Accuracy 81,5
Precision 96,6 74,2 75,2
Recall 88,0 75,5 80,8
Specificity 98,4 87,2 86,8
F1-score 92,1 74,9 77,9
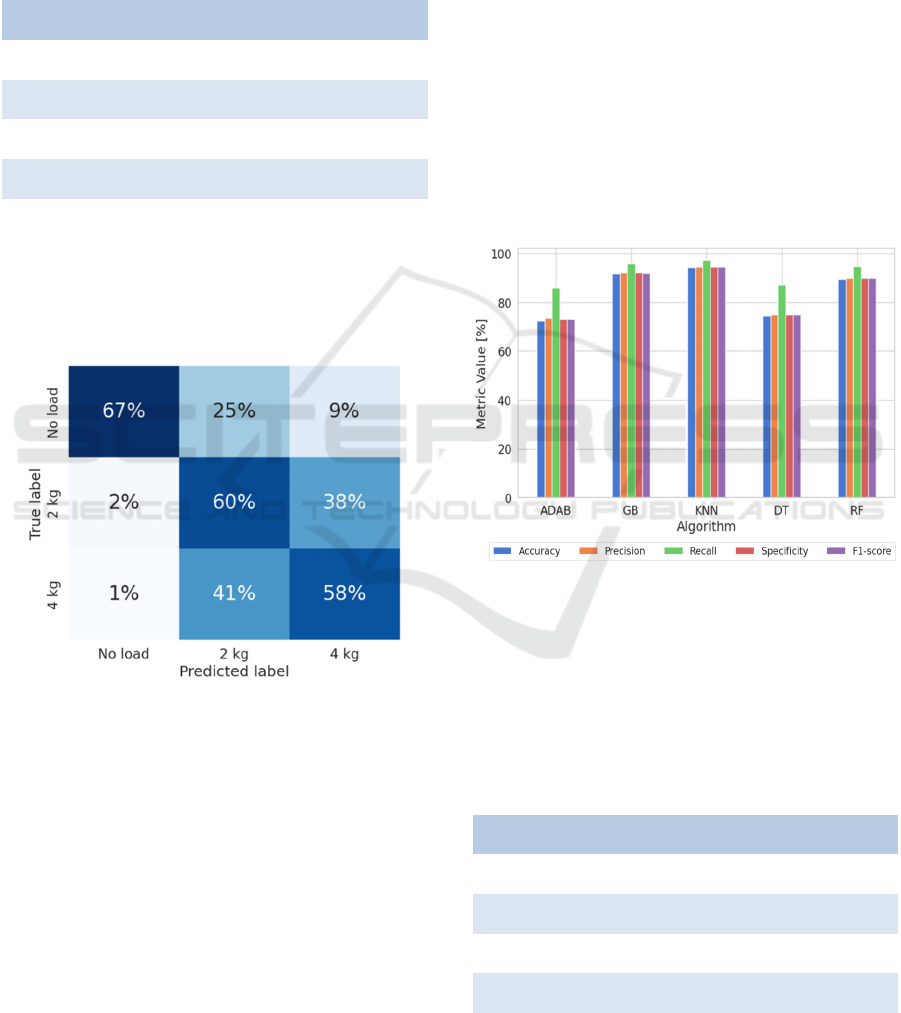
Once the best model has been determined, it will
be used for validation with the 3 randomly selected
subject data. The confusion matrix, shown in Figure
4, will be used for this purpose.
Figure 4: Normalized Confusion Matrix for the 3-axis
validation dataset.
It can be observed that the differentiation between
walking with loads and without loads can be done
relatively easily. Moreover, the algorithm is more
wrong predicting that it is loaded when it is free
(34%) than in interpreting that it is free when it is
loaded (3%). However, distinguishing between label
1 (2 kg load) and label 2 (4 kg load) is a challenging
task. The model misclassifies label 1 as 2 38% of the
windows and label 2 as 1 in 41% of cases.
4.2 Results of the Training Models
Using the Combined Signal
Database
In this section we will present the study proposed in
the previous section using a different database, the
one composed of the triaxial accelerometer and
gyroscope signals combined using the Euclidean
standard. In comparison with the previous case, it will
be moved from dealing with a signal of 6 different
channels to one with only 2.
Figure 5 shows the metrics obtained with the test
dataset associated to the trained models. It can be
noticed that the values obtained are higher than those
obtained in the previous section. While in section 4.1
the results were between 65% and 90%, those
calculated with the database of the combined signals
have obtained values between 72% and 98%.
Figure 5: Metrics comparison for the proposed algorithm
using combined accelerometer and gyroscope test data.
Again, the best performing model is the KNN
algorithm. The worst performer, meanwhile, is the
ADAB algorithm. Table 1 shows in detail the metrics
obtained for the best model with the test dataset.
Table 2: Metrics obtained for KNN algorithm for the
combined signal test dataset.
[%] No Load 2 kg 4 kg
Accuracy 94,30
Precision 99,63 91,50 92,28
Recall 99,83 95,34 96,15
Specificity 99,26 92,72 91,32
F1-score 99,44 92,11 91,79
WHC 2025 - Special Session on Wearable HealthCare
1034
The trend continues to be that label 1 is the one
with the best metrics, i.e. the one that is most
accurately identified. Accuracy, recall, specificity
and F1 score all have values around 99%. These
metrics for labels 2 and 3, corresponding to loaded
gait, are around 92%. The accuracy is around 94%,
higher than in the previous case.
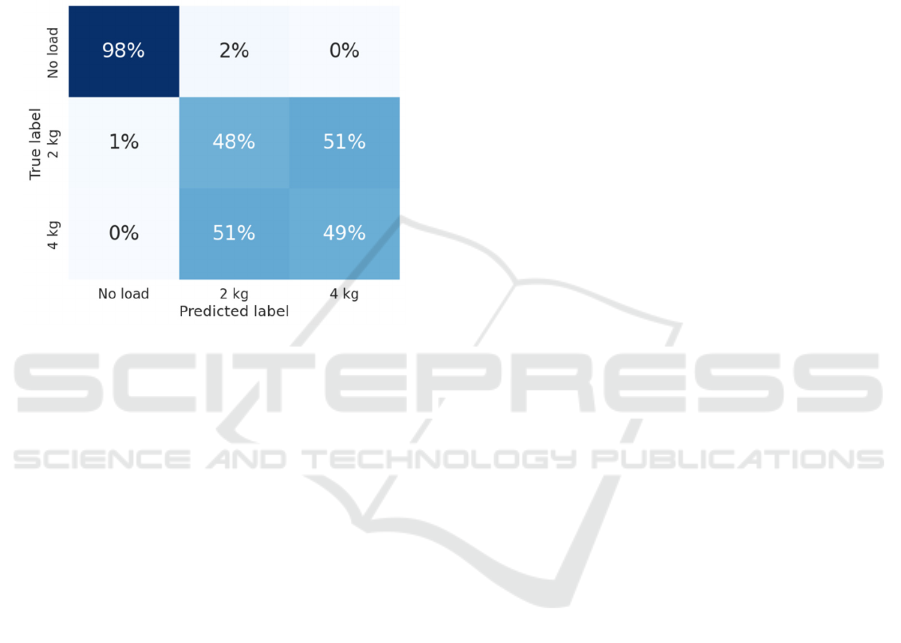
With the best model identified, it will be validated
using data from the 3 randomly selected subjects. The
confusion matrix, shown in Figure 5, will be utilized.
Figure 6: Normalized Confusion Matrix for the combined
signal validation dataset.
In this case, the trend mentioned in the previous
analysis becomes more pronounced as it is very
accurate in identifying the unloaded gait with a 98%
accuracy rate. On the other hand, when dealing with
the loaded gait data, the predictions are not at all
accurate, as it is only 50% correct to differentiate
between 2 and 4 kg. In fact, it predicts as 4 kg when
it is really 2 kg in 51% of the cases and the same
happens in the opposite case, interpreting that it is 2
kg when it is really 4 kg.
5 CONCLUSIONS
This study developed and evaluated machine learning
models for detecting arm swing constraints in
simulated gait conditions, trying to be like the gait
patterns of PD patients.
By utilizing accelerometer and gyroscope data
from smartwatches, the machine learning models
were able to classify participants walking under three
conditions: no load, 2 kg load, and 4 kg load.
KNN model demonstrated the highest accuracy in
both the 3-axis and Euclidean norm-based datasets,
proving effective in distinguishing between loaded
and unloaded gait patterns. However, while the
models performed well in detecting the presence of a
load, they encountered difficulties differentiating
between the 2 kg and 4 kg weights, indicating that
further refinement is needed for more nuanced
classification.
One possible explanation is that
walking without a load, as opposed to carrying any
load, induces significant changes in body posture,
stride, and movement dynamics that can be
effectively captured by the signals employed.
However, when differentiating between loads, these
differences may not be as pronounced.
Using the 3-axis dataset with the validation data
set, it manages to differentiate the no load cases 67%
of the time, the 2kg load cases 60% of the time and
the 4kg load cases 58% of the time. For the combined
signal dataset, on the other hand, this distribution
changes, as the no load cases are matched 98% of the
time while the 2 and 4 kg load cases are matched
around 50% of the time.
This evaluation highlights the potential utility of
each dataset employed in the analysis. The combined
signal could be used to distinguish load and no-load
cases while the 3-axial signal could be used to
distinguish between different load situations.
It is important to acknowledge that this study has
certain limitations that should be addressed in future
research studies. The database consists of
measurements from 24 healthy patients with no
known gait pathology. In addition, no real PD patients
have been involved, which would be interesting
especially for the validation of the models.
Future work should focus on exploring the
applicability of this type of test in PD patients to
evaluate its practical utility, expanding the database
by increasing the number of participants and
incorporating diverse settings, such as varying
loading conditions or extended durations, to study
variability. Furthermore, it would be valuable to
investigate additional machine learning algorithms,
including traditional and recent advancements, such
as deep learning, to enhance performance.
In practical implementation, several
considerations must be addressed to transition this
approach to real-world applications effectively.
Smartwatches offer a non-intrusive platform for long-
term monitoring; however, ensuring usability and
fostering patient compliance remain crucial
challenges. Validation of the system with PD patients
across diverse daily living scenarios is necessary to
establish model robustness and reliability under real-
world conditions. Additionally, implementing secure
and efficient data transmission mechanisms is
essential to safeguard patient privacy and ensure
reliability in remote monitoring applications.
Detection of Arm Swing Limitations in Simulated Parkinson’s Disease Gait Conditions: A Pilot Study
1035

Addressing these factors will significantly enhance
the practical utility and scalability of this approach.
The findings of this study suggest that wearable
sensor data combined with machine learning
techniques offer valuable potential for gait analysis,
with applications in the early diagnosis and
monitoring of movement disorders such as PD.
ACKNOWLEDGEMENTS
This research has been possible thanks to the
financing of the project BIOCLITE: PID2021-
123708OB-I00, funded by MCIN/AEI/10.13039/
501100011033/ FEDER, EU.
REFERENCES
Braune, W., & Fischer, O. (1987). The Human Gait.
Springer. https://doi.org/10.1007/978-3-642-70326-3
Cicirelli, G., Impedovo, D., Dentamaro, V., Marani, R.,
Pirlo, G., & D’Orazio, T. R. (2022). Human Gait
Analysis in Neurodegenerative Diseases: A Review.
IEEE Journal of Biomedical and Health Informatics,
26(1), 229–242. IEEE Journal of Biomedical and
Health Informatics.
https://doi.org/10.1109/JBHI.2021.3092875
Djaldetti, R., Ziv, I., & Melamed, E. (2006). The mystery
of motor asymmetry in Parkinson’s disease. The Lancet
Neurology, 5(9), 796–802.
https://doi.org/10.1016/S1474-4422(06)70549-X
Lewek, M. D., Poole, R., Johnson, J., Halawa, O., & Huang,
X. (2010). Arm swing magnitude and asymmetry
during gait in the early stages of Parkinson’s disease.
Gait & Posture, 31(2), 256–260.
https://doi.org/10.1016/j.gaitpost.2009.10.013
Meyns, P., Bruijn, S. M., & Duysens, J. (2013). The how
and why of arm swing during human walking. Gait &
Posture, 38(4), 555–562.
https://doi.org/10.1016/j.gaitpost.2013.02.006
Morris, M. E., Huxham, F., McGinley, J., Dodd, K., &
Iansek, R. (2001). The biomechanics and motor control
of gait in Parkinson disease. Clinical Biomechanics,
16(6), 459–470. https://doi.org/10.1016/S0268-
0033(01)00035-3
Patel, S., Lorincz, K., Hughes, R., Huggins, N., Growdon,
J., Standaert, D., Akay, M., Dy, J., Welsh, M., &
Bonato, P. (2009). Monitoring motor fluctuations in
patients with Parkinson’s disease using wearable
sensors. IEEE Transactions on Information Technology
in Biomedicine: A Publication of the IEEE Engineering
in Medicine and Biology Society, 13(6), 864–873.
https://doi.org/10.1109/TITB.2009.2033471
Polvorinos-Fernández, C., Pavón, I., & Sigcha, L. (2024).
Smartwatch gait dataset in simulated Parkinson’s
disease restricted arm swing conditions (Version V1.0)
[Dataset]. Zenodo.
https://doi.org/10.5281/zenodo.13884808
Polvorinos-Fernández, C., Sigcha, L., Borzì, L., Olmo, G.,
Asensio, C., López, J. M., de Arcas, G., & Pavón, .
(2024). Evaluating Motor Symptoms in Parkinson’s
Disease Through Wearable Sensors: A Systematic
Review of Digital Biomarkers. Applied Sciences,
14(22), Article 22.
https://doi.org/10.3390/app142210189
Polvorinos-Fernández, C., Sigcha, L., Pablo, L. P. de,
Borzí, L., Cardoso, P., Costa, N., Costa, S., López, J.
M., Arcas, G. de, & Pavón, I. (2024). Evaluation of the
Performance of Wearables’ Inertial Sensors for the
Diagnosis of Resting Tremor in Parkinson’s Disease. 2,
820–827. https://doi.org/10.5220/0012571600003657
Rodríguez-Martín, D., Pérez, C., Samà Monsonís, A.,
Català, A., Cabestany, J., & Rodríguez-Molinero, A.
(2019). STAT-ON: A Wearable Inertial System to
Objectively Evaluate Motor Symptoms in Parkinson’s
Disease.
Sigcha, L., Pavón, I., Costa, N., Costa, S., Gago, M.,
Arezes, P., López, J. M., & Arcas, G. D. (2021).
Automatic Resting Tremor Assessment in Parkinson’s
Disease Using Smartwatches and Multitask
Convolutional Neural Networks. Sensors (Basel,
Switzerland), 21(1), 291.
https://doi.org/10.3390/s21010291
Sigcha, L., Polvorinos-Fernández, C., Costa, N., Costa, S.,
Arezes, P., Gago, M., Lee, C., López, J. M., de Arcas,
G., & Pavón, I. (2023). Monipar: Movement data
collection tool to monitor motor symptoms in
Parkinson’s disease using smartwatches and
smartphones. Frontiers in Neurology, 14.
https://doi.org/10.3389/fneur.2023.1326640
Siragy, T., MacDonald, M.-E., & Nantel, J. (2020).
Restricted Arm Swing in People With Parkinson’s
Disease Decreases Step Length and Time on
Destabilizing Surfaces. Frontiers in Neurology, 11,
873. https://doi.org/10.3389/fneur.2020.00873
Takami, A., Cavan, S., & Makino, M. (2020). Effects of
arm swing on walking abilities in healthy adults
restricted in the Wernicke-Mann’s limb position.
Journal of Physical Therapy Science, 32(8), 502–505.
https://doi.org/10.1589/jpts.32.502
Warmerdam, E., Romijnders, R., Welzel, J., Hansen, C.,
Schmidt, G., & Maetzler, W. (2020). Quantification of
Arm Swing during Walking in Healthy Adults and
Parkinson’s Disease Patients: Wearable Sensor-Based
Algorithm Development and Validation. Sensors
(Basel, Switzerland), 20(20), 5963.
https://doi.org/10.3390/s20205963
Winter, D. A. (2009). Biomechanics and Motor Control of
Human Movement. Wiley. 10.1002/9780470549148
Wirdefeldt, K., Adami, H.-O., Cole, P., Trichopoulos, D.,
& Mandel, J. (2011). Epidemiology and etiology of
Parkinson’s disease: A review of the evidence.
European Journal of Epidemiology, 26 Suppl 1, S1-58.
https://doi.org/10.1007/s10654-011-9581-6
WHC 2025 - Special Session on Wearable HealthCare
1036
