
SBC-UNet3+: Classification of Nuclei in Histology Imaging Based on
Multi Branch UNET3+ Segmentation Model
Roua Jaafar
1,2,3 a
, Hedi Yazid
3 b
, Wissem Farhat
1
and Najoua Essoukri Ben Amara
1 c
1
Universit
´
e de Sousse, Ecole Nationale d’Ing
´
enieurs de Sousse, LATIS - Laboratory of Advanced Technology and
Intelligent Systems, 4023, Sousse, Tunisia
2
Universit
´
e de Sousse, Institut Sup
´
erieur d’Informatique et des Technologies de Communication de Sousse,
4011, Sousse, Tunisia
3
Institut Sup
´
erieur d’Electronique de Paris (ISEP), 10 rue de Vanves, Issy-les-Moulineaux, 92130, France
{jaafar.roua, wissemfarhat07}@gmail.com, hedi.yazid@isep.fr, najoua.benamara@eniso.rnu.tn
Keywords:
Histology, Multi-Class Segmentation, Boundary Detection, Classification, UNET3+, Multi-Branch.
Abstract:
Histological images are crucial for cancer diagnosis and treatment, providing valuable information about cel-
lular structures and abnormalities. Deep learning has emerged as a promising tool to automate the analysis of
histological images, especially for tasks like cell segmentation and classification, which aim to improve cancer
detection efficiency and accuracy. Existing methods, show promising results in segmentation and classifica-
tion but are limited in handling overlapping nuclei and boundary delineation. We propose a cell segmentation
and classification approach applied to histological images, part of a Content-Based Histopathological Im-
age Retrieval (CBHIR) project. By integrating boundary detection and classification-guided modules, our
approach overcomes the limitations of existing methods, enhancing segmentation precision and robustness.
Our approach leverages deep learning models and the UNET3+ architecture, comparing its performance with
state-of-the-art methods on the PanNuke Dataset (Gamper et al., 2020)
∗
. Our multitask approach outperforms
current models in F1-score and recall, demonstrating its potential for accurate and efficient cancer diagnosis.
1 INTRODUCTION
Whole-slide imaging (WSI) Segmentation of key
components of whole-slide images is essential for
cancer diagnosis and other pathology-related analy-
ses. It involves identifying and isolating structures
like nuclei or cells, essential for accurate diagnos-
tics. Accurate segmentation significantly affects the
diagnostic process, as it allows differentiating be-
tween different tissue and nucleus types, which is
essential for patient assessment (Chen et al., 2019).
Challenges in WSI segmentation include variability
in nuclei sizes, shapes, clustering, and overlapping,
contributing to under-segmentation. In addition, the
structure of tissues, such as glands, can be highly de-
generate, making discrimination difficult. Traditional
methods like morphological processing and cluster-
ing struggle with complex variations. Deep learning
algorithms, such as U-NET, DeepLabV3, and GANs,
a
https://orcid.org/0000-0003-4210-2665
b
https://orcid.org/0000-0001-8188-3797
c
https://orcid.org/0000-0001-7914-0644
∗
https://warwick.ac.uk/fac/cross fac/tia/data/pannuke
address these challenges by learning complex pat-
terns and structures. State-of-the-art models, such as
Cellpose and OmniPose, improve generalization but
struggle with boundary detection and overlapping nu-
clei in dense images.
Histological segmentation enables applications
like tissue and cell analysis. Our proposed SBC-
UNet3+ integrates segmentation, boundary detection,
and classification-guided modules, enhancing seg-
mentation precision for overlapping and irregular nu-
clei.
To summarize, histological image segmentation
uses traditional and deep learning methods to address
challenges in WSI. Our proposed multi-branch SBC-
UNet3+ improves cell segmentation, boundary de-
tection, and classification accuracy, facilitating better
cancer diagnosis and research. The remaining of the
paper is organized as follows. Section 2 briefly intro-
duces previous approaches related to cell segmenta-
tion and classification for histological images. The
proposed approach for segmentation and classifica-
tion of Nuclei in Histology Imaging based on Multi-
Branch UNET3+ is presented in Section 3. In Section
Jaafar, R., Yazid, H., Farhat, W. and Ben Amara, N. E.
SBC-UNet3+: Classification of Nuclei in Histology Imaging Based on Multi Branch UNET3+ Segmentation Model.
DOI: 10.5220/0013232900003912
Paper published under CC license (CC BY-NC-ND 4.0)
In Proceedings of the 20th International Joint Conference on Computer Vision, Imaging and Computer Graphics Theory and Applications (VISIGRAPP 2025) - Volume 3: VISAPP, pages
601-609
ISBN: 978-989-758-728-3; ISSN: 2184-4321
Proceedings Copyright © 2025 by SCITEPRESS – Science and Technology Publications, Lda.
601

4, experiments are carried out, and obtained results on
the PanNuke Dataset are illustrated. Conclusion and
future work are drawn in Section 5.
2 RELATED WORKS
Several studies have investigated deep learning-based
approaches for cell segmentation in histological im-
ages (Feng et al., 2021), (Khuriwal and Mishra,
2018), (Zhao et al., 2020). Traditional convolu-
tional neural networks (CNNs), such as U-Net (Ron-
neberger et al., 2015), have been widely used for this
task, demonstrating promising results in various ap-
plications (Ibtehaz and Rahman, 2020). However,
to improve segmentation accuracy, especially for
complex cellular structures, integrating self-attention
mechanisms can be beneficial for capturing long-
range dependencies in images.
Despite the success of these methods, prominent
models like Cellpose (Stringer et al., 2020) and Om-
niPose (Cutler et al., 2022) have introduced advanced
architectures specifically designed for cell segmenta-
tion. Cellpose emphasizes generalizability through
pre-trained models and dynamic scale adaptation but
lacks explicit mechanisms for handling overlapping
nuclei. OmniPose extends Cellpose by incorporating
scale-invariant features and improving instance seg-
mentation; however, both models face challenges in
precise boundary delineation and struggle with dense
histological data. These limitations underscore the
need for a multi-branch approach that integrates seg-
mentation and boundary detection.
In the following, we will focus on the state-of-
the-art of multi-branch approaches for histological
image segmentation and classification. These tech-
niques involve combining multiple branches or path-
ways within the neural network architecture to exploit
different types of information, such as cell segmenta-
tion and boundary detection. In doing so, we aim to
improve the accuracy and robustness of our model in
cell segmentation and classification from histopatho-
logical images.
Many techniques using a multi-branch decoder
strategy have evolved, such as HoVer-Net (Graham
et al., 2019), which classifies nuclei types in differ-
ent organs and overcomes class imbalance through
a ResNet50 encoder and three independent decoders
based on densely connected networks (nuclear pixel,
horizontal-vertical maps (HoVer), and nuclear classi-
fication (i.e., instance segmentation). Also, authors
in HookNet (van Rijthoven et al., 2020) have pro-
posed a model for multi-class tissue segmentation for
breast cancer, using context and target branches to im-
prove detail extraction using a U-Net backbone and a
decoder involving 2x2 nearest neighbor scaling fol-
lowed by convolutional layers. This architecture al-
lows the integration of context branch information
into the target branch, facilitating multi-resolution
representations at different depths, achieved by con-
catenating relevant features between branches in the
decoder sections through a hooking mechanism. A
single encoder and three parallel decoders for mask
predictions, contour prediction, and distance map
estimation, refining mask boundaries, have been
proposed. While an approach that applies multi-
resolution deconvolution filters and segments various
object types (nuclei, cells, glands) was detailed in
(Raza et al., 2019). This approach was applied with
different image staining modalities: fluorescence and
also Hematoxylin and Eosin (H&E) while adjusting
the input parameters to create a unified framework for
segmentation of various object types. PointNu-Net
(Yao et al., 2024) is a multi-branch model that detects,
segments, and classifies nuclei from histopathology
data by predicting keypoints at the center of each nu-
cleus. It utilizes dynamic convolution for instance
segmentation, combining outputs from feature and
kernel branches. The Joint Pyramid Fusion Mod-
ule improves feature aggregation for multi-scale data,
eliminating the need for post-processing and non-
maximum suppression (NMS). Although these meth-
ods demonstrate substantial advancements, they of-
ten lack a unified approach to simultaneously ad-
dress segmentation, boundary detection, and classi-
fication. By comparing our proposed SBC-UNet3+
with these models, we aim to showcase how integrat-
ing boundary-sensitive features enhances segmenta-
tion robustness, particularly in dense histological im-
ages. In the following table 1, we propose a compara-
tive study between the different works in the literature
that have proposed a deep multi-branch architecture
for the segmentation and classification of histological
images. By carrying out a comprehensive evaluation
of their performance, we aim to identify the most suit-
able model for accurate and efficient cancer detection.
3 PROPOSED APPROACH
Our proposed approach is part of a larger project
aimed at advancing automated cancer detection
through segmentation of cell instances in histological
images. The main objective is to identify the most ef-
fective deep learning model for accurate cell segmen-
tation and classification, thereby enhancing the accu-
racy and efficiency of cancer diagnosis. Our approach
involves training and evaluating the UNET3+ deep
VISAPP 2025 - 20th International Conference on Computer Vision Theory and Applications
602

Table 1: Summary of Nucleus Segmentation and Classification Related Works and Their Performance.
Ref. Description Databases Performance
CPP-Net (Chen
et al., 2023)
Nucleus segmentation using multi-point sampling to enhance con-
textual information and predictions incorporating a Confidence-Based
Weighting Module to fuse predictions and introducing a novel Shape-
Aware Perceptual loss.
DSB2018;
BBBC06; Pan-
Nuke dataset
mPQ: 0.48
bPQ: 0.68
HDA-Net (Im
et al., 2024)
Dual-encoder architecture, incorporating H&E and residual (HER), and
RGB streams to extract and combine color-invariant and discrimina-
tive features using a Hierarchical Dual Attention (HDA) module and a
Single-Source Attention Module (SAM) to enhance feature representa-
tion.
CoNSeP
PanNuke Dataset
Kumar
AJI: 69.60
Dice: 82.03
Recall: 82.84
Precision: 81.31
CellViT (H
¨
orst
et al., 2024)
Cell segmentation using a U-Net-like architecture with a Vision Trans-
former (ViT) backbone and multi-branch decoder. The forward method
performs the predictions for tissue types, binary cell segmentation, hori-
zontal and vertical distance maps, and nuclei type predictions for nuclei
classification.
PanNuke
dataset
mPQ: 0.51
F1- score: 0.83
TSFD-Net
(Ilyas et al.,
2022)
Utilizes Tissue-Specific Feature Distillation (TSFD) to optimize nuclei
features, with multiple decoders enabling context-aware predictions.
PanNuke
dataset
mPQ: 0.504
bPQ: 0.6377
HoverNet
(Graham et al.,
2019)
U-Net-like architecture with ResNet50 backbone and 3 independent de-
coders based densely connected networks
Kumar; Con-
SeP; CPM-15;
CPM-17;
TNBC datasets
mPQ: 0.4629
bPQ: 0.6596
MicroNet
(Raza et al.,
2019)
Encoder with 4 branches of convolution, max-pooling, resizing, and
concatenation layers. The network consists of five groups and thirteen
branches, processing input from membrane and nuclear marker images.
Multiplexed
Fluorescence
Imaging Data ;
CPM Data
Dice: 82.43%
F1-Score: 71.79%
OD: 74.12%
Acc: 83.53%
OH: 27.53
HookNet (van
Rijthoven et al.,
2020)
Uses a U-Net backbone encoder and a modified decoder to extract con-
textual features (context branch) and fine details (target branch) from
input patches, aligning feature maps via concatenation, with a hooking
mechanism integrating context into the target branch for enhanced seg-
mentation.
TCGA
—-
PointNu-Net
(Yao et al.,
2024)
Dynamic convolution for instance segmentation while feature and ker-
nel branches collaboratively generate instance segmentation,enhanced
by a Joint Pyramid Fusion.
PanNuke
dataset
mPQ: 0.4957
bPQ: 0.6808
Aggregated Jaccard Index (AJI); Multi-class Panoptic Quality (mPQ); Binary Panoptic Quality (bPQ); Dice coefficient (Dice);
Intersection over Union (IoU) ; Object Dice (OD), Pixel Accuracy (Acc) ; Object Hausdorff(OH).
learning architecture on the PanNuke dataset, known
for its diversity and size in nucleus segmentation and
classification. In order to prepare the dataset, we
implement preprocessing techniques to improve im-
age quality and ensure compatibility with model input
requirements, including checking neighboring pixels
and creating binary boundary images to extract rele-
vant features for segmentation and classification. The
model is trained using a supervised learning frame-
work, optimized for accurate cell segmentation and
classification. We also integrate boundary detection
and classification branches to enhance the visual dis-
tinction and accuracy of segmented cells. By lever-
aging the capabilities of the large-scale connected
UNET (UNET3+), which incorporates full-scale skip
connections, we aim to efficiently capture fine details
and coarse-grained semantics, addressing issues such
as over segmentation and false positives (Kumar et al.,
2020) (Rizzo et al., 2022) (Feng et al., 2021). A block
diagram (Figure 1) summarizing the different stages
includes data preprocessing, model training, segmen-
tation and classification, visualization and analysis.
By integrating advanced preprocessing and bound-
ary detection techniques, our approach aims to sig-
nificantly contribute to the advancement of automated
cancer detection, thereby improving patient outcomes
and healthcare delivery.
3.1 The Main Contributions
Our methodology represents a multi-task learning ap-
proach for cell segmentation, boundary detection, and
classification using a deep learning architecture. The
pipeline starts with an input histological image, pre-
processed by applying hand crafted techniques to ex-
tract low-level features to prepare our dataset that
will be processed through an encoder-decoder-like
network. The encoder extracts features at multi-
ple scales, followed by full-scale skip connections to
transfer information across the network. Two par-
allel decoders, one for boundary detection and one
for segmentation, generate respective outputs. Both
branches feed into a classification-guided module
SBC-UNet3+: Classification of Nuclei in Histology Imaging Based on Multi Branch UNET3+ Segmentation Model
603

(CGM) that improves the final cell classification out-
put. We can summarize our contribution as follows:
3.1.1 Histological Images Preprocessing
Histological images contain various features that need
extraction for analysis. Our approach applies prepro-
cessing to focus on cell regions of interest, avoiding
the time-consuming task of processing the entire im-
age. A preprocessing algorithm generates binary cell
contours from a multi-channel mask by identifying
boundary pixels. It checks neighboring pixels for dif-
ferent labels to detect boundaries, labeling the corre-
sponding pixel in the binary output. This highlights
cell boundaries, aiding the detection and analysis of
cell shapes in subsequent steps.
3.1.2 Segmentation Branches
The segmentation part of our approach aims to use
the pre-processed boundaries and ground truth gener-
ated from the PanNuke Dataset to extract high-level
features and facilitate feature extraction and cancer
cell detection. For this, our segmentation model has
a multi-branch structure for multi-class segmentation
and boundary detection as detailed below:
- Multi-Class Cells Segmentation Branch. This
branch aims to predict if the pixel belongs to a cell
or to background. We need to define if the pixel be-
longs to a cell or rather to the background. This is a
fundamental process for the classification task of the
next step.
- Binary Boundaries Detection Branch. The
boundary detection module is responsible for iden-
tifying edges or boundaries in cell image masks. It
identifies edges in multichannel masks by compar-
ing each pixel to its neighboring pixels. This process
creates a binary boundary image that highlights the
edges, allowing for further cell boundaries analysis
and visualization. The key technique used is neigh-
bor comparison, which ensures that boundaries are
accurately detected based on differences in pixel la-
bels. A post-processing step is applied on the bound-
ary detection branch by integrating Gaussian smooth-
ing techniques to refine boundary predictions. This
architecture integrates the Convolutional Block At-
tention Module (CBAM) into the decoders of a our
model to improve feature representation. CBAM uses
both channel-wise and spatial attention mechanisms:
channel-wise attention recalibrates feature maps by
emphasizing important channels, while spatial atten-
tion focuses on relevant spatial regions. By incorpo-
rating CBAM, decoders can more effectively high-
light important features and suppress less important
ones, which improves performance in segmentation
tasks. This adaptive attention mechanism helps the
model capture intricate details and improves over-
all accuracy. For the evaluation of our multi-branch
model, a custom loss function has been implemented.
The proposed network design includes two distinct
sets of weights: λ
seg
for segmentation loss and λ
bound
for boundary loss, which refer, successively, to the
weights of the segmentation branch decoder and the
boundary detection branch decoder. These weight
sets are jointly optimized using the loss L defined as:
L
total
= λ
seg
L
seg
+ λ
bound
L
bound
where:
• L
seg
is the loss for the segmentation branch,
• L
bound
is the loss for the boundary detection
branch,
• λ
seg
and λ
bound
are the weighting factors for each
branch.
We have chosen to use two different loss func-
tions at the output of each branch for superior over-
all performance. We applied some custom parameters
on this loss function. Specifically, we set the bound-
ary coefficient detection loss λ
bound
to 2 and the other
scalar λ
seg
of the segmentation branch to 0.7 based
on empirical selection, as presented in the algorithm
below (Algorithm 1). It performs a grid search to se-
lect the best weights for the segmentation and bound-
ary detection branches of a multi-branch cell segmen-
tation model using full-scale UNET3+. The process
begins by defining a grid of possible weights for the
segmentation loss (λ
seg
) and boundary loss (λ
bound
).
These weights are combined to form a parameter grid
P, which includes all possible pairs of these weights.
For each pair of weights in the grid, the algorithm
calculates the total validation loss by first comput-
ing the individual segmentation and boundary losses
in the validation dataset. The total validation loss
is then computed as a weighted sum of these two
losses, using the current weights pair. The algorithm
tracks the smallest total validation loss encountered
during the grid search. If a new weight combina-
tion results in a lower total validation loss than pre-
viously encountered, the new value is stored as the
best weight pair. To compute the final loss, we adopt
a weighted sum method which combine the individ-
ual losses from each branch; multiclass segmentation
(Cross-Entropy) and binary boundary detection (Bi-
nary Cross- Entropy). The choice of weighted sum
allows us to manually control the relative contribu-
tion of each task to the overall model optimization,
ensuring a balanced learning process. This flexibility
is crucial for multitask learning, where tasks such as
segmentation and boundary detection have different
VISAPP 2025 - 20th International Conference on Computer Vision Theory and Applications
604

Data: P: Grid of parameters for segmentation (λ
seg
) and
boundary (λ
bound
) loss weights.
S: Predicted segmentation outputs.
F: Predicted boundary outputs.
M: Ground truth segmentation masks.
B: Ground truth boundaries.
Result: λ
best
= (λ
seg best
, λ
bound best
): Best weights for
segmentation and boundary losses.
Initialization:;
λ
best
← None; L
best
← ∞.;
Define weight grid P as follows:;
λ
seg values
= [0.3, 0.5, 0.7, 1.0, 1.5, 2.0].;
λ
bound values
= [0.3, 0.5, 0.7, 1.0, 1.5, 2.0].;
Construct P by combining all pairs (λ
seg
, λ
bound
) from
λ
seg values
and λ
bound values
.;
Begin Algorithm:;
for each p in P do
λ
seg
← p[’weight segmentation loss’].;
λ
bound
← p[’weight boundary loss’].;
Calculate segmentation loss across all samples
L
seg
←
1
len(S)
∑
len(S)
i=1
L
seg
(S[i], M[i]).;
Calculate boundary loss across all samples
L
bound
←
1
len(F)
∑
len(F)
i=1
L
bound
(F[i], B[i]).;
Calculate the total weighted loss
L
total
← λ
seg
× L
seg
+ λ
bound
× L
bound
.;
if L
total
< L
best
then
L
best
← L
total
.;
λ
best
← (λ
seg
, λ
bound
).;
end
end
return λ
best
.;
End Algorithm
Algorithm 1: Weight Selection using Grid Search.
scales and difficulty levels. By adjusting the weights,
we can prioritize one task over another, aligning the
training process with the specific needs of our prob-
lem. Other alternatives to the weighted sum approach
include using dynamic weighting strategies, such as
uncertainty weighting or loss normalization, where
the weights evolve during training based on the un-
certainty of the task or the magnitude of the loss.
While these methods can be effective in automatically
balancing tasks, they introduce additional complex-
ity to the model and may be less interpretable, which
can complicate tuning and analysis. Additionally, dy-
namic weighting does not always guarantee the de-
sired balance between tasks, which can lead to sub-
optimal performance in one or more branches if task-
specific losses are highly imbalanced. We opt for
a manually controlled weighted sum for its simplic-
ity, interpretability, and the direct control it provides
over the training dynamics. This personalized loss is
well suited to our application, where both tasks are
of equal importance and require fine-tuned inputs to
ensure optimal overall performance.
3.1.3 Cells-Classification Branch
The segmentation and boundary detection maps are
used as input features for the classification branch as
they provide detailed spatial information about differ-
ent regions of the image. The Classification Guided
Module (CGM) takes the segmentation maps and pro-
cesses them to create a fused feature representation.
This module can include operations such as convolu-
tion, attention mechanisms, and concatenation to effi-
ciently combine the segmentation features and bound-
ary detection features as presented in Figure 1.
The classification branch of the model is designed
to exploit the rich spatial information provided by the
segmentation and boundary detection results from the
previous segmentation step. Thus, the input features
provide detailed spatial information about different
regions of the image, which is essential for accurate
classification.
The CGM takes these segmentation maps and pro-
cesses them to create a fused feature representation.
Indeed, this module uses several operations: Convolu-
tional Layers (Conv2d), Batch Normalization (Batch-
Norm2d), ReLU Activation and Concatenationlayers
where the CGM combines the features from the seg-
mentation and boundary detection maps, creating a
rich and informative feature set for the final classifi-
cation task. Finally, and once the fusion function has
been processed, the features are passed to additional
layers that further refine the features. The result is
then used to classify the cells into different categories,
thus providing the final classification result.
In summary, the proposed architecture is defined
as a multi-task learning model for cell segmentation
and boundary detection using the UNET3+ backbone
and a classification-guided module (CGM) using a
CNN architecture. The complete architecture is pre-
sented in the diagram below (Figure 1).
4 DATA AND EXPERIMENTAL
RESULTS
In this section, we investigate the evaluation of perfor-
mance of our proposed approach applied on the Pan-
Nuke dataset.
Models were implemented using PyTorch 1.8.1
and trained on an NVIDIA TITAN XP GPU. The loss
functions used were Cross Entropy (CE) for the seg-
mentation branch and Binary Cross Entropy (BCE)
for the boundary detection branch. Training was per-
formed with a batch size of 32 over 150 epochs, us-
ing the Adam optimizer with a learning rate of 0.001.
The models were designed to handle 6 classes for seg-
mentation and 1 class for boundary detection, with
input images resized to 256x256 pixels. Large-scale
images used in advanced analysis can present unique
challenges due to their complex structure and large
SBC-UNet3+: Classification of Nuclei in Histology Imaging Based on Multi Branch UNET3+ Segmentation Model
605
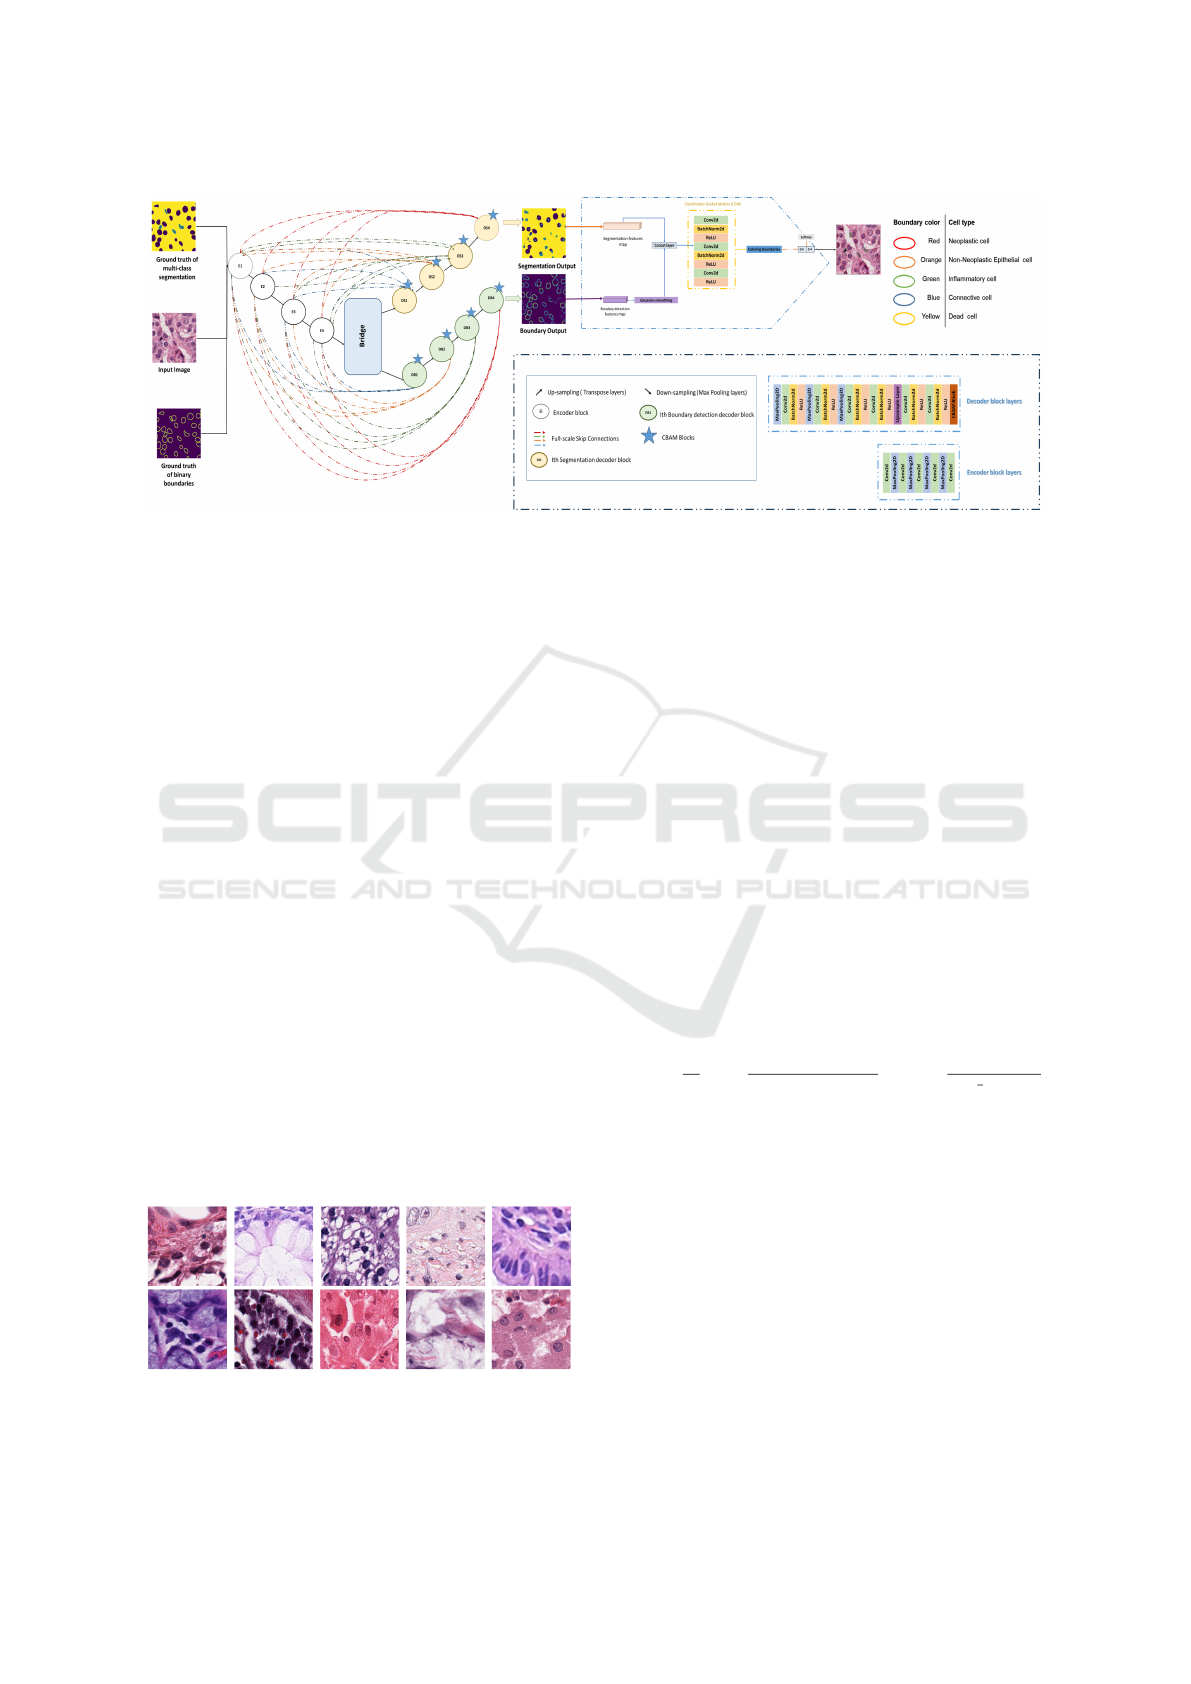
Figure 1: Representation of the multi-task architecture for multi-class segmentation, boundary detection, and classification of
cells in histological images.
data volume. The composition of these images of-
ten spans across six distinct dimensions, incorporat-
ing layers that contain complex information. In some
cases, these large images contain multi-scene data,
where each scene comprises a series of images repre-
senting different time points. This multidimensional-
ity increases the computational load, leading to longer
training times and slower model inference. To effi-
ciently process such complex images, deep learning
models must be carefully designed and optimized to
handle the large data requirements and complexities
inherent in compositing images in six dimensions.
4.1 The Used Database
To effectively evaluate and compare our model, we
used the PanNuke Dataset, a semi-automatically cu-
rated dataset specifically designed for nucleus in-
stance segmentation and classification. This dataset
offers comprehensive nuclei annotations across 19 tis-
sue types, including adrenal gland, bile-duct, bladder,
breast, cervix, colon, esophagus, headneck, kidney,
liver, lung, ovarian, pancreatic, prostate, skin, stom-
ach, testis, thyroid, and uterus. By leveraging this
dataset, we can ensure that our models are exposed to
a wide variety of tissue types and nuclei appearances,
enabling robust training and validation.
Figure 2: Illustration of various histological images from
PanNuke dataset (256x256 shaped samples).
4.2 Quantitative Evaluation
During evaluation, we assess the model’s perfor-
mance using metrics like pixel accuracy, IoU, mPQ,
and bPQ to evaluate its effectiveness in cell segmen-
tation. Segmentation results are visualized for quali-
tative analysis to identify potential issues. The choice
of metrics depends on the task’s requirements and
dataset characteristics.
Metrics should handle multiple classes and pro-
vide insights both individually and collectively. mPQ
evaluates multi-class segmentation performance by
averaging individual class bPQ values, while bPQ is
used for binary segmentation tasks (e.g., object vs.
background).
While mPQ and bPQ are useful for instance seg-
mentation, metrics like IoU, Dice coefficient, preci-
sion, recall, and mIoU can be adapted for multi-class
semantic segmentation. IoU measures model accu-
racy by calculating the ratio of intersection and union
of the predicted and ground truth masks.
mPQ =
1
|C|
∑
c∈C
TP
c
TP
c
+0.5×(FP
c
+FN
c
)
;bPQ =
TP
TP+
1
2
(FP+FN)
Table 2 presents our model’s performance on 19
tissue types for cell segmentation and boundary de-
tection. It achieved a high mean accuracy of 89.61%
and F1-Score of 89.19%. Pancreatic tissue showed
the highest accuracy (95.18%), while Prostate tissue
had the lowest (80.31%). The mean IoU (83.16%)
and Recall (85.94%) demonstrate the model’s effec-
tiveness in segmenting nuclei. With a low average
segmentation loss (0.29) and an mPQ score of 42.62,
the method performs well across various tissue types.
The classification branch (Table 2) shows robust
performance with an average accuracy of 85.86%.
The highest accuracy is in pancreatic tissue (95.06%),
while Cervix tissue has the lowest (73.51%), suggest-
ing challenges in handling its specific features.
VISAPP 2025 - 20th International Conference on Computer Vision Theory and Applications
606
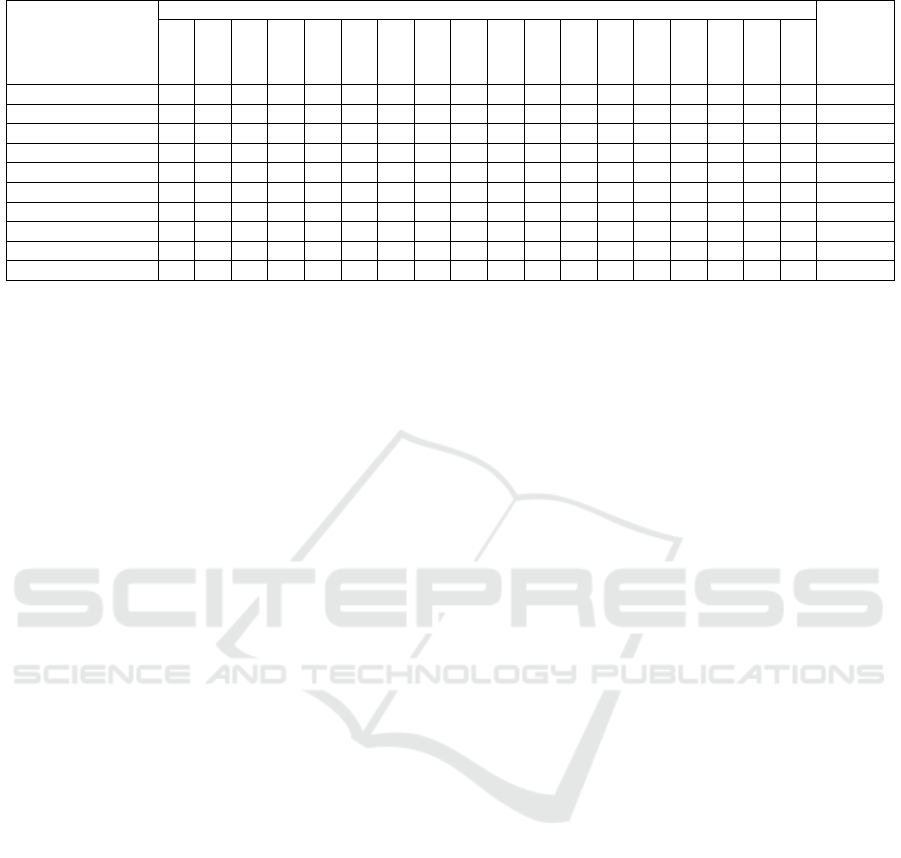
Table 2: Cells Segmentation, Boundary detection and classification results.
Cell types
Mean values
Adrenal-gland
Bile-duct
Bladder
Breast
Cervix
Colon
Esophagus
HeadNeck
Kidney
Liver
Lung
Ovarian
Pancreatic
Prostate
Skin
Stomach
Testis
Thyroid
Multi-branch Accuracy 94.25 93.20 85.08 90.87 88.63 83.04 92.21 87.76 92.10 92.88 89.00 88.97 95.18 80.31 90.79 91.30 93.19 88.78 89.61
Multi-branch Loss 0.16 0.21 0.67 0.22 0.35 0.40 0.23 0.38 0.23 0.22 0.29 0.29 0.14 0.27 0.50 0.25 0.24 0.20 0.29
Mean IoU 90.40 88.19 74.65 84.91 80.83 73.49 85.56 80.97 86.25 87.89 81.16 80.84 91.91 84.67 68.65 84.82 85.77 88.04 83.16
F1-Score 93.99 92.18 82.94 90.12 86.71 83.40 92.21 86.54 91.24 92.56 88.26 88.59 95.18 91.08 78.57 90.77 92.55 87.25 89.29
Recall 94.25 93.20 85.08 90.87 88.63 83.04 92.21 87.76 92.10 92.88 88.99 88.98 95.18 91.01 80.31 90.79 91.30 93.19 89.99
mPQ 44.7 42.49 32.74 48.78 31.49 53.19 44.68 35.99 38.8 46.30 41.91 57.05 37.23 35.16 31.24 49.49 54.86 44.92 42.62
bPQ 57.30 55.75 57.61 41.31 50.64 33.14 50.59 48.72 50.39 57.23 54.77 50.15 57.48 44.47 28.89 59.22 55.17 52.08 56.33
Classification Accuracy 94.12 91.86 79.49 85.39 73.51 74.99 87.01 85.53 88.32 90.73 87.64 82.18 95.06 86.46 76.00 86.74 87.05 92.22 85.86
F1-Score 93.04 89.54 71.89 80.77 74.68 66.24 84.50 81.27 85.33 88.28 85.69 79.59 94.37 86.20 70.21 83.06 83.42 89.95 82.74
Recall 94.12 91.87 79.49 85.39 73.52 74.99 87.01 85.53 88.32 90.73 87.64 82.18 95.06 86.46 76.00 86.74 87.05 92.22 81.96
The F1-Score and recall measures align with ac-
curacy, confirming the model’s reliability in identi-
fying and classifying cells. However, lower perfor-
mance in tissues like skin indicates areas for model
improvement. Overall, the classification branch inte-
grates segmentation and boundary detection features
for accurate, context-aware cell classification across
most tissue types.
4.3 Performance Comparison with
State-of-Art Approaches
We compare our approach to state-of-the-art models
(PSI-Net, HoVer-Net, and TSFD-Net) based on preci-
sion, F1-score, and recall, as shown in Tables 3 and 4.
Our model demonstrates superior generalization with
high median precision and a balanced distribution,
avoiding the overfitting seen in PSI-Net. It achieves
tighter and more consistent F1-scores than TSFD-Net
and higher recall than both PSI-Net and TSFD-Net,
while matching HoVer-Net’s performance. These re-
sults highlight the model’s robust and well-balanced
performance across key metrics.
Table 4 shows box plots visualizing the perfor-
mance metrics of each model across accuracy, F1-
score, and recall. Each box represents the interquar-
tile range (IQR), containing the middle 50% of the
data, with the median score indicated by the line in-
side the box. Whiskers extend up to 1.5 times the
IQR, with points outside representing outliers. The
median accuracy and F1-score are around 0.92, with
most values between 0.90 and 0.94, while recall has
a slightly lower median of 0.91, with scores ranging
from 0.89 to 0.93. A few outliers suggest variability
across cases. Overall, the model performs well across
metrics, with consistent results and potential for re-
finement in specific cases.
4.4 Qualitative Evaluation
Qualitative evaluation, shown in Figure 3, demon-
strates our approach’s effectiveness in segmenting
and classifying cell types in histological images.
The original images with ground truth and predicted
boundaries highlight the model’s ability to accurately
detect and delineate cell boundaries. The colored
boundaries indicate successful identification and clas-
sification of cell types, including neoplastic, non-
neoplastic epithelial, and inflammatory cells. The
model handles overlapping and irregularly shaped
cells with precision. The qualitative results validate
the model’s strength in providing accurate segmen-
tation for histological analysis and cancer diagno-
sis.In this figure, we present a qualitative compari-
son of our approach with several related works on
the PanNuke dataset. Subfigure (a) shows the origi-
nal histological images, while subfigure (b) illustrates
the pre-segmented ground truth for different tissue
types (e.g., Bile-duct, Prostate, Kidney). Subfigure
(c) displays the multi-class segmentation results pro-
duced by our approach, accurately differentiating cell
types and structures. Subfigure (d) represents the pre-
processed boundary masks we generated, followed by
subfigure (e), which shows the binary boundary seg-
mentation prediction for the respective tissues. Fi-
nally, subfigure (f) illustrates the final results after
applying the Classification Guided Module (CGM),
which fuses the segmentation and boundary detection
results and overlays colored contours on the classified
cells for visualization purposes. This comprehensive
illustration provides insights into how our method
outperforms traditional approaches, improving both
segmentation and boundary detection outcomes.
4.5 Results and Discussion
Our proposed approach SBC-UNet3+ has achieved
outstanding performance in key metrics compared
SBC-UNet3+: Classification of Nuclei in Histology Imaging Based on Multi Branch UNET3+ Segmentation Model
607
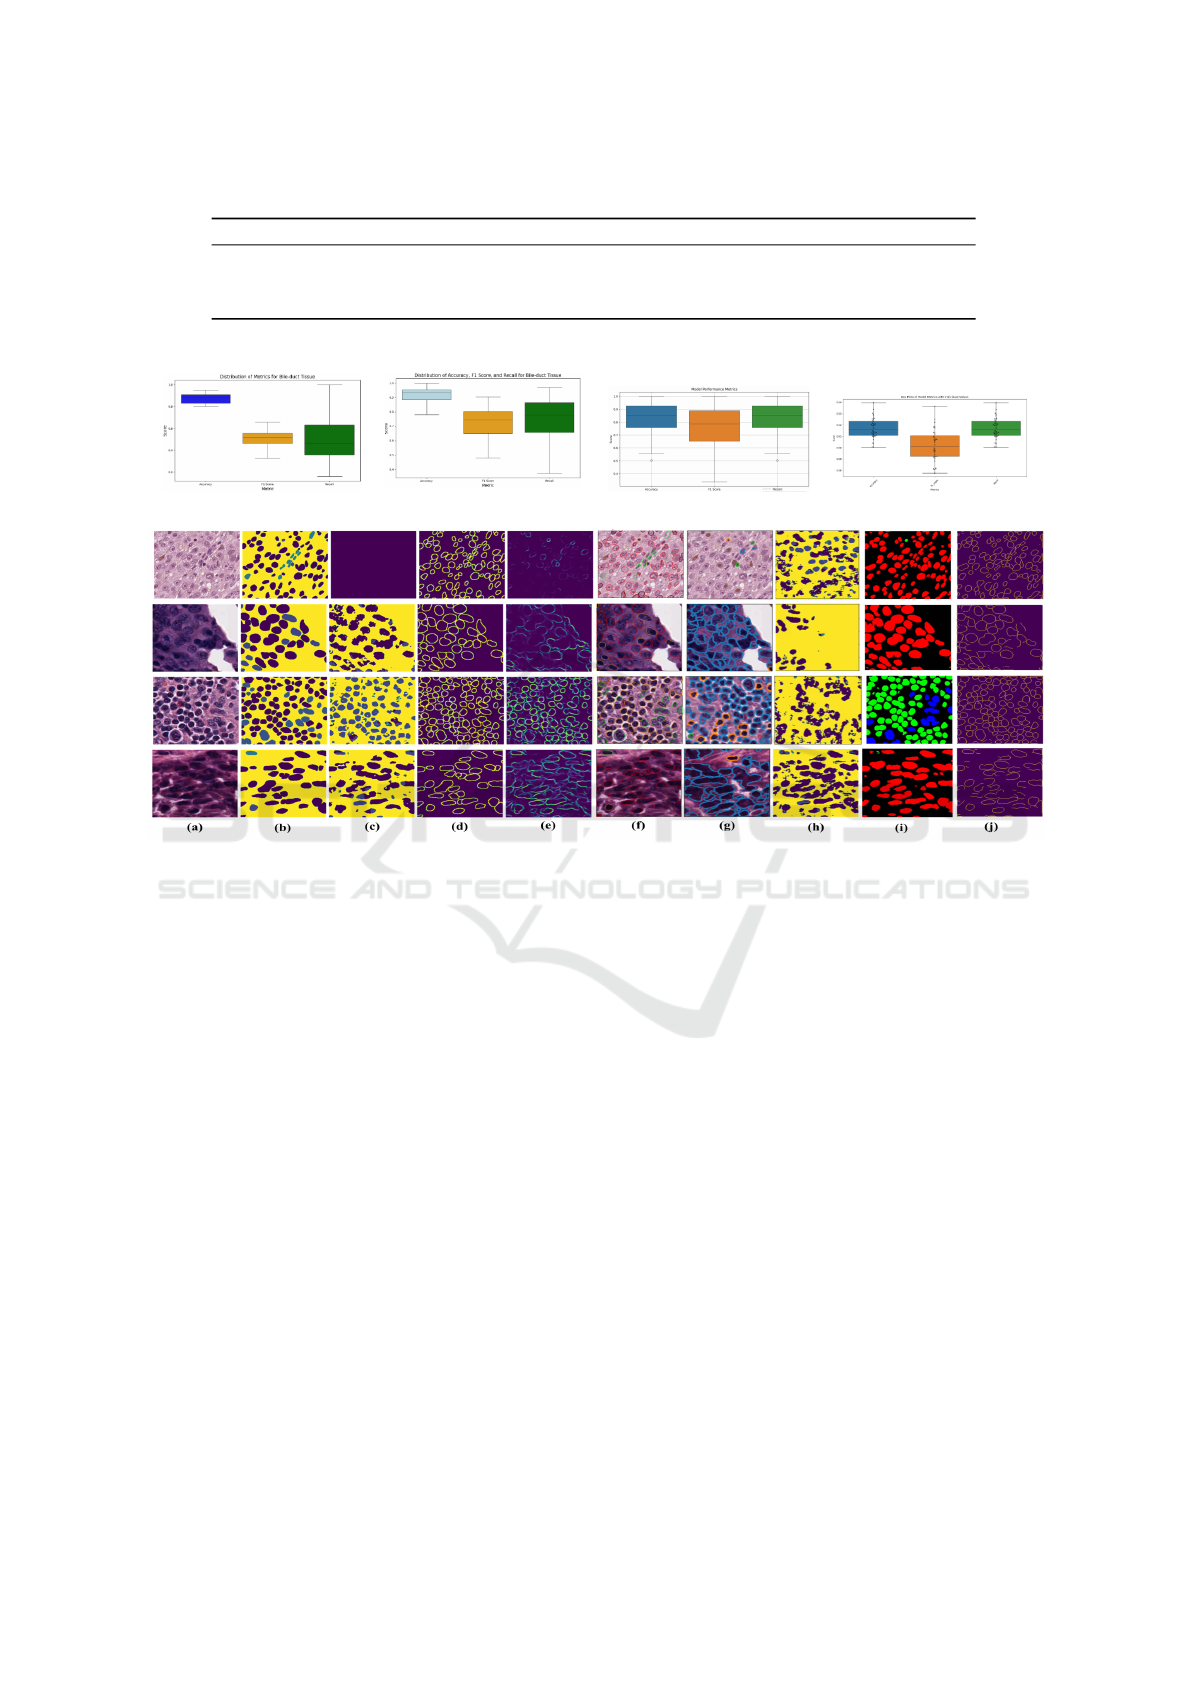
Table 3: Comparison with cutting-edge approaches on PanNuke dataset.
Ref. Accuracy mPQ bPQ Dice coefficient Mean IoU Recall F1-Score
(Ilyas et al., 2022) TSFD-Net (2022) 84.76 52.67 44.0 70.0 34.08 84.76 78.19
(Murugesan et al., 2019) Psi-Net (2019) 85.05 34.76 83.56 54.23 42.15 47.71 49.55
(Graham et al., 2019) HoVer-Net (2019) 87.78 32.71 43.60 61.03 47.53 58.81 61.03
SBC-UNet3+ 89.61 42.62 50.91 99.08 83.16 85.94 89.19
Table 4: Box Plots of Model Performance Metrics: Accuracy, F1 Score, and Recall.
PsiNet HoVerNet TSFD-Net Our SBC-UNET3+
Figure 3: Evaluation of our approach on the PanNuke Dataset compared to related works. (a) Input images, (b) Ground truth,
(c) Segmentation results, (d) preprocessed Boundary masks, (e) Binary boundary segmentation, (f) CGM results with colored
contours, (g) HoverNet results (Graham et al., 2019), (h) Psi-Net results (Murugesan et al., 2019), (i) and (j) TSFD-Net
segmentation and boundary results (Ilyas et al., 2022).
to existing state-of-the-art approaches. Indeed, it
achieves a high recall value of 85.94% and also F1-
Score value of 89.19%, which are superior to those of
HoVer-Net, a leading approach in the field. Moreover,
the accuracy of our model reaches 89.61%, proving
its robust ability to correctly identify and segment
cells. Notably, the dice coefficient of 99.08% and
IoU of 83.16% highlight the accuracy of our boundary
delineation and segmentation processes. However,
our model produces lower mPQ and bPQ values of
42.62% and 50.91%, respectively, compared to other
metrics, indicating a limitation in using these panop-
tic metrics for evaluation in this specific domain.
However, histological cell segmentation involves
unique challenges, such as the need for precise bound-
ary delineation, handling overlapping cells, and dis-
tinguishing subtle class differences, making panoptic
quality less suitable as an evaluation metric. Met-
rics such as dice coefficient, boundary-specific IoU,
or other boundary-specific measures are often more
appropriate to capture the nuances needed for histo-
logical analysis. In histological cell segmentation, in-
dividual cells can be very small, irregularly shaped,
and often overlap, creating complex and ambiguous
boundaries. This complexity challenges the assump-
tion of distinct and well-separated objects inherent in
the PQ metric.
The fact that PQ relies on IoU rather than direct
boundary accuracy makes it less sensitive to the types
of errors that are critical in histology. For instance, a
small error in boundary detection could cause a sub-
stantial drop in IoU and, consequently, PQ scores.
More importantly, such errors can lead to incorrect
biological interpretations, undermining the reliability
of the analysis. Therefore, while PQ is a robust met-
ric for certain applications, its limitations in handling
overlapping and closely packed instances with subtle
class differences make it less suitable for evaluating
histological cell segmentation models. Our approach
addresses these challenges effectively, as evidenced
by the superior performance in boundary-sensitive
metrics, demonstrating its suitability and robustness
for this specialized task.
VISAPP 2025 - 20th International Conference on Computer Vision Theory and Applications
608

5 CONCLUSION AND FUTURE
WORK
In conclusion, we introduced SBC-UNet3+, a cell
segmentation and classification model for histologi-
cal images. Our model surpasses existing methods in
segmentation, boundary detection, and classification
by utilizing full-scale skip connections and Convolu-
tional Block Attention Module (CBAM) mechanisms,
ensuring accurate segmentation and enhanced bound-
ary delineation. This is crucial for capturing morpho-
logical details and differentiating overlapping cells,
which is vital for histopathological diagnosis. Future
work will explore integrating graph-based techniques
to improve tissue analysis, using probabilistic models
to refine graph accuracy and feature representation,
which could offer deeper insights into tissue structure
and phenotypic relationships, advancing medical im-
age analysis and cancer diagnosis.
REFERENCES
Chen, K., Zhang, N., Powers, L., and Roveda, J. (2019).
Cell nuclei detection and segmentation for computa-
tional pathology using deep learning. In 2019 Spring
Simulation Conference (SpringSim), pages 1–6.
Chen, S., Ding, C., Liu, M., Cheng, J., and Tao, D. (2023).
Cpp-net: Context-aware polygon proposal network
for nucleus segmentation. IEEE Transactions on Im-
age Processing, 32:980–994.
Cutler, K. J., Stringer, C., Wiggins, P. A., and
Mougous, J. D. (2022). Omnipose: a high-precision
morphology-independent solution for bacterial cell
segmentation. bioRxiv.
Feng, Z., Wang, Z., Wang, X., Mao, Y., Li, T., Lei, J., Wang,
Y., and Song, M. (2021). Mutual-complementing
framework for nuclei detection and segmentation in
pathology image. In 2021 IEEE/CVF International
Conference on Computer Vision (ICCV), pages 4016–
4025.
Gamper, J., Koohbanani, N. A., Benes, K., Graham, S., Ja-
hanifar, M., Khurram, S. A., Azam, A., Hewitt, K.,
and Rajpoot, N. (2020). Pannuke dataset extension,
insights and baselines.
Graham, S., Vu, Q. D., Raza, S. E. A., Azam, A., Tsang,
Y. W., Kwak, J. T., and Rajpoot, N. (2019). Hover-
net: Simultaneous segmentation and classification of
nuclei in multi-tissue histology images. Medical Im-
age Analysis, 58:101563.
H
¨
orst, F., Rempe, M., Heine, L., Seibold, C., Keyl, J., Bal-
dini, G., Ugurel, S., Siveke, J., Gr
¨
unwald, B., Egger,
J., and Kleesiek, J. (2024). Cellvit: Vision transform-
ers for precise cell segmentation and classification.
Medical Image Analysis, 94:103143.
Ibtehaz, N. and Rahman, M. S. (2020). Multiresunet
: Rethinking the u-net architecture for multimodal
biomedical image segmentation. Neural Networks,
121:74–87.
Ilyas, T., Mannan, Z. I., Khan, A., Azam, S., Kim, H., and
De Boer, F. (2022). Tsfd-net: Tissue specific feature
distillation network for nuclei segmentation and clas-
sification. Neural Networks, 151:1–15.
Im, Y.-H., Park, S.-H., and Lee, S.-C. (2024). Hda-net: H&e
and rgb dual attention network for nuclei instance seg-
mentation. IEEE Access, 12:56622–56632.
Khuriwal, N. and Mishra, N. (2018). Breast cancer detec-
tion from histopathological images using deep learn-
ing. In 2018 3rd International Conference and Work-
shops on Recent Advances and Innovations in Engi-
neering (ICRAIE), pages 1–4.
Kumar, N., Gupta, R., and Gupta, S. (2020). Whole slide
imaging (wsi) in pathology: Current perspectives and
future directions. Journal of Digital Imaging, 33.
Murugesan, B., Sarveswaran, K., Shankaranarayana, S. M.,
Ram, K., and Sivaprakasam, M. (2019). Psi-net:
Shape and boundary aware joint multi-task deep
network for medical image segmentation. CoRR,
abs/1902.04099.
Raza, S. E. A., Cheung, L., Shaban, M., Graham, S., Ep-
stein, D., Pelengaris, S., Khan, M., and Rajpoot, N. M.
(2019). Micro-net: A unified model for segmentation
of various objects in microscopy images. Medical Im-
age Analysis, 52:160–173.
Rizzo, P., Girolami, I., Marletta, S., Pantanowitz, L., An-
tonini, P., Brunelli, M., Santonicco, N., Vacca, P., Tu-
mino, N., Moretta, L., Parwani, A., Satturwar, S., Ec-
cher, A., and Munari, E. (2022). Technical and diag-
nostic issues in whole slide imaging published vali-
dation studies. Frontiers in Oncology, 12. Publisher
Copyright: Copyright © 2022 Rizzo, Girolami, Mar-
letta, Pantanowitz, Antonini, Brunelli, Santonicco,
Vacca, Tumino, Moretta, Parwani, Satturwar, Eccher
and Munari.
Ronneberger, O., Fischer, P., and Brox, T. (2015). U-net:
Convolutional networks for biomedical image seg-
mentation. volume 9351, pages 234–241.
Stringer, C., Michaelos, M., and Pachitariu, M. (2020).
Cellpose: a generalist algorithm for cellular segmen-
tation. bioRxiv.
van Rijthoven, M., Balkenhol, M., Silin¸a, K., van der Laak,
J., and Ciompi, F. (2020). Hooknet: multi-resolution
convolutional neural networks for semantic segmenta-
tion in histopathology whole-slide images.
Yao, K., Huang, K., Sun, J., and Hussain, A. (2024).
Pointnu-net: Keypoint-assisted convolutional neural
network for simultaneous multi-tissue histology nu-
clei segmentation and classification. IEEE Transac-
tions on Emerging Topics in Computational Intelli-
gence, 8(1):802–813.
Zhao, Y., Yang, F., Fang, Y., Liu, H., Zhou, N., Zhang,
J., Sun, J., Yang, S., Menze, B., Fan, X., and Yao,
J. (2020). Predicting lymph node metastasis us-
ing histopathological images based on multiple in-
stance learning with deep graph convolution. In 2020
IEEE/CVF Conference on Computer Vision and Pat-
tern Recognition (CVPR), pages 4836–4845.
SBC-UNet3+: Classification of Nuclei in Histology Imaging Based on Multi Branch UNET3+ Segmentation Model
609
